. 2024 Feb 17;19(1):19.
doi: 10.1186/s13024-024-00707-x.

Plasma N-terminal containing tau fragments (NTA-tau): a biomarker of tau deposition in Alzheimer's Disease

Affiliations

Plasma N-terminal containing tau fragments (NTA-tau): a biomarker of tau deposition in Alzheimer's Disease

Juan Lantero-Rodriguez et al. Mol Neurodegener. .

Abstract

Background: Novel phosphorylated-tau (p-tau) blood biomarkers (e.g., p-tau181, p-tau217 or p-tau231), are highly specific for Alzheimer's disease (AD), and can track amyloid-β (Aβ) and tau pathology. However, because these biomarkers are strongly associated with the emergence of Aβ pathology, it is difficult to determine the contribution of insoluble tau aggregates to the plasma p-tau signal in blood. Therefore, there remains a need for a biomarker capable of specifically tracking insoluble tau accumulation in brain.

Methods: NTA is a novel ultrasensitive assay targeting N-terminal containing tau fragments (NTA-tau) in cerebrospinal fluid (CSF) and plasma, which is elevated in AD. Using two well-characterized research cohorts (BioFINDER-2, n = 1,294, and BioFINDER-1, n = 932), we investigated the association between plasma NTA-tau levels and disease progression in AD, including tau accumulation, brain atrophy and cognitive decline.

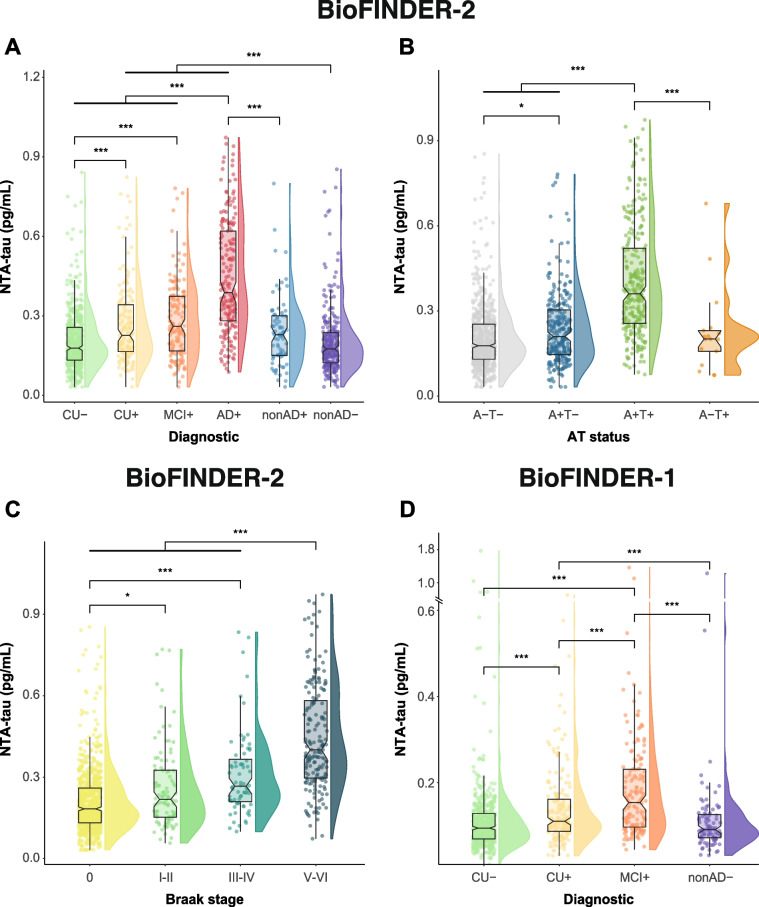
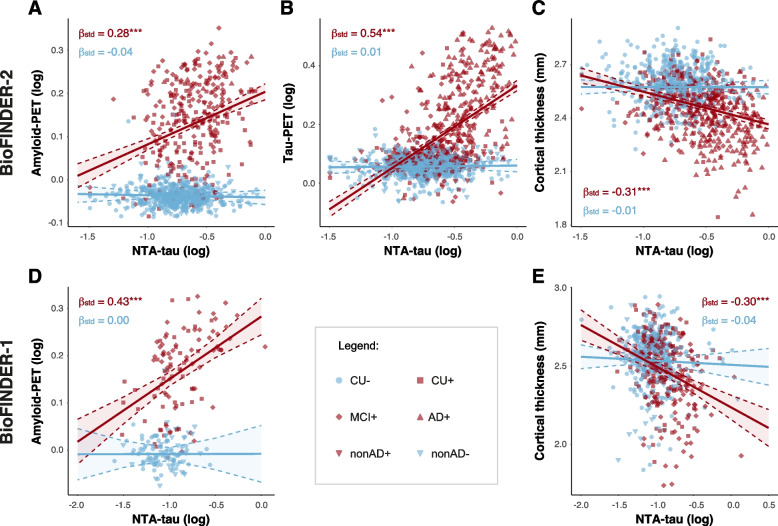
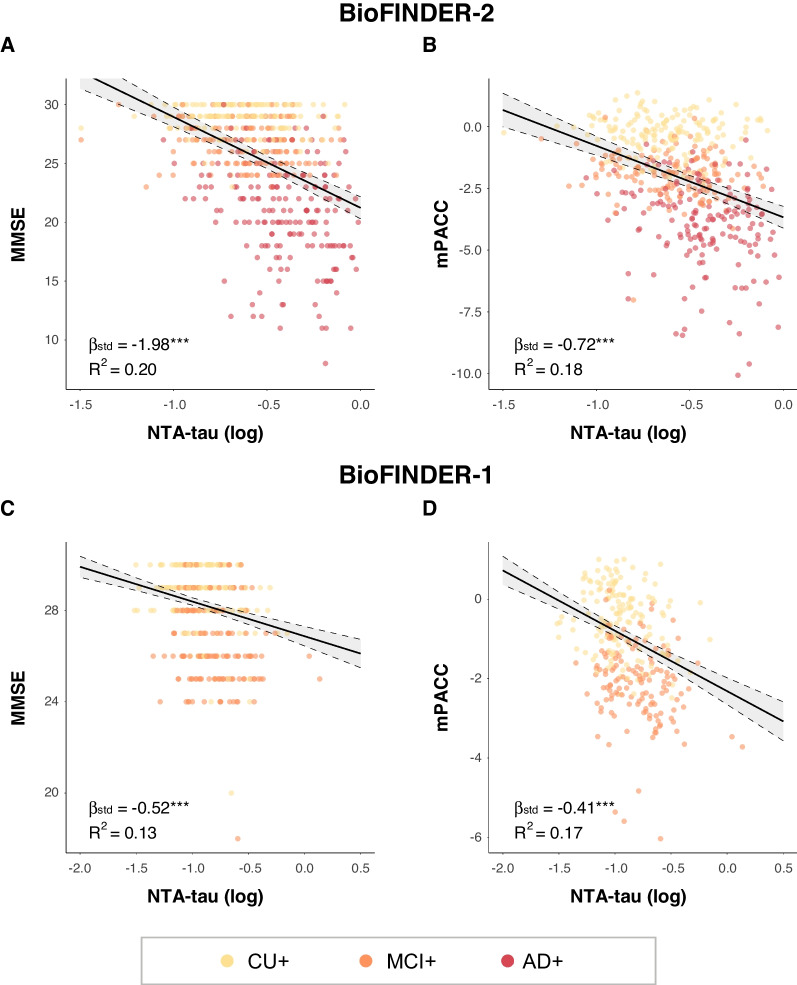
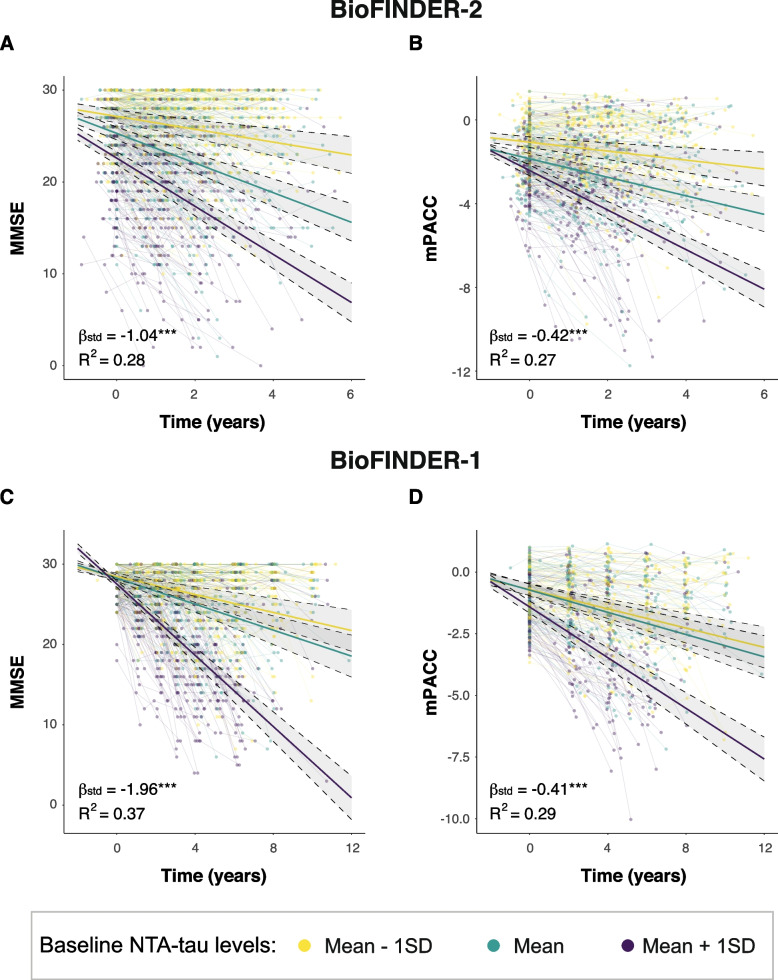
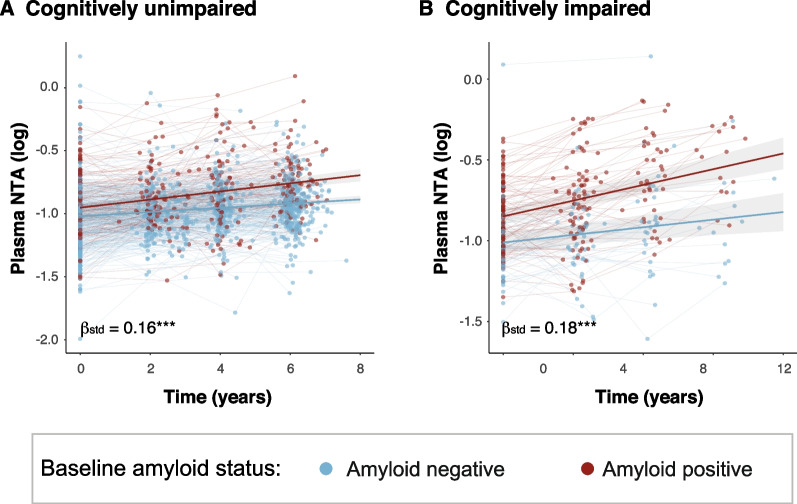
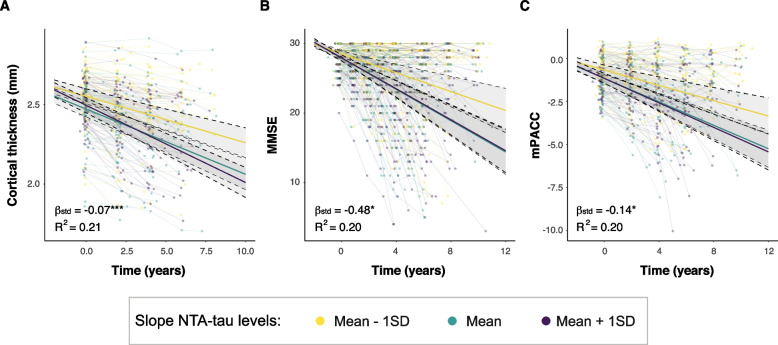
Results: We demonstrate that plasma NTA-tau increases across the AD continuum¸ especially during late stages, and displays a moderate-to-strong association with tau-PET (β = 0.54, p < 0.001) in Aβ-positive participants, while weak with Aβ-PET (β = 0.28, p < 0.001). Unlike plasma p-tau181, GFAP, NfL and t-tau, tau pathology determined with tau-PET is the most prominent contributor to NTA-tau variance (52.5% of total R2), while having very low contribution from Aβ pathology measured with CSF Aβ42/40 (4.3%). High baseline NTA-tau levels are predictive of tau-PET accumulation (R2 = 0.27), steeper atrophy (R2 ≥ 0.18) and steeper cognitive decline (R2 ≥ 0.27) in participants within the AD continuum. Plasma NTA-tau levels significantly increase over time in Aβ positive cognitively unimpaired (βstd = 0.16) and impaired (βstd = 0.18) at baseline compared to their Aβ negative counterparts. Finally, longitudinal increases in plasma NTA-tau levels were associated with steeper longitudinal decreases in cortical thickness (R2 = 0.21) and cognition (R2 = 0.20).

Conclusion: Our results indicate that plasma NTA-tau levels increase across the AD continuum, especially during mid-to-late AD stages, and it is closely associated with in vivo tau tangle deposition in AD and its downstream effects. Moreover, this novel biomarker has potential as a cost-effective and easily accessible tool for monitoring disease progression and cognitive decline in clinical settings, and as an outcome measure in clinical trials which also need to assess the downstream effects of successful Aβ removal.

Keywords: Alzheimer’s disease; BioFINDER; Biomarkers; NTA; NTA-tau; Plasma; Tau; Tau pathology; Tau-PET.


Conflict of interest statement

KB has served as a consultant and at advisory boards for Acumen, ALZPath, BioArctic, Biogen, Eisai, Julius Clinical, Lilly, Novartis, Ono Pharma, Prothena, Roche Diagnostics, and Siemens Healthineers; has served at data monitoring committees for Julius Clinical and Novartis; has given lectures, produced educational materials and participated in educational programs for Biogen, Eisai and Roche Diagnostics; and is a co-founder of Brain Biomarker Solutions in Gothenburg AB (BBS), which is a part of the GU Ventures Incubator Program, outside the work presented in this paper. HZ has served at scientific advisory boards and/or as a consultant for Abbvie, Acumen, Alector, Alzinova, ALZPath, Annexon, Apellis, Artery Therapeutics, AZTherapies, CogRx, Denali, Eisai, Nervgen, Novo Nordisk, Optoceutics, Passage Bio, Pinteon Therapeutics, Prothena, Red Abbey Labs, reMYND, Roche, Samumed, Siemens Healthineers, Triplet Therapeutics, and Wave, has given lectures in symposia sponsored by Cellectricon, Fujirebio, Alzecure, Biogen, and Roche, and is a co-founder of Brain Biomarker Solutions in Gothenburg AB (BBS), which is a part of the GU Ventures Incubator Program (outside submitted work). OH has acquired research support (for the institution) from ADx, AVID Radiopharmaceuticals, Biogen, Eli Lilly, Eisai, Fujirebio, GE Healthcare, Pfizer, and Roche. In the past 2 years, he has received consultancy/speaker fees from AC Immune, Amylyx, Alzpath, BioArctic, Biogen, Cerveau, Eisai, Eli Lilly, Fujirebio, Genentech, Merck, Novartis, Novo Nordisk, Roche, Sanofi and Siemens. JLR, GS, AES, LMG, WSB, ALB, NMC, PT, SJ, SP, ES and NJA report no conflicts of interest.

Figures

Fig. 1
Fig. 1
Plasma NTA-tau levels across clinical diagnosis and disease stages. Plasma NTA-tau levels in BioFINDER-2 by clinical diagnosis (A), A/T status (B) and Braak stages (C). Plasma NTA-tau levels in BioFINDER-1 by clinical diagnosis (D). Differences of plasma levels by diagnostic groups were measured using ANCOVA and Tukey’s method for post-hoc comparisons. Age and sex were used as covariates in all cases. Aβ (A) status was assessed using CSF Aβ42/40 levels and tau (T) status using tau-PET SUVR based on previously validated cut-offs. Participants with available tau-PET imaging were stratified according to the PET Braak stages in a hierarchical manner, based on regional SUVR cut-offs. In D we divided the y-axis to show few cases with very high plasma NTA-tau levels. *: p < 0.05; **: p < 0.01; ***: p < 0.001. Box plots include all participants, displaying the median and the interquartile range; whiskers show the lower value of maximum/minimum value or 1.5 interquartile range from the hinge. Abbreviations: Aβ, amyloid-β; AD+ , Alzheimer’s dementia Aβ-positive; A-T-, Aβ and tau negative; A+T-, Aβ-positive tau negative; A+T+ , Aβ and tau positive; A-T+ , Aβ-negative tau positive; CSF, cerebrospinal fluid; CU-, cognitively unimpaired Aβ-negative; CU+ , cognitively unimpaired Aβ-positive; MCI+ , mild cognitive impairment Aβ-positive nonAD+ ; non-Alzheimer’s type dementia Aβ-positive; non-AD-, non-Alzheimer’s type dementia Aβ-negative; SUVR, standardized uptake value ratio
Fig. 2
Fig. 2
Cross-sectional associations between plasma NTA-tau and Aβ-PET, tau-PET and cortical thickness. Cross-sectional associations between plasma NTA-tau levels and Aβ-PET (A, D), tau-PET (B) and cortical thickness (C, E) by Aβ-status in BioFINDER-2 (A, B and C) and BioFINDER-1 (D and E). Linear regressions with plasma NTA-tau levels as predictor were used to measure the association with Aβ-PET (Centiloids), tau-PET (SUVR), cortical thickness (AD-signature). Standardized β (βstd) and p-values of the associations for each group are shown in the plot coloured accordingly (red: Aβ-positive, blue: Aβ-negative). Age and sex were used as covariates in all cases. Non-AD patients were excluded in the analyses with cortical thickness. Aβ-status was determined using CSF Aβ42/40. *: p < 0.05; **: p < 0.01; ***: p < 0.001. Abbreviations: Aβ, amyloid-β; AD, Alzheimer’s disease; FDR, false discovery rate; nonAD+ ; non-Alzheimer’s type dementia Aβ-positive; SUVR, standardized uptake value ratio
Fig. 3
Fig. 3
Proportion of variation in plasma NTA levels explained by Aβ, tau and neurodegeneration. Performance of different models for predicting plasma NTA-tau levels are shown in A. Each barplot represents one independent model, including CSF Aβ42/40 (A), tau-PET SUVR (T) and/or cortical thickness (N) as predictors in multivariable models. All models are adjusted for age and sex. Basic model includes only covariates. R2 values are shown inside the barplots and AICc of each model is shown on top. The optimal model predicting plasma NTA-tau was A&T because it had the highest R2 and the lowest AICc. Partial R2 of Aβ (CSF A β42/40) and tau (tau-PET) for predicting NTA-tau levels are shown in B (all participants, n = 1,294) and C (subsample with t-tau, n = 715). Light green bars represent the variance explained by tau and dark green bars represent that explained by Aβ. Other plasma biomarkers available are shown for comparison. Partial R2 values are shown inside the bars and percentage of the total R2 of the model are shown on top. In all cases, age and sex were used as covariates. NonAD participants were excluded from these analyses to avoid bias from neurodegeneration markers. Abbreviations: Aβ, amyloid-β; AICc, corrected Akaike criterion; CSF, cerebrospinal fluid; nonAD, non-Alzheimer’s type dementia; SUVR, standardized uptake value ratio
Fig. 4
Fig. 4
Cross-sectional associations between plasma NTA-tau and cognition. Cross-sectional associations between plasma NTA-tau levels and MMSE (A and C) and mPACC (B and D) in BioFINDER-2 (A and B) and BioFINDER-1 (C and D). Linear regressions with plasma NTA-tau levels as predictor and cognitive tests as outcome were used to measure the association. Age, sex and years of education were used as covariates in all cases. Only Aβ+ participants within the AD continuum (excluding nonAD+) were included in the analyses. Standardized β (βstd) and p-values of the associations as well as the R2 of the model are shown in the plots. *: p < 0.05; **: p < 0.01; ***: p < 0.001. Abbreviations: Aβ, amyloid-β; AD, Alzheimer’s disease; MMSE, Mini-Mental State Examination; mPACC, mPACC, modified preclinical Alzheimer’s cognitive composite; nonAD+ ; non-Alzheimer’s type dementia Aβ-positive
Fig. 5
Fig. 5
Baseline plasma NTA-tau association with longitudinal tau-PET and neurodegeneration. Associations between baseline plasma NTA-tau levels and longitudinal tau-PET (A) and cortical thickness determined through MRI (B and C, BioFINDER-2 and -1 respectively). We used linear mixed models with tau-PET (SUVR) and cortical thickness (mm) as outcome and the interaction of baseline plasma biomarkers and time as predictor with random intercepts and random time-slopes. Age and sex were used as covariates. Dots and thin lines represent individual timepoints and trajectories, respectively, for each participant. Each participant is coloured based on its baseline plasma NTA-tau levels. Thick lines and shaded areas represent the mean trajectory over time of each group of plasma NTA-tau baseline levels and its 95%CI. Standardized β (βstd) and p-values of the associations as well as the R2 of the model are shown in the plots. Only Aβ+ within the AD continuum (excluding nonAD+) were included in these analyses, as were those expected to progress. Standardized β (βstd) and p-values of the associations as well as the R2 of the model are shown in the plots. *: p < 0.05; **: p < 0.01; ***: p < 0.001. Abbreviations: Aβ, amyloid-β; AD, Alzheimer’s disease; CI, confidence interval; nonAD+ ; non-Alzheimer’s type dementia Aβ-positive; SUVR, standardized uptake value ratio
Fig. 6
Fig. 6
Baseline plasma NTA-tau association with cognitive decline. Associations between baseline plasma NTA-tau levels and longitudinal cognitive measures (A and C: MMSE, B and D: mPACC) in BioFINDER-2 (A and B) and BioFINDER-1 (C and D). We used linear mixed models with cognitive measures as outcome and the interaction of baseline plasma biomarkers and time as predictor with random intercepts and random time-slopes. Age, sex and years of education were used as covariates. Dots and thin lines represent individual timepoints and trajectories, respectively, for each participant. Each participant is coloured based on its baseline plasma NTA-tau levels. Thick lines and shaded areas represent the mean trajectory over time of each group of plasma NTA-tau baseline levels and its 95%CI. Only Aβ+ within the AD continuum (excluding nonAD+) were included in these analyses, as were those expected to progress. *: p < 0.05; **: p < 0.01; ***: p < 0.001. Abbreviations: Aβ, amyloid-β; AD, Alzheimer’s disease; CI, confidence interval; MMSE, Mini-Mental State Examination; mPACC, mPACC, modified preclinical Alzheimer’s cognitive composite; nonAD+ ; non-Alzheimer’s type dementia Aβ-positive
Fig. 7
Fig. 7
Longitudinal plasma NTA-tau association with baseline Aβ status. Longitudinal plasma NTA-tau changes classified by baseline Aβ status (negative, blue; positive, red) in in cognitively unimpaired (A) and impaired participants (B) from BioFINDER-1. Plasma NTA-tau levels were used as outcome in linear mixed models with the interaction between Aβstatus and time as predictor. Age and sex were included as covariates. Aβ-status was based on CSF Aβ42/40 levels. Standardized β (βstd) and p-values of the interaction term are shown in the plots. *: p < 0.05; **: p < 0.01; ***: p < 0.001. Abbreviations: Aβ, amyloid-β; CSF, cerebrospinal fluid
Fig. 8
Fig. 8
Longitudinal plasma NTA-tau association with over time changes in brain atrophy and cognition. Association between longitudinal plasma NTA-tau levels and longitudinal changes in cortical thickness (A) and cognitive performance (B, MMSE; C, mPACC). We used linear mixed models with cognitive measures as outcome and the interaction of plasma NTA-tau longitudinal changes and time as predictor with random intercepts and random time-slopes. Age, sex and education were used as covariates. Plasma NTA-tau longitudinal changes were derived from a linear mixed model with time as the only predictor, with random slopes and intercepts. Dots and thin lines represent individual timepoints and trajectories of cortical thickness or cognitive measures for each participant. Each participant is coloured based on its longitudinal plasma NTA-tau changes. Thick lines and shaded areas represent the mean trajectory over time of each group of plasma NTA-tau slopes and its 95%CI. Only Aβ+ within the AD continuum (excluding nonAD+) were included in these analyses, as were those expected to progress. *: p < 0.05; **: p < 0.01; ***: p < 0.001. Abbreviations: Aβ, amyloid-β; CI, confidence interval; MMSE, Mini-Mental State Examination; mPACC, mPACC, modified preclinical Alzheimer’s cognitive composite; nonAD+ ; non-Alzheimer’s type dementia Aβ-positive

Similar articles

Cited by

References

    1. Braak H, Braak E. Neuropathological stageing of Alzheimer-related changes. Acta Neuropathol. 1991;82(4):239–259. doi: 10.1007/BF00308809. - DOI - PubMed
    1. Thal DR, Rub U, Orantes M, Braak H. Phases of A beta-deposition in the human brain and its relevance for the development of AD. Neurology. 2002;58(12):1791–1800. doi: 10.1212/WNL.58.12.1791. - DOI - PubMed
    1. Blennow K, de Leon MJ, Zetterberg H. Alzheimer's disease. Lancet. 2006;368(9533):387–403. doi: 10.1016/S0140-6736(06)69113-7. - DOI - PubMed
    1. Jack CR, Jr, Knopman DS, Jagust WJ, Petersen RC, Weiner MW, Aisen PS, et al. Tracking pathophysiological processes in Alzheimer's disease: an updated hypothetical model of dynamic biomarkers. Lancet Neurol. 2013;12(2):207–216. doi: 10.1016/S1474-4422(12)70291-0. - DOI - PMC - PubMed
    1. Jack CR, Jr, Bennett DA, Blennow K, Carrillo MC, Dunn B, Haeberlein SB, et al. NIA-AA Research Framework: Toward a biological definition of Alzheimer's disease. Alzheimers Dement. 2018;14(4):535–562. doi: 10.1016/j.jalz.2018.02.018. - DOI - PMC - PubMed

Grants and funding