. 2024 Feb 16;15(1):1423.
doi: 10.1038/s41467-024-45737-7.

Cellular hierarchy insights reveal leukemic stem-like cells and early death risk in acute promyelocytic leukemia

Affiliations

Cellular hierarchy insights reveal leukemic stem-like cells and early death risk in acute promyelocytic leukemia

Wen Jin et al. Nat Commun. .

Abstract

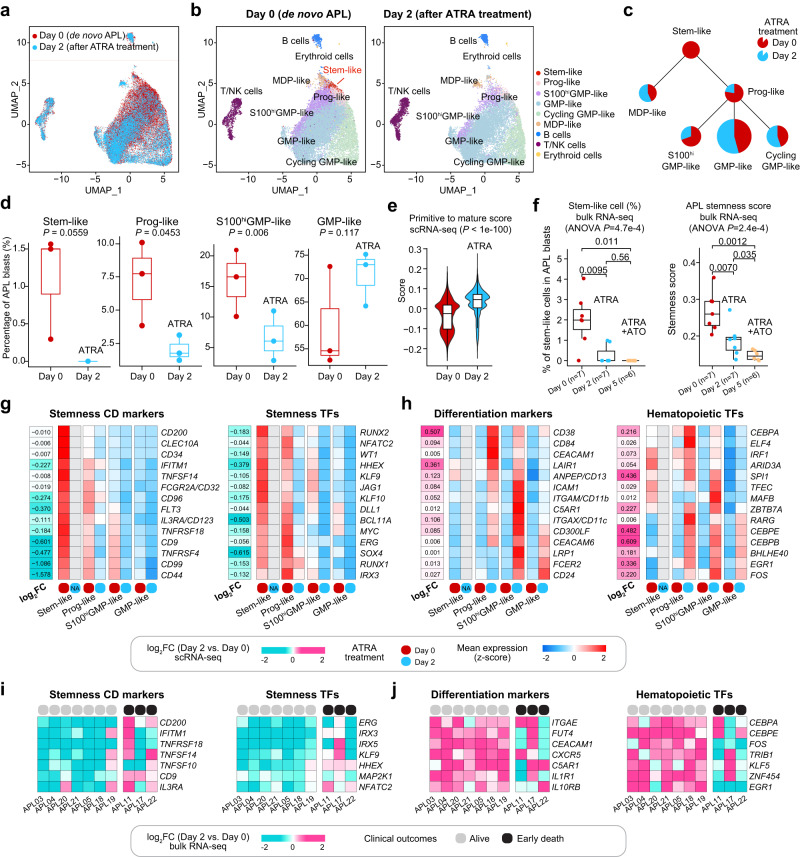
Acute promyelocytic leukemia (APL) represents a paradigm for targeted differentiation therapy, with a minority of patients experiencing treatment failure and even early death. We here report a comprehensive single-cell analysis of 16 APL patients, uncovering cellular compositions and their impact on all-trans retinoic acid (ATRA) response in vivo and early death. We unveil a cellular differentiation hierarchy within APL blasts, rooted in leukemic stem-like cells. The oncogenic PML/RARα fusion protein exerts branch-specific regulation in the APL trajectory, including stem-like cells. APL cohort analysis establishes an association of leukemic stemness with elevated white blood cell counts and FLT3-ITD mutations. Furthermore, we construct an APL-specific stemness score, which proves effective in assessing early death risk. Finally, we show that ATRA induces differentiation of primitive blasts and patients with early death exhibit distinct stemness-associated transcriptional programs. Our work provides a thorough survey of APL cellular hierarchies, offering insights into cellular dynamics during targeted therapy.


Conflict of interest statement

The authors declare no competing interests.

Figures

Fig. 1
Fig. 1. Characterization of APL blasts through an integrative analysis of scRNA-seq data from APL and normal bone marrow (BM) cells.
a Overview of the experimental strategy. b UMAP plots of APL and normal BM cells (n = 239,332 cells), with color-coding indicating sample types (left panel), inferred cell populations (middle panel), and PML/RARα-positive cells detected by scTarget in two APL samples (right panel). Cells detected with more than three PML/RARα fusion reads are illustrated. HSPCs hematopoietic stem/progenitor cells, GMPs granulocyte-monocyte progenitors, NK Natural Killer, Ery erythroid. c UMAP plots with each cell (n = 239,332 cells) colored according to their normalized expression of MPO, CD14, CD3E, CD79A, and CA1, respectively. d Normalized expression level and expression percentage of cell type-specific genes in eight cell populations in APL and normal BM cells. e, f Gene Ontology (GO) enrichment analysis showing significantly enriched biological process terms for upregulated genes (e) and downregulated genes (f) in APL blasts compared with GMPs. g Inferred activated (red) and repressed (blue) TFs in APL blasts compared to normal GMPs. The central two-row graph illustrates the distribution of activated targets (depicted in red) and repressed targets (depicted in blue) of different TFs, with positions ranked according to the differential expression between APL blasts and normal GMPs (leftmost: most downregulated in APL blasts, rightmost: most upregulated in APL blasts). The regulatory model was based on the ARACNe-inferred interactome, provided in the build-in function of the VIPER R package. The P-value is shown on the left of the column, and the inferred differential activity level is shown on the right. The P-values were calculated using the msviper function in the VIPER R package. Two-sided P-values were calculated. APP antigen processing and presentation; MHC major histocompatibility complex.
Fig. 2
Fig. 2. Characterization of intratumoral heterogeneity in APL blasts reveals a complex trajectory with multiple branches and a small subpopulation of APL stem-like cells.
a UMAP plot of APL blasts (upper panel; n = 126,802 cells). Eighteen clusters are labeled in different colors and numbers (lower panel). GMP granulocyte-monocyte progenitors, EOS eosinophils, Prog progenitors, MDP monocyte-DC progenitors, PrecDC pre-conventional dendritic cells, Promono promonocytes. b The left heatmap shows Spearman’s correlation between the 18 APL clusters, calculated using the average expression profiles of the clusters. The right heatmap illustrates the expression levels of cell type-specific genes in each cluster. c Visualization of RNA velocity-based cell-state transitions of APL blasts. d UMAP plot of APL blasts with six branches, i.e., stem-like, Prog-like, S100hiGMP-like, GMP-like, cycling GMP-like, and MDP-like branches. e Pseudotime-ordered analysis of four major branches in APL blasts, including stem-like, Prog-like, S100hiGMP-like, and GMP-like branches. f Heatmap showing the dynamic changes in gene expression (n = 116 genes) along the pseudotime. Cell branches are labeled by colors (upper panel), including stem-like cells (center), S100hiGMP-like cells (left), and GMP-like (right). Characteristic transcription factors (TFs) are listed on the right. g UMAP plots of the targeted scRNA-seq (scTarget) data from two APL patients, with color coding for sample types (left panel) and branches (right panel). On the right panel, cells detected more than three PML/RARα fusion reads were illustrated. h The expression levels of PML/RARα in six branches of APL blasts. i Branch-specific expression patterns for PML/RARα targets across the APL trajectory. The left heatmap visualizes the single-cell expression of PML/RARα-regulated branch-specific marker genes across branches, with rows representing genes and columns for cells. To offer a clear and representative depiction of the branch-specific expression patterns for PML/RARα targets, we selected 1000 cells from each branch for interpretation. The right heatmap displays the mean gene expression (n = 1758 genes) across branches, accompanied by the annotations of representative marker genes on the right side. Cor. correlation, Exp. expression.
Fig. 3
Fig. 3. The crucial role of PML/RARα and FLT3-ITD in regulating the properties of APL stem-like cells.
a Gene set enrichment analysis (GSEA) plot of top 500 PML/RARα targets. The gene set for GSEA analysis was defined based on the top 500 PML/RARα targets according to adjusted P-values derived from CUT&Tag. Genes were ranked by the fold change between APL stem-like cells and HSPCs at the mRNA level. NES normalized enrichment score. The P-value was calculated using GSEA. A two-sided P-value was calculated. b Violin plots illustrating representative genes highly expressed in APL stem-like cells compared with HSPCs. c GO enrichment analysis showing the KEGG pathways enriched in upregulated (left panel) and downregulated (right panel) PML/RARα targets in APL stem-like cells compared with HSPCs. d Master regulator analysis to explore activated (red) and repressed (blue) transcription factors (TFs) in APL stem-like cells compared with HSPCs. e Comparison of the percentages of each branch with and without indicated mutations. n = 16 patients with FLT3-ITD/TKD mutation information and n = 12 patients with NRAS/WT1 mutation information. Error bars in bar plots represent the means ± SE. The P-values were calculated using Student’s t-test and labeled in red when P-values < 0.05. Two-sided P-values were calculated. f Comparison of the LSC17 score (left panel) and the LSC6 score (right panel) of the stem-like cells in APL patients with or without FLT3-ITD. n = 2344 stem-like cells were used for visualization, excluding those with a score of 0 due to the absence of detected gene expression. In the boxplot, a black line within the box marks the median. The bottom and top of the box are located at the 25th and 75th percentiles, respectively. The bars represent values more than 1.5 times the interquartile range from the border of each box. The P-values were calculated using the Wilcoxon rank-sum test. Two-sided P-values were calculated. g Visualization of FLT3 expression through projection onto the UMAP of APL blasts using the scTarget data from two patients. Cells detected with more than three FLT3-ITD mutated reads were color-coded according to the different branches. h The expression levels of FLT3-ITD in the six branches of APL blasts, analyzed using data from FLT3-ITD-specific targeted scRNA-seq (scTarget).
Fig. 4
Fig. 4. Construction of an 11-gene APL stemness score.
a Schematic depicting the APL deconvolution approach and the generation of the APL stemness score using the 16 APL scRNA-seq data as the reference. This improved deconvolution approach is based on the support vector regression (SVR) algorithm: (1) generation of signatures from scRNA-seq populations, including the six APL blasts branches and T/NK cells, B cells, and erythroid cells; (2) calculating the TPM matrix of bulk RNA-seq of the 12 patients with matched scRNA-seq (detailed in “Methods” section); (3) using SVR to calculate the coefficients of each scRNA-seq population from bulk RNA-seq and performing linear regression to benchmark the percentage and the coefficient of each population; (4) generation of APL stemness signature genes, which were PML/RARα targets highly expressed in APL stem-like cells; and (5) the APL stemness score was calculated by the mean expression level of APL stemness signature genes. b Model performance of the deconvolution approach to predict the APL stem-like cell percentage from bulk RNA-seq of the 12 patients. The performance of the model is evaluated by Pearson’s correlation coefficients between the observed APL stem-like cell percentage from scRNA-seq and the predicted APL stem-like cell percentage from the deconvolution approach. Leave-one-out (LOO) is used to evaluate the robustness of the model. The P-values were calculated using the Pearson’s correlation. Two-sided P-values were calculated.
Fig. 5
Fig. 5. Informativeness of the APL stemness score in predicting prognosis and early death in APL.
a Profiling of the predicted APL cell type percentage, clinical features, and gene mutations in the 323 APL patients. Columns represent individual APL patients, and the P-values were calculated using the Wilcoxon rank-sum test (statistical tests with two groups) or analysis of variance (ANOVA, with more than two groups) to illustrate the correlation between the APL stem-like cell percentage and clinical features/genetic alternations. Two-sided P-values were calculated. b Examination of the APL stemness score and its relationship to the prognosis of the 323 APL patients. The P-values were calculated using the Wilcoxon rank-sum test to reveal the correlation between the APL stemness score and the prognosis of the 323 APL patients. * PML/RARα isoforms mainly encompass three typical types: long (L), short (S), and variant (V) types, respectively defined by the breakpoint of PML on intron 6, intron 3, and exon 6. OS overall survival, EFS event-free survival, DFS disease-free survival. c, d Kaplan–Meier estimates of overall survival (OS) (c) and event-free survival (EFS) (d) of APL patients (n = 305 patients with prognostic information) in the entire cohort stratified by the APL stemness score. The P-values were calculated using the log-rank test. Two-sided P-values were calculated.
Fig. 6
Fig. 6. In vivo analysis revealing direct targeting of APL primitive blasts (including stem-like cells) by ATRA and induction of their differentiation and maturation.
a UMAP plot showing the integration of APL BM cells (n = 39,415 cells) collected on Day 0 (red) and Day 2 after ATRA treatment (blue). b UMAP plots showing all defined cell populations of APL BM cells (n = 39,415 cells) collected on Day 0 and Day 2 after ATRA treatment. c Comparison of the percentages of six branches before (red) and after two days of ATRA treatment (blue). d Comparison of the percentages of the stem-like, Prog-like, S100hiGMP-like, and GMP-like cells on Day 0 (red, n = 3 samples) and Day 2 after ATRA treatment (blue, n = 3 samples). The P-values were calculated using Student’s t-test. A one-sided P-value was calculated. In the boxplot, a black line within the box marks the median. The bottom and top of the box are located at the 25th and 75th percentiles, respectively. e Comparison of the Primitive-to-Mature scores of APL blasts on Day 0 (red, n = 13,966 cells) and Day 2 after ATRA treatment (blue, n = 10,852 cells). f Comparison of APL stem-like cell percentages (left panel) and stemness scores (right panel) on Day 0 (in red, n = 7 samples), Day 2 (in blue, n = 7 samples treated with ATRA alone), and Day 5 (in orange, n = 5 samples treated with ATRA + ATO). Notably, within the boxplot shown in (e and f), a black line marks the median, and the bottom and top of the box are located at the 25th and 75th percentiles, respectively. The bars represent values more than 1.5 times the interquartile range from the border of each box. The P-values were calculated using the Wilcoxon rank-sum test. Two-sided P-values were calculated. g Heatmap showing the normalized expression of stemness CD markers and TFs in APL stem-like cells, Prog-like, S100hiGMP-like, and GMP-like clusters on Day 0 (red) and Day 2 after ATRA therapy (blue). h Heatmap showing the normalized expression of differentiation markers and hematopoietic TFs in APL stem-like cells, Prog-like, S100hiGMP-like, and GMP-like clusters on Day 0 (red) and Day 2 (blue) after ATRA therapy. i Heatmap illustrating the log2(fold changes) (log2FC) of gene expression levels for stemness-associated CD markers and TFs between APL samples on Day 0 and Day 2 (Day 2 vs. Day 0) in different APL patients. j Heatmap illustrating the log2FC of gene expression levels for differentiation markers and hematopoietic TFs between APL samples on Day 0 and Day 2 (Day 2 vs. Day 0) in different APL patients. Gray represents patients alive after induction therapy, and black for patients with early death.

Similar articles

Cited by

References

    1. Giustacchini A, et al. Single-cell transcriptomics uncovers distinct molecular signatures of stem cells in chronic myeloid leukemia. Nat. Med. 2017;23:692–702. doi: 10.1038/nm.4336. - DOI - PubMed
    1. McGranahan N, Swanton C. Biological and therapeutic impact of intratumor heterogeneity in cancer evolution. Cancer Cell. 2015;27:15–26. doi: 10.1016/j.ccell.2014.12.001. - DOI - PubMed
    1. de The H, Pandolfi PP, Chen Z. Acute promyelocytic leukemia: a paradigm for oncoprotein-targeted cure. Cancer Cell. 2017;32:552–560. doi: 10.1016/j.ccell.2017.10.002. - DOI - PubMed
    1. Brown D, et al. A PMLRARalpha transgene initiates murine acute promyelocytic leukemia. Proc. Natl Acad. Sci. USA. 1997;94:2551–2556. doi: 10.1073/pnas.94.6.2551. - DOI - PMC - PubMed
    1. He LZ, et al. Acute leukemia with promyelocytic features in PML/RARalpha transgenic mice. Proc. Natl Acad. Sci. USA. 1997;94:5302–5307. doi: 10.1073/pnas.94.10.5302. - DOI - PMC - PubMed

MeSH terms