. 2024 Feb 16;15(1):1449.
doi: 10.1038/s41467-024-45638-9.

Duplicated antibiotic resistance genes reveal ongoing selection and horizontal gene transfer in bacteria

Affiliations

Duplicated antibiotic resistance genes reveal ongoing selection and horizontal gene transfer in bacteria

Rohan Maddamsetti et al. Nat Commun. .

Abstract

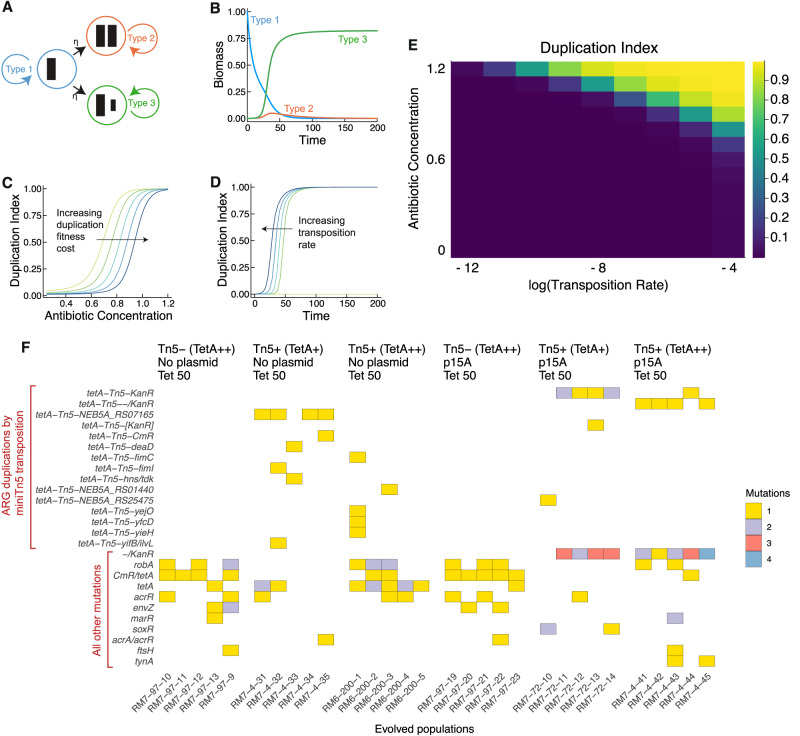
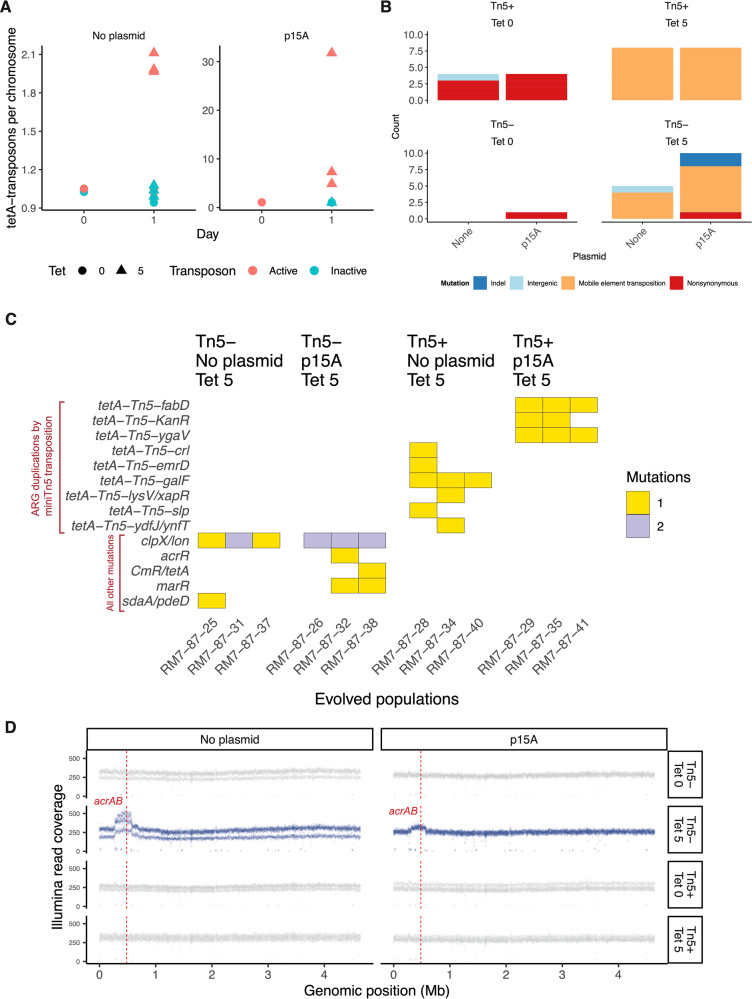
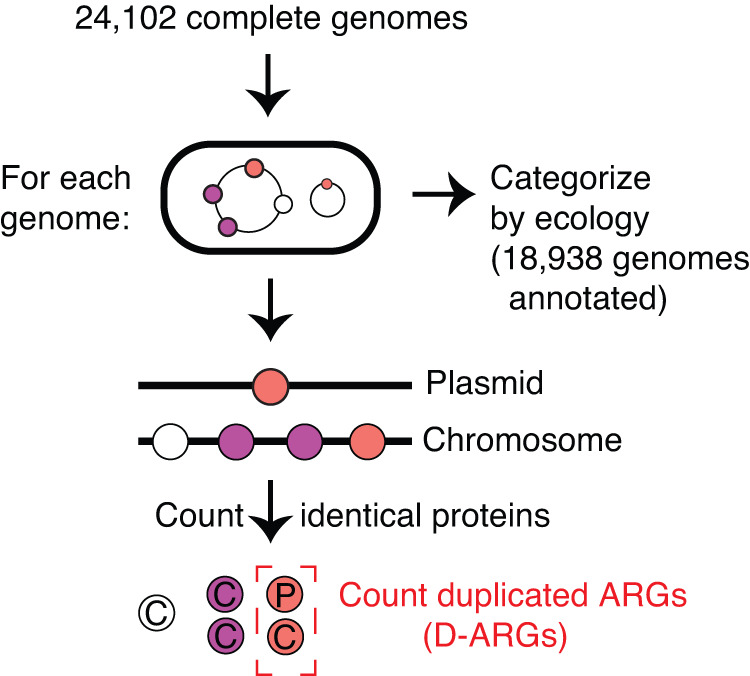
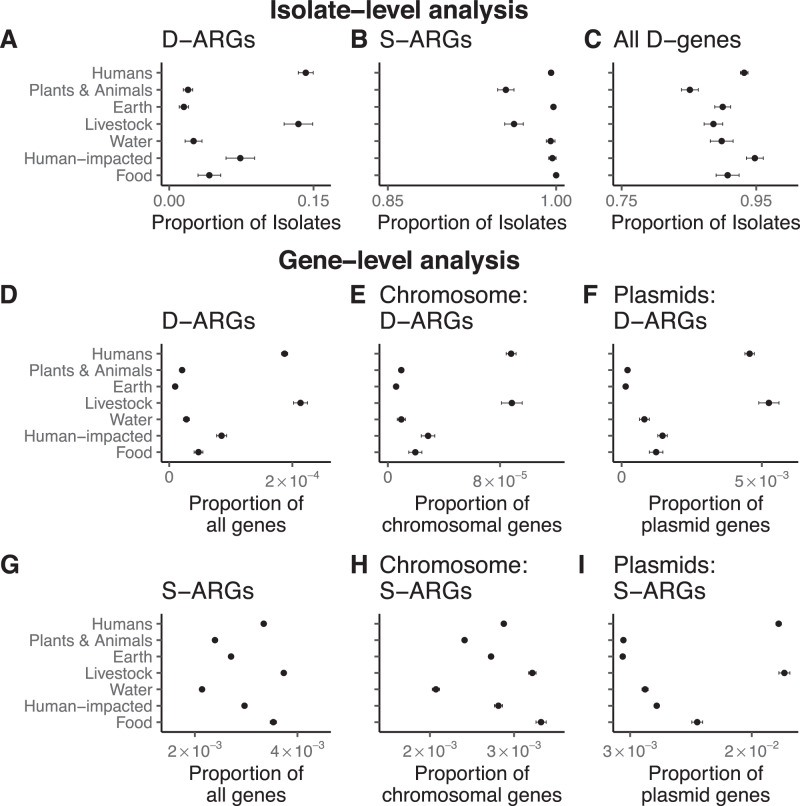
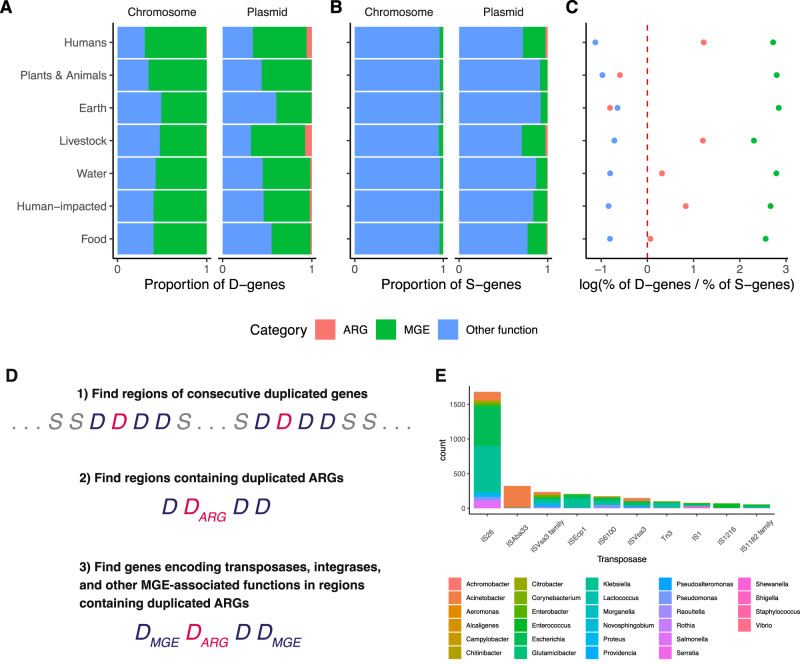
Horizontal gene transfer (HGT) and gene duplication are often considered as separate mechanisms driving the evolution of new functions. However, the mobile genetic elements (MGEs) implicated in HGT can copy themselves, so positive selection on MGEs could drive gene duplications. Here, we use a combination of modeling and experimental evolution to examine this hypothesis and use long-read genome sequences of tens of thousands of bacterial isolates to examine its generality in nature. Modeling and experiments show that antibiotic selection can drive the evolution of duplicated antibiotic resistance genes (ARGs) through MGE transposition. A key implication is that duplicated ARGs should be enriched in environments associated with antibiotic use. To test this, we examined the distribution of duplicated ARGs in 18,938 complete bacterial genomes with ecological metadata. Duplicated ARGs are highly enriched in bacteria isolated from humans and livestock. Duplicated ARGs are further enriched in an independent set of 321 antibiotic-resistant clinical isolates. Our findings indicate that duplicated genes often encode functions undergoing positive selection and horizontal gene transfer in microbial communities.


Conflict of interest statement

The authors declare no competing interests.

Figures

Fig. 1
Fig. 1. Mathematical modeling and laboratory evolution with E. coli K-12 DH5α demonstrate that antibiotic selection is sufficient to drive the rapid evolution of antibiotic resistance through the duplication of antibiotic resistance genes.
Source data are provided in the Source Data File. A State diagram for the mathematical model. The three states represent cells with an ARG on the chromosome (Type 1), cells with an additional ARG on the chromosome due to duplication, including transposition-based mechanisms (Type 2), and cells with an ARG on the chromosome and an ARG on its plasmid due to transposition (Type 3). B Under sufficiently strong antibiotic selection and with low cost of expression, cells with ARGs on the plasmid dominate the population. The simulation result in this panel uses the following parameter settings (arbitrary units): Antibiotic Concentration A = 2.0, Duplication Cost c = 0.1, Transposition Rate η = 0.0002, Dilution Rate D = 0.1, Plasmid copy number y = 2 (Methods: Mathematical model). Under these conditions, the fitnesses of the three subpopulations are ordered f1<f2<f3. C Cells containing D-ARGs dominate population dynamics at sufficiently high antibiotic concentrations, even if the cost of maintaining the D-ARG varies. Duplication Index is defined as the fraction of cells containing D-ARGs. The simulation result in this panel uses the following parameter settings (arbitrary units): A = 2.0, η = 0.0002, D = 0.1, y = 2. Colors shift from yellow to blue as the fitness cost of carrying duplicated ARGs increases. The yellow curve represents Duplication Cost c = 0.05, and each successively darker curve represents an increment of 0.05, up to the darkest curve of c = 0.25. See Supplementary Data 1 for further details. D Increasing the transposition rate reduces the delay until strains with duplicated ARGs take over the population. The simulation result in this panel uses the following parameter settings (arbitrary units): A = 2.0, c = 0.1, D = 0.1, y = 2. Colors shift from yellow to blue as the transposition rate η increases. η is varied on a log-scale from 0, 2 × 10−6, 2 × 10−5, 2 × 10−4. E Duplicated ARGs establish in the population when both the transposition rate and antibiotic concentration are sufficiently high. As above, Duplication Index is defined as the fraction of cells containing D-ARGs. The simulation result in this panel uses the following parameter settings (arbitrary units): c = 0.1, D = 0.1, y = 2. Antibiotic concentration A is varied from 0.0 to 1.2 in increments of 0.1, and transposition rate η is varied on a log10-scale from 10−12 to 10−4. F Genome sequencing reveals targets of positive selection after 9 days of growth with increasing tetracycline concentrations up to 50 μg/mL tetracycline. Rows indicate genetic loci, and columns indicate replicate evolved populations. The color of each entry of the matrix represents the number of distinct mutations found at that locus in the population: yellow for one mutation, purple for two, red for three, and blue for four. Mutations involving the tetA-Tn5 mini-transposon have a tetA-Tn5- prefix.
Fig. 2
Fig. 2. Laboratory evolution with E. coli K-12 MG1655 demonstrate that antibiotic selection is sufficient to drive the rapid evolution of antibiotic resistance through the duplication of antibiotic resistance genes.
12 replicate populations were evolved for one day under tetracycline selection, and another 12 replicate populations were evolved in LB without antibiotic as a control. Each panel shows a result generated by whole-population Illumina sequencing of these evolved populations. See Supplementary Fig. 1 for the results of additional experiments showing generality across antibiotic resistance genes. Source data are provided in the Source Data File. A One day of tetracycline selection was sufficient to drive an increase in ARG copy number. No change in tetA copy number occurred in the no tetracycline control treatment, or when the transposase was not present. B Antibiotic selection enriches for mobile element transpositions, even when the Tn5 transposase is not present. Parallel native mobile element insertions into the promoter of the lon gene encoding the Lon protease, which regulates native efflux pump expression, is the cause (see C). C Genome sequencing reveals targets of positive selection after 1 day of growth under a treatment of 5 μg/mL tetracycline. Multiple transpositions of the tetA-Tn5 mini-transposon to both chromosome and plasmid are observed in the presence of active transposase. In the absence of active transposase, we see parallel mobile element insertions into the promoter of lon, as well as mutations affecting the native efflux pump regulatory genes marR and acrR. D After 1 day of growth under 5 μg/mL tetracycline, all six of the populations that lack active transposase (shown in blue) show chromosomal amplifications around the location of the native antibiotic resistance efflux pump acrAB in the K12 MG1655 NC_000913 reference genome. Populations with Tn5 transposase, or that were not treated with antibiotic, lack these amplifications.
Fig. 3
Fig. 3. Bioinformatic analysis workflow.
Genes, represented as colored “beads on a string”, are grouped together based on 100% protein sequence identity. The location of identical proteins (plasmid, chromosome, or unassembled contig sequence) is recorded, along with the number of copies in those locations. Multiple identical protein sequences in a genome are called “duplicated”, while unique protein sequences are called “single-copy”. Antibiotic resistance genes were scored based on NCBI RefSeq protein product annotation. Each genome is categorized into one of twelve ecological categories, or as “Unannotated”, based on the host and isolation source metadata in its NCBI RefSeq record.
Fig. 4
Fig. 4. Bacteria isolated from humans and livestock are much more likely to have duplicated antibiotic resistance genes (D-ARGs) compared to bacteria isolated from other environments; furthermore, D-ARGs are enriched on the chromosomes and plasmids of bacteria isolated from humans and livestock.
Error bars are 95% binomial proportion confidence intervals, calculated using the formula p±Zα/2(p1pn), where p is the proportion, n is the sample size, and Zα/2 = 1.96. The measure of center for the error bars is the proportion p that is relevant for a given figure panel. Numerical reporting, including sample sizes, are listed in Supplementary Tables 1, 2, 3, 4, 5. Source Data are also provided in the Source Data File. A D-ARGs are specifically enriched in bacterial isolates from humans and livestock. See Supplementary Table 1 for numerical reporting. B The vast majority of isolates contain at least one single-copy antibiotic resistance gene (S-ARG). See Supplementary Table 2 for numerical reporting. C The vast majority of isolates contain at least one duplicated gene (D-gene). See Supplementary Table 3 for numerical reporting. D D-ARGs represent a higher fraction of genes found in bacteria isolated from humans and livestock compared to bacteria in the other ecological categories. See Supplementary Tables 4 and 5 for numerical reporting. E Chromosomal D-ARGs are enriched in bacteria isolated from humans and livestock. See Supplementary Tables 4 and 5 for numerical reporting. F Plasmid D-ARGs are enriched in bacteria isolated from humans and livestock. See Supplementary Tables 4 and 5 for numerical reporting. G S-ARGs represent a higher fraction of genes found in bacteria isolated from humans and livestock compared to the other ecological categories. See Supplementary Tables 4 and 5 for numerical reporting. H Chromosomal S-ARGs are enriched in humans and livestock. See Supplementary Tables 4 and 5 for numerical reporting. I Plasmid S-ARGs are enriched in bacteria isolated from humans and livestock. See Supplementary Tables 4 and 5 for numerical reporting.
Fig. 5
Fig. 5. Selection, horizontal gene transfer, and mobile genetic elements shape the ecological distribution of duplicated genes.
Proteins associated with mobile genetic elements (MGEs) are shown in green; proteins encoded by antibiotic resistance genes (ARGs) are in red; and all other proteins are shown in blue. Source data are provided in the Source Data File. A Across all ecological categories, ~50% duplicated genes (D-genes) on chromosomes and plasmids are associated with MGEs. B MGE-associated proteins account for <10% of single-copy genes (S-genes) on chromosomes, and 5−25% of S-genes on plasmids. C Duplicated ARGs (D-ARGs) are enriched in humans and livestock, and are depleted in most other categories, while duplicated genes associated with mobile genetic element functions are enriched in all ecological categories. The red dashed line indicates the null hypothesis. D Workflow for finding duplicated transposases that are linked with duplicated ARGs. E The ten most frequent transposases associated with ARGs in regions of consecutive duplicated genes. See Supplementary Fig. S14 for the full distribution.

Similar articles

Cited by

References

    1. Näsvall J, Sun L, Roth JR, Andersson DI. Real-time evolution of new genes by innovation, amplification, and divergence. Science. 2012;338:384–387. doi: 10.1126/science.1226521. - DOI - PMC - PubMed
    1. Reams AB, Roth JR. Mechanisms of gene duplication and amplification. Cold Spring Harb. Perspect. Biol. 2015;7:a016592. doi: 10.1101/cshperspect.a016592. - DOI - PMC - PubMed
    1. Tyo KE, Ajikumar PK, Stephanopoulos G. Stabilized gene duplication enables long-term selection-free heterologous pathway expression. Nat. Biotechnol. 2009;27:760–765. doi: 10.1038/nbt.1555. - DOI - PubMed
    1. Tomanek I, et al. Gene amplification as a form of population-level gene expression regulation. Nat. Ecol. Evol. 2020;4:612–625. doi: 10.1038/s41559-020-1132-7. - DOI - PubMed
    1. Yao Y, et al. Intra-and interpopulation transposition of mobile genetic elements driven by antibiotic selection. Nat. Ecol. Evol. 2022;6:555–564. doi: 10.1038/s41559-022-01705-2. - DOI - PubMed

MeSH terms

Substances