. 2024 Jun;16(6):945-958.
doi: 10.1038/s41557-024-01458-4. Epub 2024 Feb 16.

A divergent intermediate strategy yields biologically diverse pseudo-natural products

Affiliations

A divergent intermediate strategy yields biologically diverse pseudo-natural products

Sukdev Bag et al. Nat Chem. 2024 Jun.

Abstract

The efficient exploration of biologically relevant chemical space is essential for the discovery of bioactive compounds. A molecular design principle that possesses both biological relevance and structural diversity may more efficiently lead to compound collections that are enriched in diverse bioactivities. Here the diverse pseudo-natural product (PNP) strategy, which combines the biological relevance of the PNP concept with synthetic diversification strategies from diversity-oriented synthesis, is reported. A diverse PNP collection was synthesized from a common divergent intermediate through developed indole dearomatization methodologies to afford three-dimensional molecular frameworks that could be further diversified via intramolecular coupling and/or carbon monoxide insertion. In total, 154 PNPs were synthesized representing eight different classes. Cheminformatic analyses showed that the PNPs are structurally diverse between classes. Biological investigations revealed the extent of diverse bioactivity enrichment of the collection in which four inhibitors of Hedgehog signalling, DNA synthesis, de novo pyrimidine biosynthesis and tubulin polymerization were identified from four different PNP classes.


Conflict of interest statement

The authors declare no competing interests.

Figures
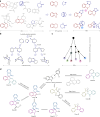
Fig. 1
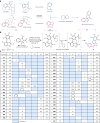
Fig. 1. General depiction of the PNP and DOS concepts.
a, PNP logic: the combination of NP fragments in unprecedented arrangements. b, DOS logic: scaffold diversity using a build–couple–pair strategy from available starting materials. c, Merging the two concepts of PNPs and DOS, generation of dPNPs. d, An overview of dPNP compound class syntheses from common indole-based starting materials.
Fig. 2
Fig. 2. Design, fragment combination and synthesis of spiroindolylindanone PNPs.
a, Indolenine and indanone fragment combination to construct spiroindolylindanone PNPs. b, Method development and optimization of a CO insertion reaction to construct spiroindolylindanone PNPs using N-formyl saccharin (2a) as a non-toxic bench-stable solid and inexpensive CO surrogate. c, Substrate scope for the spiroindolylindanone synthesis. aThe PNPs in this manuscript are identified by the letter of the compound class followed by the compound number within the compound class, that is, A1 is class A, compound 1. bIsolated yields are shown.
Fig. 3
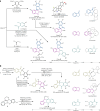
Fig. 3. Synthetic routes to classes BH.
a, Access to classes BH from class A. The relative configuration of B10 was determined by X-ray crystallography (Supplementary Information), and the structures of other products (including class C) were drawn by analogy. Diastereomeric ratios of class B were determined by 1H nuclear magnetic resonance. For individual diastereomeric ratios, see Supplementary Information. b, Synthesis of classes F, G and H from 1 and 5, respectively, utilizing the NH of indole derivatives. Isolated yields are shown. Parent NP examples and the corresponding NP fragments from which the PNPs are derived are shown on the right side of the figures. RT, room temperature; CFL, compact fluorescent lamp; fan, 3 W cooling fan.
Fig. 4
Fig. 4. Cheminformatic analyses of the diverse PNP collection.
a, A PMI plot for the shape of the PNPs (black circles). The corners of the triangle within the plot indicate a rod-like shape (top left), disk-like shape (bottom middle) and sphere-like shape (top right). The contour lines represent a Gaussian kernel density estimation with ten steps. For a PMI plot with individual PNP subclasses, see Supplementary Fig. 3. b, NP-likeness scores of the PNPs (black curve) compared with the DrugBank compound collection (orange curve), ChEMBL NPs (green curve) and Enamine building blocks (blue curve). c, QED of the PNPs (black curve) compared with the DrugBank compound collection (orange curve), ChEMBL NPs (green curve) and Enamine building blocks (blue curve). d, Box plot of intra- and interclass Tanimoto similarity calculations of Morgan fingerprints (ECFC4) following Tukey’s definitions with outliers. Centre line, median; box limits, upper and lower quartiles; whiskers, 1.5× interquartile range; and points, outliers. The dashed line indicates the 95th percentile median (0.23) of random reference compound subsets. For full cross-similarity values, see Supplementary Figs. 9–10. e, Box plot of intra- and interclass Tanimoto similarity calculations of Morgan fingerprints (ECFP6) following Tukey’s definitions with outliers. Centre line, median; box limits, upper and lower quartiles; whiskers, 1.5× interquartile range; and points, outliers. The dashed line indicates the 95th percentile median (0.17) of random reference compound subsets. For full cross-similarity values, see Supplementary Figs. 11 and 12. The number of compounds in reference sets is 527,411 (50,000 random compounds were selected for PMI analysis) for Enamine, 4,866 for DrugBank and 45,679 for ChEMBL NPs.
Fig. 5
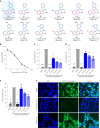
Fig. 5. Biological investigation of PNP A23 for Hh signalling inhibition.
a, Selected compounds with structural variation to the most active compound (A23) in an osteoblast differentiation assay. Cell viability was assessed using a CellTiter-Glo Luminescent Cell Viability Assay and treating C3H10T1/2 cells with compound (30 µM) in the absence of purmorphamine for 96 h. The viability of cells treated with DMSO was set to 100%. IC50, half-maximal inhibitory concentration. b, C3H10T1/2 cells were treated for 96 h with 1.5 µM purmorphamine, DMSO as a control or compound A23. The activity of alkaline phosphatase was measured to determine Hh pathway activity. Values for cells treated with purmorphamine and DMSO were set to 100%. The data are the mean values ± s.d. of three biological replicates (n = 3). c, Alpl gene expression; C3H10T1/2 cells were incubated for 96 h with 1.5 µM purmorphamine and DMSO, 1 µM vismodegib (vismo) or 1, 5 or 10 µM of A23 before RT–qPCR. Data are mean values ± s.d. of three biological replicates (n = 3). The P values relative to cells treated with DMSO and purmorphamine are <0.0001 for DMSO-treated, <0.0001 for vismo (1 µM)-treated, 0.0014 for A23 (1 µM)-treated, 0.0005 for A23 (5 µM)-treated and 0.0006 for A23 (10 µM)-treated cells. d,e, Expression of the Hh target gene Gli1 (d) and Ptch1 (e). C3H10T1/2 cells were incubated with 1.5 µM of purmorphamine and DMSO, 1 µM vismo or A23 (1 µM, 5 µM or 10 µM) for 96 h before RT–qPCR. Data are mean values ± s.d. of three biological replicates (n = 3). For Hh target gene Gli1, the P values relative to cells treated with DMSO and purmorphamine are 0.0001 for DMSO-treated, 0.0003 for vismo (1 µM)-treated, 0.0477 for A23 (1 µM)-treated, 0.0052 for A23 (5 µM)-treated and 0.0203 for A23 (10 µM)-treated cells. For Hh target gene Ptch1, the P values relative to cells treated with DMSO and purmorphamine are 0.0010 for DMSO-treated, 0.0024 for vismo (1 µM)-treated, 0.4559 for A23 (1 µM)-treated, 0.0111 for A23 (5 µM)-treated and 0.0142 for A23 (10 µM)-treated cells. f, SMO binding assay. HEK293T cells were transfected with a SMO-expressing plasmid. After 48 h, the cells were fixed and incubated with BODIPY–cyclopamine (green, 5 nM) and treated with either DMSO, vismo or A23 for 4 h. The nuclei were visualized by staining the cells with 4,6-diamidino-2-phenylindole (DAPI) (blue). The images are representative of three biological replicates (n = 3). Scale bar, 30 µm. For ce, statistical analyses were performed relative to DMSO/purmorphamine by employing unpaired two-tailed t-tests with Welch’s correction (*P < 0.05, **P < 0.01, ***P < 0.001, ****P < 0.0001; NS, not significant).
Fig. 6
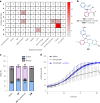
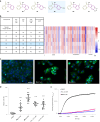
Fig. 6. CPA subprofile analysis of the dPNP collection and bioactivity validation of C3 and E13.
a, A heat map showing the percentage of PNPs in each class that have >85% similarity to a bioactivity cluster profile and induction values >15%. The PNPs were measured at various concentrations (≤50 µM), generating several profiles for each PNP. For each PNP, the profile with the highest similarity to a bioactivity cluster was selected for this analysis. L/CH, lysosomotropism/cholesterol homeostasis. For heat maps of bioactivity cluster similarities of individual profiles of hit compounds, see Supplementary Figs. 15 and 16. b, The chemical structure of C3, C3-resynthesized, C18 and E13. c, The influence of C3, C3-resynthesized and C18 on DNA content and the cell cycle. U2OS cells were treated with DMSO or compound (30 µM) for 22 h followed by the addition of 10 µM EdU and incubated for an additional 2 h. DNA-incorporated EdU was labelled with Alexa Fluor 488 via click reaction and DNA was stained with propidium iodide. Single-cell analysis via flow cytometry measuring EdU incorporation and total DNA content was used to determine the percentage of cells in either G1 (2N), S (2N–4N) or G2 (4N) phase. Data are mean values ± s.d. (n = 10,000 cells examined over three biologically independent samples). Histograms of the FACS analysis can be found in Supplementary Fig. 19. d, Uridine rescue assay. HCT116 cells were treated with either DMSO (control), E13 or E13 in the presence of uridine (100 µM). Cell confluence was used as a measure of cell proliferation and was monitored over a 96 h period using an IncuCyte ZOOM/S3. Data are mean values ± s.d. of four independent replicates (n = 4).
Fig. 7
Fig. 7. Validation of F5 as a tubulin-targeting compound.
a, Structures of the six class F compounds that have >85% similarity to the tubulin cluster profile. b, Tubulin cluster profile relative to class F compounds that have >85% similarity to the tubulin cluster profile. The selected profiles are those that have >85% similarity to the tubulin cluster profile and >20% induction at the lowest concentrations per compound. The reference profile is the first profile (100% biosimilarity) for which all subsequent profiles are compared. The tubulin profile has 424 features and is divided into three segments: cell, cytoplasm and nuclei. Biosim, biosimilarity to the tubulin cluster profile; ind, induction (percentage of significantly changed features relative to DMSO controls); and conc, concentration. The induction value reported is relative to the full CPA profiles with 579 features. c, Influence on the microtubule network. U2OS cells were treated for 24 h with DMSO (control) or F5 before staining for tubulin (green) and DNA (blue). Scale bar, 50 µm. d, Quantification of mitotic cells via immunocytochemistry. U2OS cells were treated with DMSO (negative control), F5, nocodazole (noc, positive control) or colchicine (col, positive control) for 24 h before staining of cells for phospho-histone H3 and DNA. Cells in mitosis were quantified as the percentage of phospho-histone H3-positive cells. Data are mean values ± s.d. of three independent replicates (n = 3). Statistical analyses were performed relative to the DMSO control by employing unpaired two-tailed t-tests (****P < 0.0001). The P values relative to cells treated with DMSO are <0.0001 for F5 (10 µM)-treated, <0.0001 for F5 (30 µM)-treated, <0.0001 for noc-treated and <0.0001 for col-treated cells. e, In vitro tubulin polymerization assay. The polymerization was initiated upon addition of guanosine triphosphate (GTP) to porcine tubulin and quantified by means of turbidity measurement at 340 nm and 37 °C. DMSO was used as a negative control and noc was used as a positive control for tubulin destabilization. Data are representative of three independent experiments (n = 3).

References

    1. Dobson CM. Chemical space and biology. Nature. 2004;432:824–828. doi: 10.1038/nature03192. - DOI - PubMed
    1. Grygorenko OO, Volochnyuk DM, Ryabukhin SV, Judd DB. The symbiotic relationship between drug discovery and organic chemistry. Chem. Eur. J. 2020;26:1196–1237. doi: 10.1002/chem.201903232. - DOI - PubMed
    1. Newman DJ, Cragg GM. Natural products as sources of new drugs over the nearly four decades from 01/1981 to 09/2019. J. Nat. Prod. 2020;83:770–803. doi: 10.1021/acs.jnatprod.9b01285. - DOI - PubMed
    1. Wender PA, Verma VA, Paxton TJ, Pillow TH. Function-oriented synthesis, step economy, and drug design. Acc. Chem. Res. 2008;41:40–49. doi: 10.1021/ar700155p. - DOI - PubMed
    1. Micalizio GC, Hale SB. Reaction design, discovery, and development as a foundation to function-oriented synthesis. Acc. Chem. Res. 2015;48:663–673. doi: 10.1021/ar500408e. - DOI - PMC - PubMed

Publication types

MeSH terms