Clinical Trial
. 2024 Mar;30(3):896-904.
doi: 10.1038/s41591-024-02829-7. Epub 2024 Feb 16.

A first-in-class leucyl-tRNA synthetase inhibitor, ganfeborole, for rifampicin-susceptible tuberculosis: a phase 2a open-label, randomized trial

Affiliations
Clinical Trial

A first-in-class leucyl-tRNA synthetase inhibitor, ganfeborole, for rifampicin-susceptible tuberculosis: a phase 2a open-label, randomized trial

Andreas H Diacon et al. Nat Med. 2024 Mar.

Abstract

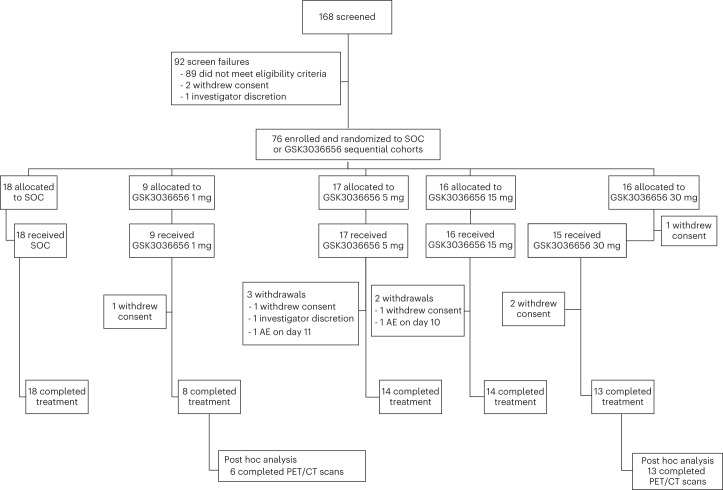
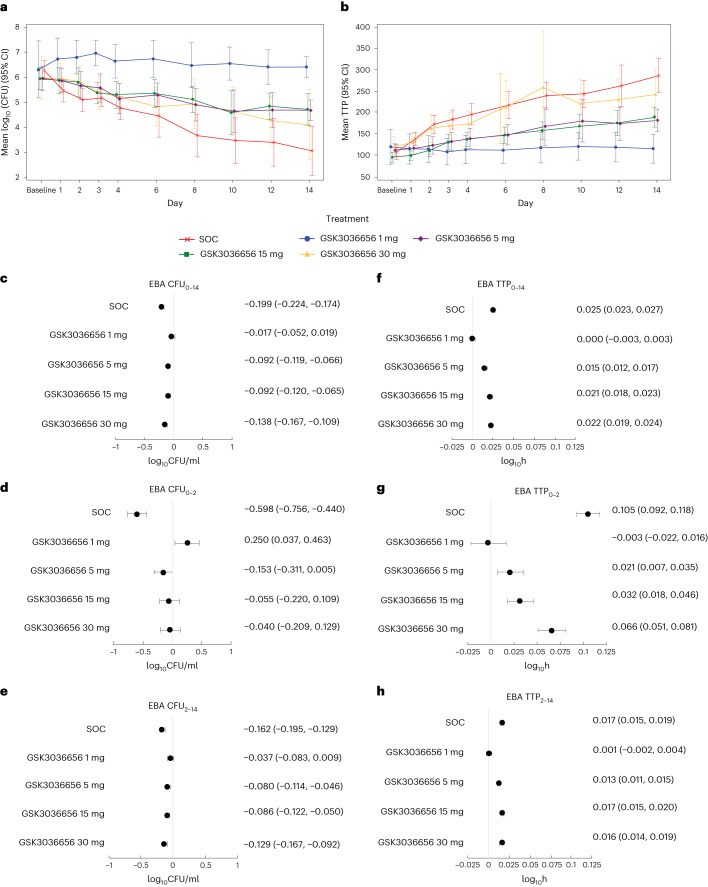
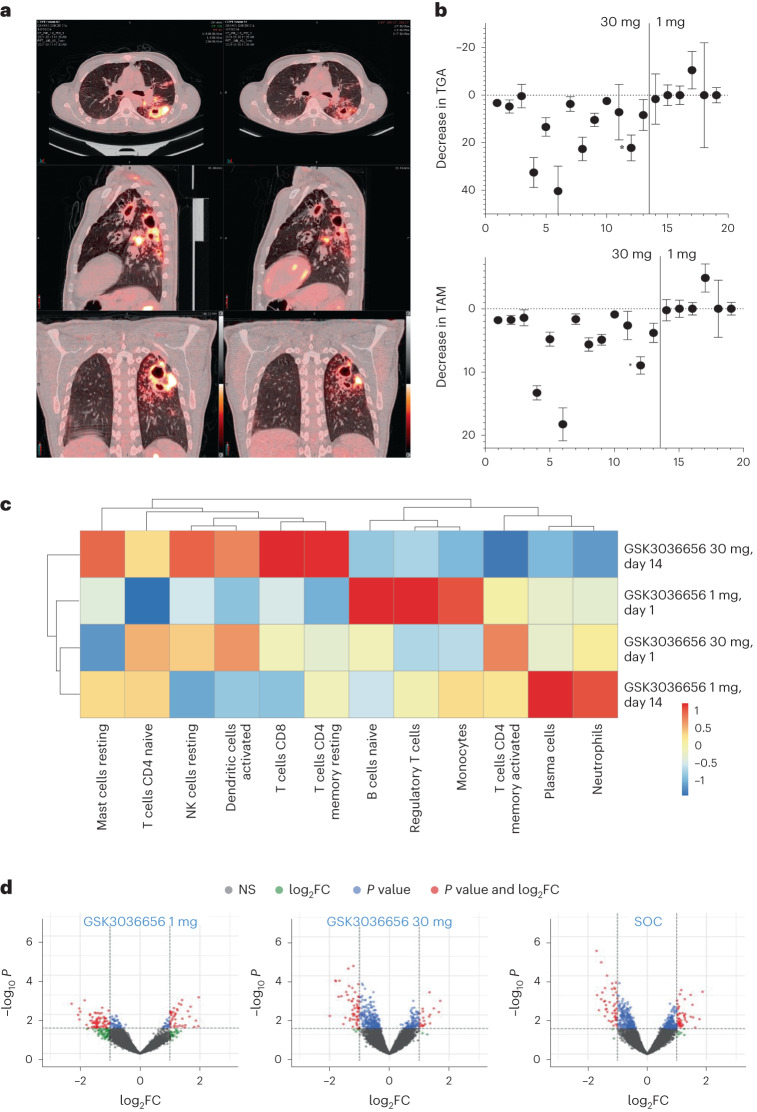
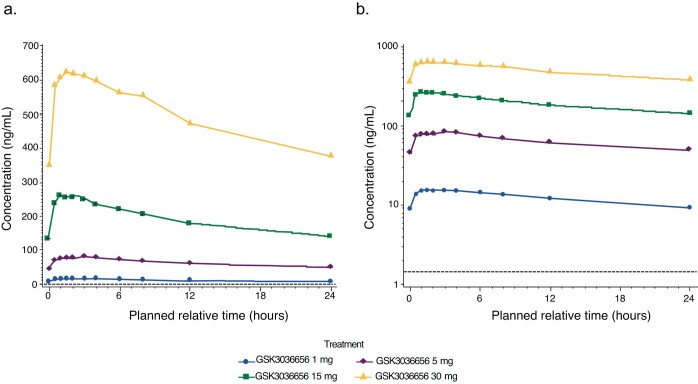
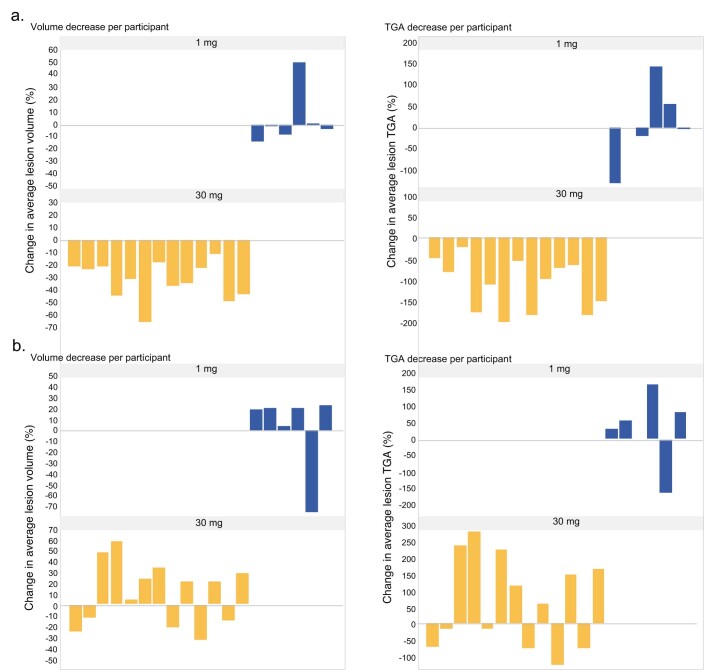
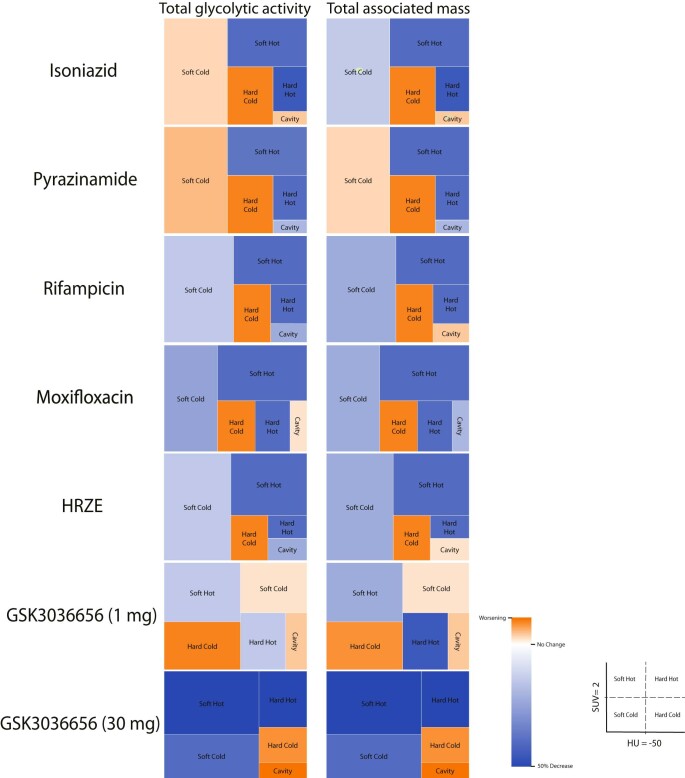
New tuberculosis treatments are needed to address drug resistance, lengthy treatment duration and adverse reactions of available agents. GSK3036656 (ganfeborole) is a first-in-class benzoxaborole inhibiting the Mycobacterium tuberculosis leucyl-tRNA synthetase. Here, in this phase 2a, single-center, open-label, randomized trial, we assessed early bactericidal activity (primary objective) and safety and pharmacokinetics (secondary objectives) of ganfeborole in participants with untreated, rifampicin-susceptible pulmonary tuberculosis. Overall, 75 males were treated with ganfeborole (1/5/15/30 mg) or standard of care (Rifafour e-275 or generic alternative) once daily for 14 days. We observed numerical reductions in daily sputum-derived colony-forming units from baseline in participants receiving 5, 15 and 30 mg once daily but not those receiving 1 mg ganfeborole. Adverse event rates were comparable across groups; all events were grade 1 or 2. In a participant subset, post hoc exploratory computational analysis of 18F-fluorodeoxyglucose positron emission tomography/computed tomography findings showed measurable treatment responses across several lesion types in those receiving ganfeborole 30 mg at day 14. Analysis of whole-blood transcriptional treatment response to ganfeborole 30 mg at day 14 revealed a strong association with neutrophil-dominated transcriptional modules. The demonstrated bactericidal activity and acceptable safety profile suggest that ganfeborole is a potential candidate for combination treatment of pulmonary tuberculosis.ClinicalTrials.gov identifier: NCT03557281 .


Conflict of interest statement

A.C., R.S., G.M.-E., S.T. and M.D. are employees of, and shareholders in, GSK. D.B.A. is an employee of, and shareholder in, GSK, and reports patents planned, issued or pending. S.L.P., G.V. and K.F. are employees of GSK and hold stocks in GSK and Haleon. G.C.K.W.K. is a shareholder in GSK, reports conference fees, expenses and accommodation support from GSK while an employee, and is currently employed by Generate:Biomedicines, Boston, MA, USA. C.L. is supported by the German Center of Infection Research, has provided consultation service to INSMED, has received honoraria for lecturing from INSMED, GILEAD, GSK, MedUpdate and MedUpdateEurope outside of this work, and is a member of the Data Safety Board of trials from Medicines sans Frontiers. C.M.U. received EDCTP grant funding. J.H. received speaker honoraria from GSK and Chiesi, has received support from Boehringer Ingelheim for attending meetings and/or travel, and reports patents planned, issues or pending. A.H.D., I.K., C.E.B., M.R., R.Y.C. and V.d.J. report no conflict of interest.

Figures

Fig. 1
Fig. 1. Participant disposition.
CONSORT diagram of study enrollment, allocation to groups, treatment and treatment withdrawals. This study utilized a sequential dose cohort design. AE, adverse event; PET/CT, positron emission tomography/computed tomography; SOC, standard of care.
Fig. 2
Fig. 2. EBA over time during the study and rate of change per day in EBA over the periods baseline to day 14, baseline to day 2, and day 2 to day 14 (mixed model repeated measures analysis).
a, log10CFU over time for the different treatment groups. b, TTP (in h) over time for the different treatment groups. Data are mean estimate (95% CI). Efficacy population (SOC, N = 18; GSK3036656 (ganfeborole) 1 mg, N = 9; GSK3036656 (ganfeborole) 5 mg, N = 17; GSK3036656 (ganfeborole) 15 mg, N = 16; GSK3036656 (ganfeborole) 30 mg, N = 15). c, EBA CFU0–14. d, EBA CFU0–2. e, EBA CFU2–14. f, EBA TTP0–14. g, EBA TTP0–2. h, EBA TTP2–14. Data are mean estimate (95% CI). Efficacy population (SOC, N = 18; GSK3036656 (ganfeborole) 1 mg, N = 9; GSK3036656 (ganfeborole) 5 mg, N = 17; GSK3036656 (ganfeborole) 15 mg, N = 16; GSK3036656 (ganfeborole) 30 mg, N = 15). EBA CFU0–14, EBA CFU0–2 and EBA CFU2–14, log10CFU/ml sputum samples over the periods baseline to day 14, baseline to day 2, and day 2 to day 14, respectively. EBA TTP0–14, EBA TTP0–2 and EBA TTP2–14, TTP over the periods baseline to day 14, baseline to day 2, and day 2 to day 14, respectively. CFU, colony-forming units; CI, confidence interval; EBA, early bactericidal activity; SOC, standard of care; TTP, time to culture sputum positivity.
Fig. 3
Fig. 3. Post hoc exploratory analyses: 18F-FDG-PET/CT scans and transcriptional profiling.
a, Representative 18F-FDG-PET/CT scan of a participant receiving GSK3036656 (ganfeborole) 30 mg at baseline (left column) and after 14 days of treatment (right column). Both scans are shown at a maximum scale of SUV 7. The axial slices shown at the top indicate the rapid response of a peri-cavitary lesion in the left inferior lobe, the sagittal slices shown in the middle indicate the response in cavities located in the superior and inferior lobes, and the coronal slices shown at the bottom indicate the response in and around the largest cavitary feature in this participant. b, Top: changes in TGA for each participant, computed from the sum of the body weight-adjusted SUV values per voxel, at day 14 versus baseline for those receiving GSK3036656 (ganfeborole) 30 mg (left) and GSK3036656 (ganfeborole) 1 mg (right). Bottom: changes in TAM, computed from the individual HU value per voxel + 1,000 to adjust for negative air values in the same participants. Data marked with an asterisk are from the participant illustrated in a. N by subject from left to right in the graph: N = 4,470, N = 4,824, N = 3,310, N = 4,916, N = 6,120, N = 755, N = 3,922, N = 1,459, N = 2,205, N = 2,826, N = 2,272, N = 1,626, N = 1,440, N = 2,531, N = 3,039, N = 7,701, N = 921, N = 944 and N = 3,971. Data are presented as mean values (± standard error of the mean). c, Heatmap of CIBERSORT gene expression profiles to estimate frequencies of each cell type. Mean values between participants in two groups: (1) those receiving GSK3036656 (ganfeborole) 1 mg; and (2) those receiving GSK3036656 (ganfeborole) 30 mg. d, Differential gene regulation at day 14 versus baseline for participants receiving GSK3036656 (ganfeborole) 1 mg (n = 7), GSK3036656 (ganfeborole) 30 mg (n = 13) and SOC (n = 13). Green indicates high log FC, but not significant, blue indicates significant but relatively low log FC, red indicates significant and high log FC, and gray indicates not significant, low log FC. 18F-FDG-PET/CT, 18F-fluorodeoxyglucose positron emission tomography/computed tomography; CD, cluster of differentiation; FC, fold change; HU, Hounsfield units; NK, natural killer; NS, not significant; SOC, standard of care; SUV, standardized uptake value; TAM, total associated mass; TGA, total glycolytic activity.
Extended Data Fig. 1
Extended Data Fig. 1. Mean GSK3036656 (ganfeborole) plasma concentration–time plots at Day 14. a, linear and b, semi-logarithmic scale.
Pharmacokinetics population. (GSK3036656 (ganfeborole) 1 mg, N = 9; GSK3036656 (ganfeborole) 5 mg, N = 17; GSK3036656 (ganfeborole) 15 mg, N = 15; GSK3036656 (ganfeborole) 30 mg, N = 15).
Extended Data Fig. 2
Extended Data Fig. 2. Impact of GSK3036656 (ganfeborole) by lesion density per participant. a, Response in cubes containing <20% voxels corresponding to air (N = 55,682). b, Response in cubes containing >20% voxels corresponding to air (cavity walls) (N = 3570).
The GSK3036656 (ganfeborole) 1 mg group (N = 6) is depicted at the top of the graphs (blue) and the 30 mg group (N = 13) at the bottom (yellow); each bar represents one participant (participants 1–19); bars below 0 indicate positive change in average lesion volume or lesion TGA. TGA, total glycolytic activity.
Extended Data Fig. 3
Extended Data Fig. 3. PET/CT scan summary response measures by lesion feature.
Changes in TAM, computed from the individual HU value per voxel +1000 to scale adjust for negative air values, and total glycolytic activity, computed from the sum of the body weight-adjusted SUV values per voxel, at Day 14 versus baseline for first-line TB drugs, moxifloxacin (recomputed from Xie, et al. to adjust to the same voxel size) and GSK3036656 (ganfeborole) 1 mg and 30 mg. Lesion cubes were divided based on baseline features into five categories based on the indicated HU and SUV thresholds as well as the presence of more than 10% voxels corresponding to −1000 HU (indicating air), which represent the walls of cavities. Lesion features were ‘hard’ (>−50 HU) and ‘soft’ <−50 HU with a SUVmean >2 and were grouped by baseline PET values < or >2 as ‘hot’ and ‘cold’; cubes that contained >10% air were considered ‘cavities’. The size of the block represents the total volume of disease with those characteristics across all of the participants receiving that particular treatment. HRZE, rifampicin, isoniazid, pyrazinamide and ethambutol; HU, Hounsfield units; PET/CT, positron emission tomography/computed tomography; SUV, standardized uptake value; TAM, total associated mass; TB, tuberculosis; TGA, total glycolytic activity.

References

    1. Hershkovitz I, et al. Detection and molecular characterization of 9,000-year-old Mycobacterium tuberculosis from a Neolithic settlement in the Eastern Mediterranean. PLoS One. 2008;3:e3426. doi: 10.1371/journal.pone.0003426. - DOI - PMC - PubMed
    1. Tuberculosis Fact Sheet (World Health Organization, 2022).
    1. Tiemersma EW, van der Werf MJ, Borgdorff MW, Williams BG, Nagelkerke NJ. Natural history of tuberculosis: duration and fatality of untreated pulmonary tuberculosis in HIV negative patients: a systematic review. PLoS One. 2011;6:e17601. doi: 10.1371/journal.pone.0017601. - DOI - PMC - PubMed
    1. The END TB Strategy (The World Health Assembly, 2014).
    1. Zumla A, Nahid P, Cole ST. Advances in the development of new tuberculosis drugs and treatment regimens. Nat. Rev. Drug Discov. 2013;12:388–404. doi: 10.1038/nrd4001. - DOI - PubMed

Publication types

MeSH terms

Associated data