. 2024 Feb 16;7(1):195.
doi: 10.1038/s42003-024-05860-z.

Ketogenic diet and BHB rescue the fall of long-term potentiation in an Alzheimer's mouse model and stimulates synaptic plasticity pathway enzymes

Affiliations

Ketogenic diet and BHB rescue the fall of long-term potentiation in an Alzheimer's mouse model and stimulates synaptic plasticity pathway enzymes

Jacopo Di Lucente et al. Commun Biol. .

Abstract

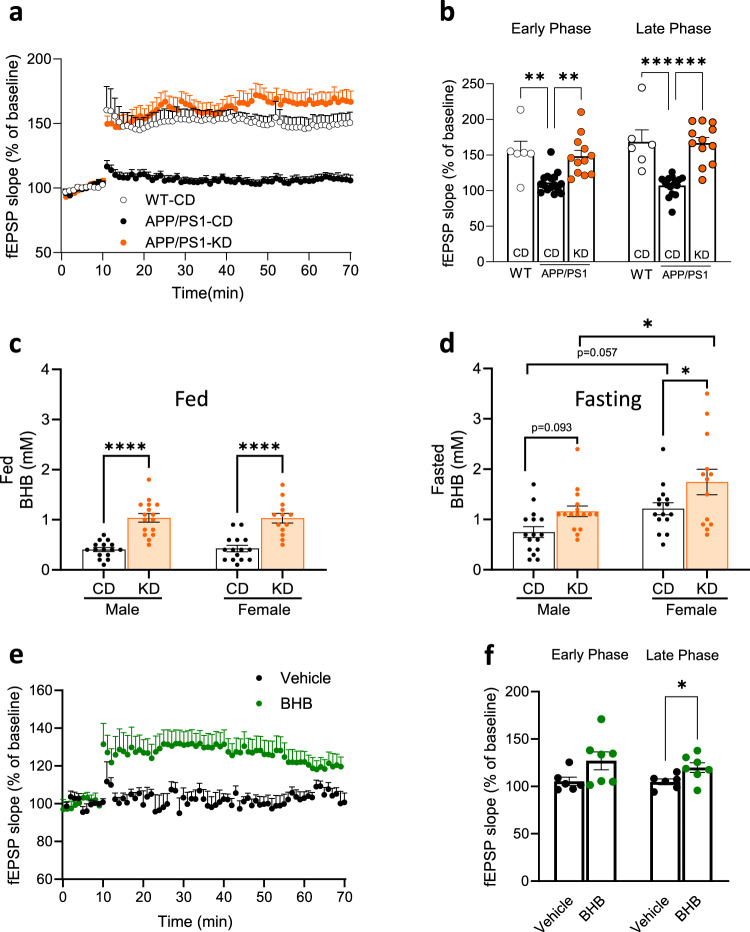
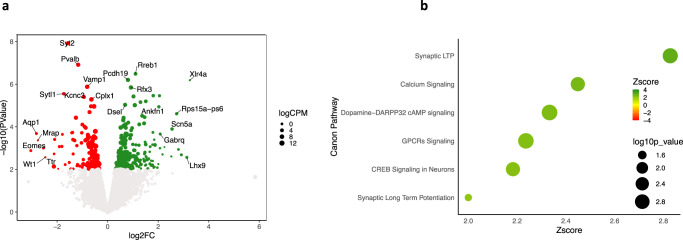
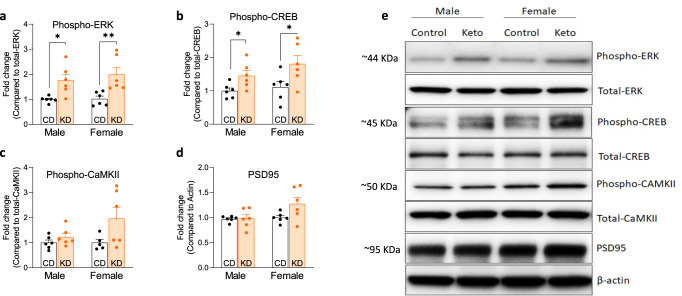
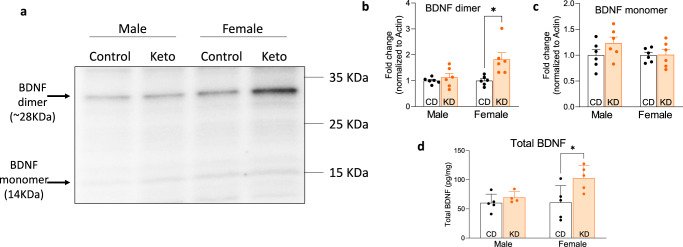
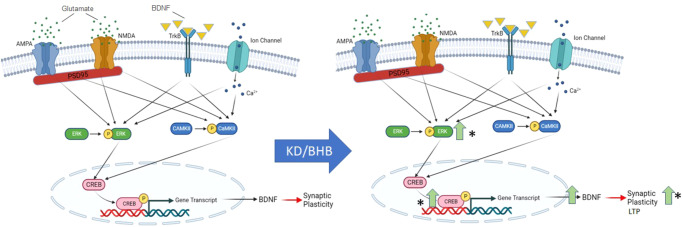
The Ketogenic Diet (KD) improves memory and longevity in aged C57BL/6 mice. We tested 7 months KD vs. control diet (CD) in the mouse Alzheimer's Disease (AD) model APP/PS1. KD significantly rescued Long-Term-Potentiation (LTP) to wild-type levels, not by changing Amyloid-β (Aβ) levels. KD's 'main actor' is thought to be Beta-Hydroxy-butyrate (BHB) whose levels rose significantly in KD vs. CD mice, and BHB itself significantly rescued LTP in APP/PS1 hippocampi. KD's 6 most significant pathways induced in brains by RNAseq all related to Synaptic Plasticity. KD induced significant increases in synaptic plasticity enzymes p-ERK and p-CREB in both sexes, and of brain-derived neurotrophic factor (BDNF) in APP/PS1 females. We suggest KD rescues LTP through BHB's enhancement of synaptic plasticity. LTP falls in Mild-Cognitive Impairment (MCI) of human AD. KD and BHB, because they are an approved diet and supplement respectively, may be most therapeutically and translationally relevant to the MCI phase of Alzheimer's Disease.


Conflict of interest statement

The authors declare no competing interests.

Figures

Fig. 1
Fig. 1. Ketogenic diet and BHB prevent LTP impairments in APP/PS1 mice.
a HFS-induced LTP was impaired in slices from 13-month-old male (n = 4) and female (n = 4) APP/PS1 mice, compared with slices from wild-type mice (n = 6). In KD-treated APP/PS1 slices, HFS included LTP similar to wild-type (n = 3 male and 3 female). b Cumulative data showing mean fEPSP slopes 3 min (early phase) or 50–60 min (late phase) post-HFS. c Blood β-hydroxybutyrate was significantly increased in both males and females in the KD versus CD groups in the fed state (measured 3 h after feeding). Two-way ANOVA with Tukey’s post-hoc tests shows significant differences between diet treatments (F(1,56) = 70.96, p < 0.001). d Blood β-hydroxybutyrate levels were significantly increased in female mice in the KD versus CD groups following a 12-h overnight fast (n = 13–16 per group). Two-way ANOVA with Tukey’s post-hoc tests shows significant differences between diet treatments (F(1,56) = 10.14, p = 0.0024) and between genders (F(1,56) = 12.44, p = 0.0008). e BHB-treated APP/PS1 slices show increased LTP compared to vehicle-treated APP/PS1 slice (n = 2 male and 2 female). f Cumulative data showing mean fEPSP slopes 3 min (early phase) or 50–60 min (late phase) post-HFS. Data are presented as median ± interquartile range. **p < 0.01, ***p < 0.001, Kruskal–Wallis statistic = 15.51 and p < 0.001 for early phase. Kruskal–Wallis statistic = 22.68 and p < 0.001 for the late phase. Data for BHB experiments are presented as mean ± SEM *p < 0.05, unpaired t-test.
Fig. 2
Fig. 2. Gene Ontology supports the view that KD alters synaptic plasticity in APP/PS1 mice.
a Volcano plot of differentially expressed genes (DEGs) induced by KD. Upregulated genes are shown in green, while downregulated genes are shown in red. Genes with log2FC greater than 2 or lower than −2 or the most significant are also labeled. The dimension of dots reflects the logCPM (logarithm of counts per million reads). b Ingenuity Pathway Analysis of genes influenced by diet. Canonical pathways with absolute z-score greater than 2 and −log p-value > 1.3 are reported in green, while dimensions of dots reflect FDR values as indicated in figure.
Fig. 3
Fig. 3. Ketogenic diet activates CREB and ERK but not CaMKII in the hippocampus of APP/PS1 mice.
ad Relative protein level of phospho-CREB, phospho-ERK, phospho-CaMKII, and PSD95. Six-month treatment with a ketogenic diet increases the activation of CREB and ERK in APP/PS1 mice but does not affect CaMKII or PSD95 (n = 6). e Representative immunoblot of phosphorylated and total proteins. Data are presented as mean ± SEM. *p < 0.05, **p < 0.01. Two-way ANOVA tests show significant differences between diet treatments in phospho-ERK: F(1,20) = 19.97, p < 0.001; phospho-CREB: F(1,20) = 10.84, p = 0.004; phospho-CamKII: F(1,19) = 5.344, p = 0.032.
Fig. 4
Fig. 4. Ketogenic diet reduces microglial activation in APP/PS1 mice.
ad Relative protein level of CD11b, CD68, Dectin-1, and Iba-1 (n = 6). e Representative immunoblot of microglial activation proteins. h Representative images of astrocytes labeled by GFAP immunostaining in the CA1 area of the hippocampus of APP/PS1 mice. i Quantification of GFAP internal density (n = 3 male and 3 female). f Representative images of microglia labeled by Iba1 immunostaining in the CA1 area of the hippocampus of APP/PS1 mice. g Quantification of Iba1 internal density (n = 3 male and 3 female). Data are presented as mean ± SEM *p < 0.05, **p < 0.01, n = 6. Two-way ANOVA tests show significant differences between diet treatment in Iba-1 F(1,20) = 16.60, p < 0.001; CD11b F(1,20) = 11.64, p = 0.003; CD68 F(1,20) = 8.563, p = 0.008; and Dectin-1 F(1,20) = 7.619, p = 0.012. Data for immunostaining experiments are presented as mean ± SEM *p < 0.05, unpaired t-test.
Fig. 5
Fig. 5. Ketogenic diet increases BDNF level in the hippocampus of female APP/PS1.
a Representative immunoblot and quantitative analysis (b, c) of BDNF dimer and monomer in the hippocampus of APP/PS1 mice. KD-fed female mice show increased BDNF dimer. n = 6. d Hippocampal BDNF level in APP/PS1 mice detected by ELISA. KD-fed female mice show increased levels of brain-derived neurotrophic factor compared to CD-fed littermates. n = 5. Data are presented as mean ± SEM. *p < 0.05. Two-way ANOVA tests show significant differences between diet treatments (F(1,20) = 9.156, p = 0.007) and gender differences (F(1,20) = 4.914, p = 0.038) in BDNF dimer. The analysis also shows significant gender differences in total BDNF (F(1,16) = 4.540, p = 0.049).
Fig. 6
Fig. 6. A biochemical model of pathways supporting Synaptic Plasticity.
Glutamatergic receptors (AMPA and NMDA), intracellular Ca2+, and TrkB activity stimulate the phosphorylation of ERK and CaMKII, which subsequently enhance the phosphorylation of CREB. Activation of CREB regulates gene expression necessary for the formation of long-term memory, including BDNF. A ketogenic diet increases the phosphorylation of the ERK/CREB pathway, increasing BDNF production and synaptic plasticity.

References

    1. Selkoe DJ, Hardy J. The amyloid hypothesis of Alzheimer’s disease at 25 years. EMBO Mol. Med. 2016;8:595–608. doi: 10.15252/emmm.201606210. - DOI - PMC - PubMed
    1. Hardy J, Selkoe DJ. The amyloid hypothesis of Alzheimer’s disease: progress and problems on the road to therapeutics. Science. 2002;297:353–356. doi: 10.1126/science.1072994. - DOI - PubMed
    1. Selkoe DJ. Alzheimer’s disease is a synaptic failure. Science. 2002;298:789–791. doi: 10.1126/science.1074069. - DOI - PubMed
    1. Martin SJ, Grimwood PD, Morris RG. Synaptic plasticity and memory: an evaluation of the hypothesis. Annu Rev. Neurosci. 2000;23:649–711. doi: 10.1146/annurev.neuro.23.1.649. - DOI - PubMed
    1. Hsieh H, et al. AMPAR removal underlies Aβ-induced synaptic depression and dendritic spine loss. Neuron. 2006;52:831–843. doi: 10.1016/j.neuron.2006.10.035. - DOI - PMC - PubMed

Publication types

Substances