. 2024 Mar;27(3):587-599.
doi: 10.1038/s41593-023-01550-x. Epub 2024 Feb 16.

Ripple-locked coactivity of stimulus-specific neurons and human associative memory

Affiliations

Ripple-locked coactivity of stimulus-specific neurons and human associative memory

Lukas Kunz et al. Nat Neurosci. 2024 Mar.

Abstract

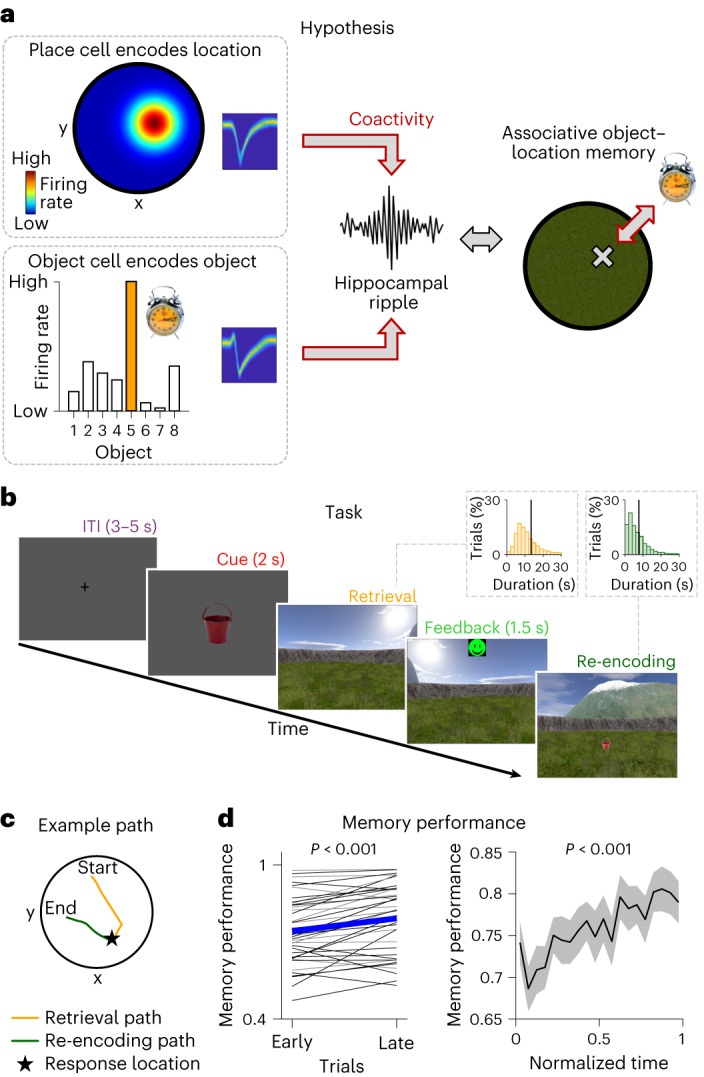
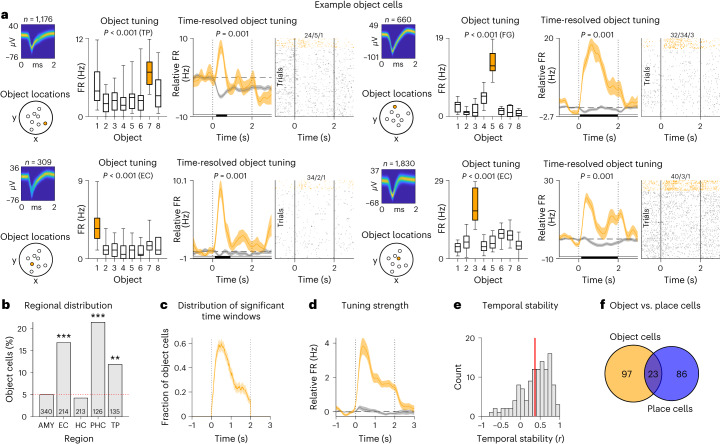
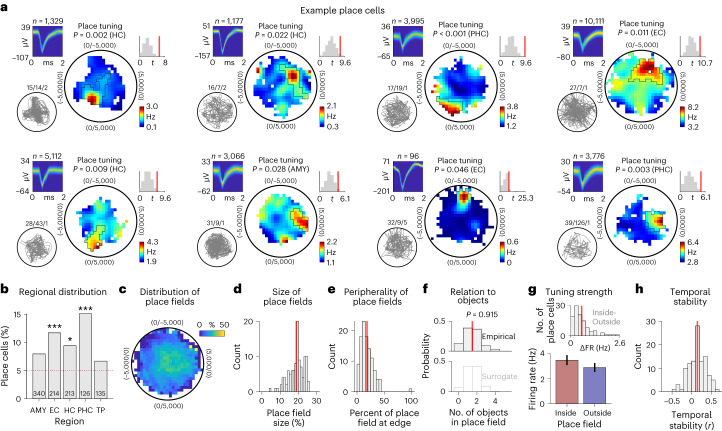
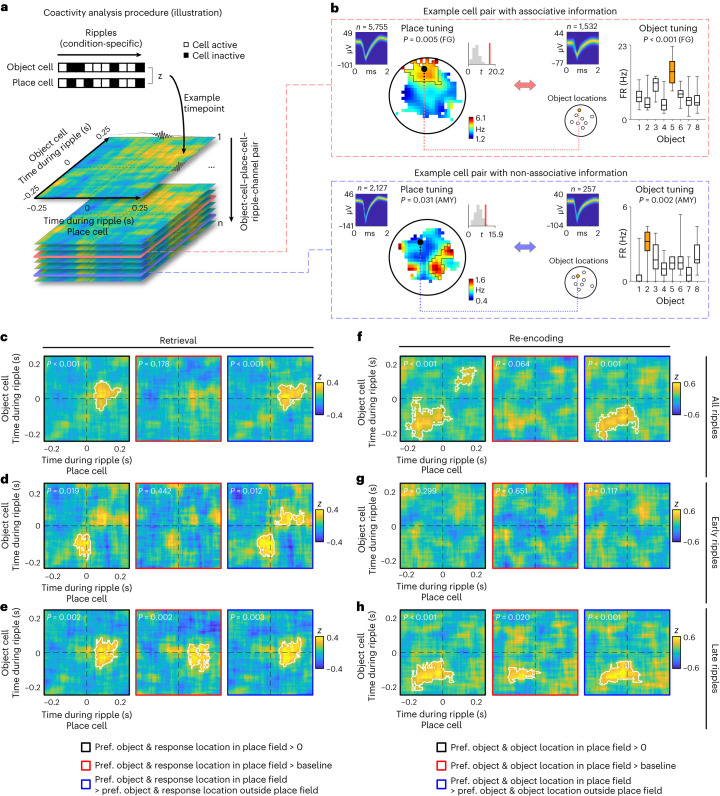
Associative memory enables the encoding and retrieval of relations between different stimuli. To better understand its neural basis, we investigated whether associative memory involves temporally correlated spiking of medial temporal lobe (MTL) neurons that exhibit stimulus-specific tuning. Using single-neuron recordings from patients with epilepsy performing an associative object-location memory task, we identified the object-specific and place-specific neurons that represented the separate elements of each memory. When patients encoded and retrieved particular memories, the relevant object-specific and place-specific neurons activated together during hippocampal ripples. This ripple-locked coactivity of stimulus-specific neurons emerged over time as the patients' associative learning progressed. Between encoding and retrieval, the ripple-locked timing of coactivity shifted, suggesting flexibility in the interaction between MTL neurons and hippocampal ripples according to behavioral demands. Our results are consistent with a cellular account of associative memory, in which hippocampal ripples coordinate the activity of specialized cellular populations to facilitate links between stimuli.


Conflict of interest statement

The authors declare no competing interests.

Figures

Fig. 1
Fig. 1. Hypothesis and associative object–location memory task.
a, Illustration of the hypothesis that human associative object–location memory is linked to the coactivity of object cells and place cells during hippocampal ripples. We propose that the coactivity is specific to pairs of object and place cells that encode ‘associative information’, which are those cell pairs in which the location of the preferred object of the object cell is inside the place field of the place cell. b, Participants performed an associative object–location memory task while navigating freely in a virtual environment. After collecting eight different objects from their associated locations during an initial encoding period, participants performed a series of test trials. At the beginning of each test trial, after an inter-trial interval (‘ITI’), one of the eight objects was presented (‘Cue’), which the participant placed as accurately as possible at its associated location during retrieval (‘Retrieval’). Participants received feedback depending on the accuracy of their response (‘Feedback’) and collected the then-visible object from its correct location (‘Re-encoding’). Insets show histograms of the self-paced durations of retrieval (yellow) and re-encoding (green) periods. Black vertical lines indicate mean durations. c, Example paths during retrieval (yellow) and re-encoding (green) in one trial. Start, start location during retrieval. End, end location during re-encoding. The participant’s response location is indicated by a star. d, Left, memory performance during early versus late trials (median split) showing that participants improved their memories over time (two-sided paired t-test). Blue thick line indicates mean across sessions; thin lines indicate session-wise data (black, sessions with single-neuron recordings). Right, memory performance as a function of normalized time (two-sided Pearson correlation). Black, mean across sessions; gray shading, ±s.e.m. across sessions.
Fig. 2
Fig. 2. Ripples in the human hippocampus.
a, Location of an example bipolar hippocampal channel (blue arrow). Blue circles, electrode contacts contributing to the bipolar channel; orange circles, other contacts. b, Probability distribution of all bipolar hippocampal channels, overlaid on the participants’ average MRI scan. c, MTL regions used for the recordings of LFPs and single-neuron activity. d, Illustration of the two innermost electrode contacts of an intracranial EEG macroelectrode with microelectrodes protruding from its tip. e, Analysis procedure for identifying ripples. Top to bottom: raw macroelectrode LFP; macroelectrode LFP filtered in the 80–140-Hz ripple band; smoothed envelope of the ripple band macroelectrode LFP; and spectrogram of the macroelectrode LFP. The power spectrum of each ripple event had to exhibit a global peak between 80 Hz and 140 Hz (white inset in bottom panel); otherwise, it was discarded as a false positive. f, Action potentials of two clusters from a microelectrode simultaneously recorded with the macroelectrode data. g, Raw voltage trace of an example hippocampal ripple (green) in the time domain (left) and its relative power spectrogram in the time–frequency domain (right). Time 0, ripple peak. h, Grand average voltage trace of hippocampal ripples across all channels in the time domain (left) and their power spectrogram in the time–frequency domain (right). Ripples were first averaged per channel and then across channels. Voltage traces are baseline corrected with respect to ±3 s around the ripple peak. Error bands, ±s.e.m. Ripple power is shown as the relative change with respect to the average power within ±3 s around the ripple peak. Time 0, ripple peak. i, Delta phase locking (0.5–2 Hz) of hippocampal ripples. Black histogram, ripple-associated delta phase for each channel. Gray histogram, delta phases of surrogate ripples. AMY, amygdala; EC, entorhinal cortex; HC, hippocampus; PHC, parahippocampal cortex; RC, relative change; RP, relative power; TP, temporal pole.
Fig. 3
Fig. 3. Ripples in the human hippocampus are linked to behavioral state and memory performance in an associative object–location memory task.
a, Ripple characteristics during the different trial phases (n = 62 channels). As compared to ITI periods, ripple rates were increased during cue periods and reduced during retrieval, feedback and re-encoding periods (repeated-measures ANOVA: P < 0.001). Ripple durations showed a similar pattern as ripple rates (P = 0.046) but no significant post hoc comparisons. Ripple frequency was not modulated by trial phase (P = 0.690). b, Correlations between ripple rates and memory performance (n = 62 channels). For each channel, we computed across-trial correlations between ripple rates in a given trial phase and memory performance during the retrieval phase, and we tested the correlation values against 0 across channels (two-sided t-tests with Bonferroni correction for multiple comparisons). Increased ripple rates during cue periods were associated with better memory performance in the subsequent retrieval periods (Pcorr. = 0.038), and retrieval periods with poorer performance were followed by increased ripple rates during subsequent re-encoding periods (Pcorr. < 0.001). c, Time-resolved ripple occurrence across all trials as a function of absolute time relative to the onset (cue and feedback) or offset (ITI, retrieval and re-encoding) of a given trial phase (dashed vertical lines). Each dot is a ripple (colored dots, ripples during good-performance trials; gray dots, ripples during bad-performance trials). Colored lines and shadings, ripple rates during good-performance trials (‘good trials’; mean ± s.e.m. across channels); gray lines and shadings, ripple rates during bad-performance trials (‘bad trials’; mean ± s.e.m. across channels). Black shadings at top indicate time periods with significant differences between good and bad trials (two-sided cluster-based permutation tests: P < 0.025). d, Correlations between ripple rates and trial index (n = 62 channels). We tested the correlation values against 0 afterward (two-sided t-tests with Bonferroni correction). Ripple rates during feedback decreased over time (Pcorr. = 0.012). Box plots in a, b and d show center line, median; box limits, upper and lower quartiles; whiskers, minimum and maximum; and points, outliers. *Pcorr. < 0.05 and ***Pcorr. < 0.001.
Fig. 4
Fig. 4. Hippocampal ripples are associated with changes in LFP power and firing rates across the human MTL.
a, Cross-correlations between hippocampal ripples and ripples in extra-hippocampal MTL regions (temporal pole, amygdala, entorhinal cortex and parahippocampal cortex). Blue and gray numbers indicate the number of ipsilateral and contralateral channel pairs, respectively. Time 0, peak of hippocampal ripples. Cross-correlations are smoothed with a Gaussian kernel of 0.2-s duration and normalized by z-scoring cross-correlation values over time lags of ±0.5 s. Shaded region, mean ± s.e.m. across channel pairs. Black shading at top indicates cross-correlations from both ipsilateral and contralateral channel pairs significantly above 0 (one-sided cluster-based permutation test: P < 0.05). b, Time–frequency-resolved LFP power (z-scored relative to the entire experiment) in extra-hippocampal MTL regions during hippocampal ripples. Power values are smoothed over time with a Gaussian kernel of 0.2-s duration. Time 0, ripple peak. Black contours, significantly increased power; white contours, significantly decreased power (two-sided cluster-based permutation tests: P < 0.025). c, Normalized LFP power extracted from the time periods of hippocampal ripples and averaged over time. Error bands, ±s.e.m. d, Single-neuron firing rates (z-scored relative to the entire experiment) in hippocampal and extra-hippocampal regions during hippocampal ripples. Firing rates are smoothed over time with a Gaussian kernel of 0.2-s duration. Error bands, ±s.e.m. Blue and gray numbers indicate the number of ipsilateral and contralateral neuron–ripple channel pairs, respectively. Black shading at top indicates firing rates of ipsilateral and contralateral pairs significantly above 0 (one-sided cluster-based permutation test: P < 0.05). For region-specific and trial-phase-specific results, see Supplementary Figs. 8 and 9. AMY, amygdala; CH, contralateral hemispheres; EC, entorhinal cortex; HC, hippocampus; IH, ipsilateral hemispheres; PHC, parahippocampal cortex; TP, temporal pole; X-Correlation, cross-correlation.
Fig. 5
Fig. 5. Neurons in the human MTL encode specific objects.
a, Example object cells. For each cell, from left to right: action potentials as density plot; locations of the objects in the environment; absolute firing rates in response to the different objects during the cue period (statistics are from one-sided permutation tests, using a total of n = 1,176, 660, 309 and 1,830 action potentials during all cue periods, respectively); time-resolved firing rates (baseline corrected relative to −1 s to 0 s before cue onset) for the preferred and the unpreferred objects (error bands, ±s.e.m.); and spike raster for all trials. Time 0, cue onset. Orange, data for the preferred object; gray, data for unpreferred objects. Box plots show center line, median; box limits, upper and lower quartiles; and whiskers, minimum and maximum. Black shading below the time-resolved firing rates, significant difference between firing rates (one-sided cluster-based permutation test: P < 0.05). b, Distribution of object cells across brain regions; red line, 5% chance level. Object cells were significantly prevalent in the entorhinal cortex, parahippocampal cortex and temporal pole (two-sided binomial tests versus chance with Bonferroni correction for multiple comparisons: Pcorr. < 0.001, Pcorr. < 0.001 and Pcorr. = 0.006, respectively). c, Distribution of significant time windows across object cells (mean ± s.e.m.). d, Tuning strength across object cells (mean ± s.e.m.). Orange, data for the preferred object; gray, data for unpreferred objects. e, Temporal stability of object cell tuning. Red line, mean. f, Overlap between object and place cells. AMY, amygdala; EC, entorhinal cortex; FG, fusiform gyrus; HC, hippocampus; PHC, parahippocampal cortex; TP, temporal pole. **Pcorr. < 0.01 and ***Pcorr. < 0.001.
Fig. 6
Fig. 6. Neurons in the human MTL encode specific spatial locations.
a, Example place cells. For each cell, from left to right: action potentials as density plot; navigation path of the participant through the environment (gray line); smoothed firing rate map (unvisited areas are shown in white); empirical t-statistic (red line) and surrogate t-statistics (gray histogram) from two-sided unpaired t-tests (using a total of n = 1,329, 1,177, 3,995, 10,111, 5,112, 3,066, 96 and 3,776 action potentials, respectively); and color bar, firing rate. b, Distribution of place cells across brain regions; red line, 5% chance level. Place cells were significantly prevalent in the entorhinal cortex, hippocampus and parahippocampal cortex (two-sided binomial tests versus chance with Bonferroni correction for multiple comparisons: Pcorr. < 0.001, Pcorr. = 0.034 and Pcorr. < 0.001, respectively). c, Spatial distribution of the place fields of all place cells (in percent relative to the spatial distribution of the firing rate maps). d, Histogram of place field sizes. Place field sizes are expressed in percent relative to the sizes of the firing rate maps by dividing the number of spatial bins being part of the place field by the number of spatial bins being part of the firing rate map. Unoccupied spatial bins are ignored. Red line, mean. e, Histogram of place field fractions that were next to the edges of the firing rate maps, quantifying the peripherality of the place fields. Red line, mean. f, Histogram of the number of objects inside place fields. The number of objects inside empirical place fields (top) is not increased as compared to surrogate place fields (bottom; two-sided two-sample Kolmogorov–Smirnov test). Red line, mean. g, Firing rate of place cells inside versus outside the place fields (n = 109 place cells). Bars and error bars show mean ± s.e.m. Histogram at top shows the distribution of cell-wise differences in firing rates inside minus outside the place fields (ΔFR). h, Temporal stability of the firing rate maps of place cells; red line, mean. AMY, amygdala; EC, entorhinal cortex; HC, hippocampus; PHC, parahippocampal cortex; TP, temporal pole. *Pcorr. < 0.05 and ***Pcorr. < 0.001.
Fig. 7
Fig. 7. Ripple-locked coactivity of object and place cells during the retrieval and formation of associative memories.
a, Analysis of ripple-locked coactivity of object and place cells (illustration). b, Example pairs of object and place cells with associative and non-associative information. For both place cells, from left to right: action potentials as density plot; smoothed firing rate map (unvisited areas are shown in white); empirical t-statistic (red line) and surrogate t-statistics (gray histogram) from two-sided unpaired t-tests (using a total of n = 5,755 and 2,127 action potentials, respectively); and color bar, firing rate. For both object cells, from left to right: action potentials as density plot; locations of the objects in the environment; and absolute firing rates in response to the different objects during the cue period (statistics are from one-sided permutation tests, using a total of n = 1,532 and 257 action potentials during all cue periods, respectively). Orange, data for the preferred object; gray, data for unpreferred objects. Box plots show: center line, median; box limits, upper and lower quartiles; and whiskers, minimum and maximum. c, Coactivity maps estimated using all ripples during retrieval periods, considering only trials in which the participant is asked to remember the location of the preferred object of the object cell and in which the participant’s response location is inside the place field of the place cell. Left, comparison of the coactivity maps against chance (that is, 0). Middle, comparison against baseline coactivity maps. Right, comparison against coactivity maps estimated using ripples from trials in which the participant is asked to remember the location of the preferred object of the object cell and in which the participant’s response location is outside the place field of the place cell. d, Same as in c for early retrieval-related hippocampal ripples. e, Same as in c for late retrieval-related hippocampal ripples. f, Coactivity maps estimated using all ripples from the re-encoding periods, considering only trials in which the participant is asked to re-encode the correct location of the preferred object of the object cell and in which the object’s correct location is inside the place cell’s place field. Left, comparison of the coactivity maps against chance (that is, 0). Middle, comparison against baseline coactivity maps. Right, comparison against coactivity maps estimated using ripples from trials in which the participant is asked to re-encode the location of the preferred object of the object cell and in which the object’s correct location is outside the place cell’s place field. g, Same as in f for early re-encoding-related hippocampal ripples. h, Same as in f for late re-encoding-related hippocampal ripples. White lines in ch delineate significant clusters based on one-sided cluster-based permutation tests, which control for multiple comparisons and whose P values are stated at the upper left (see the main text and Supplementary Table 2 for Bonferroni-corrected P values). AMY, amygdala; FG, fusiform gyrus; pref., preferred.

Similar articles

Cited by

References

    1. Kahana, M. J. Foundations of Human Memory (Oxford Univ. Press, 2014).
    1. Naveh-Benjamin M. Adult age differences in memory performance: tests of an associative deficit hypothesis. J. Exp. Psychol. Learn. Mem. Cogn. 2000;26:1170–1187. - PubMed
    1. Bastin C, et al. Associative memory and its cerebral correlates in Alzheimer’s disease: evidence for distinct deficits of relational and conjunctive memory. Neuropsychologia. 2014;63:99–106. - PMC - PubMed
    1. Squire LR, Stark CEL, Clark RE. The medial temporal lobe. Annu. Rev. Neurosci. 2004;27:279–306. - PubMed
    1. Neves G, Cooke SF, Bliss TVP. Synaptic plasticity, memory and the hippocampus: a neural network approach to causality. Nat. Rev. Neurosci. 2008;9:65–75. - PubMed