. 2024 Mar;16(3):575-595.
doi: 10.1038/s44321-024-00026-0. Epub 2024 Feb 16.

Inhibition of SFTSV replication in humanized mice by a subcutaneously administered anti-PD1 nanobody

Affiliations

Inhibition of SFTSV replication in humanized mice by a subcutaneously administered anti-PD1 nanobody

Mengmeng Ji et al. EMBO Mol Med. 2024 Mar.

Abstract

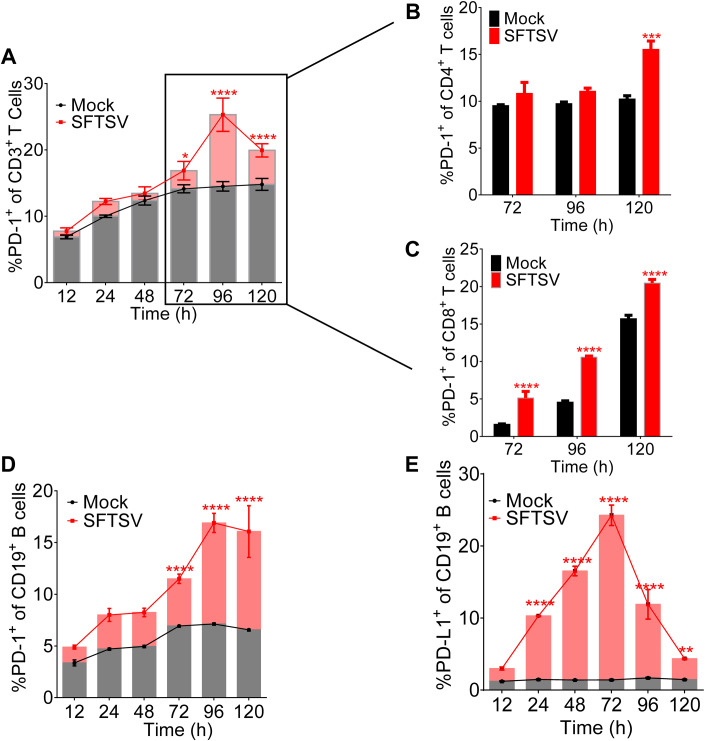
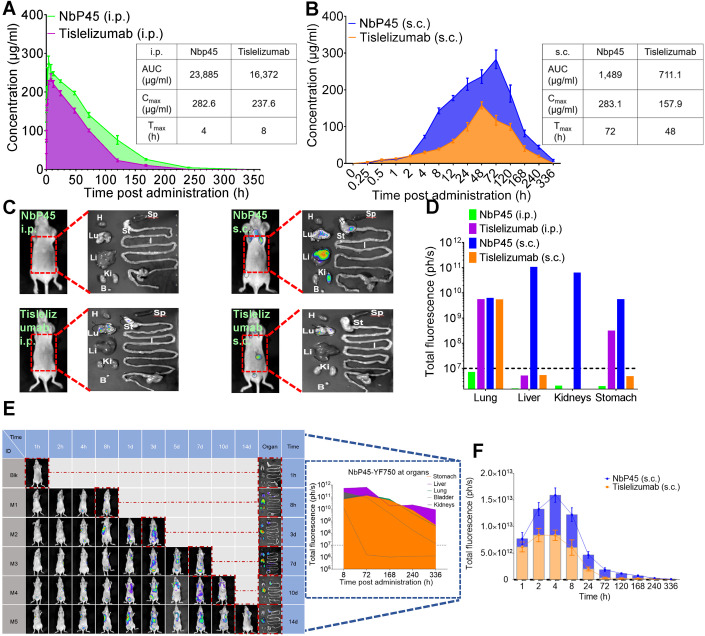
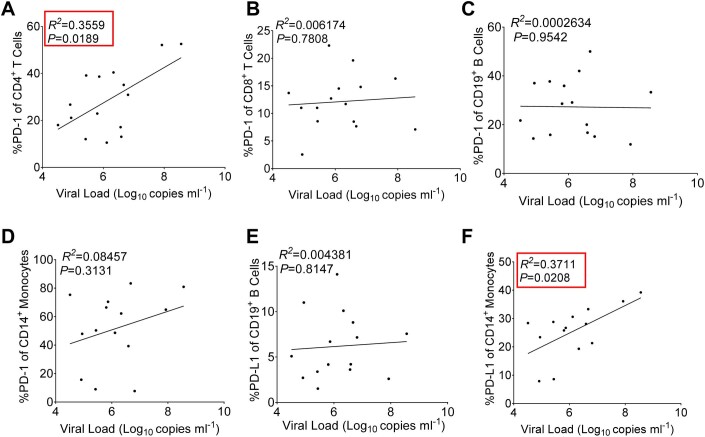
Severe fever with thrombocytopenia syndrome (SFTS) is a life-threatening disease caused by a novel bunyavirus (SFTSV), mainly transmitted by ticks. With no effective therapies or vaccines available, understanding the disease's mechanisms is crucial. Recent studies found increased expression of programmed cell death-1 (PD-1) on dysfunctional T cells in SFTS patients. However, the role of the PD-1/programmed cell death-ligand 1 (PD-L1) pathway in SFTS progression remains unclear. We investigated PD-1 blockade as a potential therapeutic strategy against SFTSV replication. Our study analyzed clinical samples and performed in vitro experiments, revealing elevated PD-1/PD-L1 expression in various immune cells following SFTSV infection. An anti-PD-1 nanobody, NbP45, effectively inhibited SFTSV infection in peripheral blood mononuclear cells (PBMCs), potentially achieved through the mitigation of apoptosis and the augmentation of T lymphocyte proliferation. Intriguingly, subcutaneous administration of NbP45 showed superior efficacy compared to a licensed anti-PD-1 antibody in an SFTSV-infected humanized mouse model. These findings highlight the involvement of the PD-1/PD-L1 pathway during acute SFTSV infection and suggest its potential as a host target for immunotherapy interventions against SFTSV infection.

Keywords: Nanobody; NbP45; PD-1 Blockade; SFTSV; Subcutaneous Injection.


Conflict of interest statement

The authors declare no competing interests.

Figures

Figure 1
Figure 1. PD-1/PD-L1 was upregulated in immune cells of SFTS patients.
(A) Viral loads in serum among SFTS patients (n = 15) were measured by RT-PCR. Two‐tailed unpaired t test was performed to compare SFTS patients with healthy control (****P < 0.0001). (B) Peripheral blood mononuclear cells (PBMCs) were isolated using density-gradient centrifugation with Ficoll-Hypaque-gradient separation. (CF) The expression of PD-1 in CD4+ (C) and CD8+ (D) T, CD19+ B cells (E), and CD14+ monocytes (F) was summarized for the SFTS patients (n = 15) and the healthy control (n = 15). Two‐tailed unpaired t test was performed to compare SFTS patients with healthy control (***P = 0.0002 (C, D); ***P = 0.0005 (E); ****P < 0.0001(F)). (G, H) The expression of PD-L1 in CD19+ B cells (G) and CD14+ monocytes (H) was summarized for the SFTS patients (n = 15) and the healthy control (n = 15). Two‐tailed unpaired t test was performed to compare SFTS patients with healthy control (****P < 0.0001). Data information: (A, CH) data are shown as mean ± SEM. ***P < 0.001; ****P  < 0.0001. Source data are available online for this figure.
Figure 2
Figure 2. SFTSV infection induced PD-1/PD-L1 upregulation on T/B lymphocytes.
(A) The PD-1 expression of CD3+ T cells was summarized for the uninfected controls (n = 3) and the SFTSV (MOI = 1) infection (n = 3) at various time points. Two-way ANOVA with Tukey’s test was performed to compare SFTSV infection with uninfected control (*P = 0.0216; ****P <0.0001). (B, C) The PD-1 expression of CD4+ (B) and CD8+ (C) T cell was summarized for the uninfected controls (n = 3) and the SFTSV (MOI = 1) infection (n = 3) at 72/96/120 h. Two-way ANOVA with Tukey’s test was performed to compare SFTSV infection with uninfected control (***P = 0.0002; ****P < 0.0001). (D, E) The PD-1 (D)/PD-L1 (E) expression of CD19+ B lymphocytes was summarized for the uninfected controls (n = 3) and the SFTSV (MOI = 1) infection (n = 3) at various time points. Two-way ANOVA with Tukey’s test was performed to compare SFTSV infection with uninfected control (**P = 0.0069; ****P < 0.0001). Data information: (AE) data are shown as mean ± SEM. *P < 0.05; **P < 0.01; ***P < 0.001; ****P < 0.0001. The n means the number of sample repeats in one experiment at the same time. Source data are available online for this figure.
Figure 3
Figure 3. PD-L1 upregulation in SFTSV infection of THP-1 cells.
(A) The PD-L1 expression of THP-1 cells was summarized for the uninfected controls (n = 3) and the SFTSV infection at an MOI = 1/3/10 (n = 3) for 48 h. One-way ANOVA with Tukey’s test was performed to compare SFTSV infection with uninfected control (****P < 0.0001). (B) Correlation between PD-L1 expression and viral RNA copies in SFTSV-infected THP-1 at an MOI = 1/3/10 (n = 3). (C) The PD-L1 expression of THP-1 cells was summarized for the uninfected controls (n = 3) and the SFTSV (MOI = 1) infection (n = 3) at various time points. Two-way ANOVA with Tukey’s test was performed to compare SFTSV infection with uninfected control (****P < 0.0001). (D) Correlation between PD-L1 expression and viral RNA copies in SFTSV (MOI = 1) infected THP-1 at various time points. (E) The PD-L1 expression of macrophages was summarized for the uninfected controls (n = 3) and the SFTSV infection at an MOI = 1/3/10 (n = 3) for 48 h. One-way ANOVA with Tukey’s test was performed to compare SFTSV infection with uninfected control (**P = 0.0030; ****P < 0.0001). (F) Correlation between PD-L1 expression and viral RNA copies in SFTSV-infected macrophages at an MOI = 1/3/10 (n = 3). (G) The PD-L1 expression of macrophages was summarized for the uninfected controls (n = 3) and the SFTSV (MOI = 1) infection (n = 3) at various time points. Two-way ANOVA with Tukey’s test was performed to compare SFTSV infection with uninfected control (*P = 0.0219; ****P < 0.0001). (H) Correlation between PD-L1 expression and viral RNA copies in SFTSV (MOI = 1) infected macrophages at various time points. Data information: (A, C, E, G) data are shown as mean ± SEM. *P < 0.05; **P < 0.01; ****P < 0.0001. The n means the number of sample repeats in one experiment at the same time. (B, D, F, H) Correlation analyses were performed by linear regression using the GraphPad Prism 6.0 program, Pearson’s correlation tests were used to measure the strength of association between variables. Source data are available online for this figure.
Figure 4
Figure 4. Characterization of binding specificity of NbP45.
(A) The purity of NbP45 was determined by SDS-PAGE under nonreducing (NR) or reducing condition (R). (B) PD-1 protein under nonreducing conditions (NR) or reducing conditions (R) was detected by western blot with NbP45 or Tislelizumab specific for PD-1 protein. (C) Kinetic binding curve of NbP45 at the concentration 300 nM, 100 nM, 33.3 nM, 11.1 nM, 3.7 nM and 1.2 nM with PD-1 proteins by BLI. (D, E) The binding curve of NbP45 (n = 2) or Tislelizumab (n = 2) with PD-1 protein detected by ELISA (D) and by FACS (E). The black line was taken as a negative control. (F) The Inhibition curve of NbP45 or Tislelizumab blocked PD-1 binding to PD-L1 was detected by FACS. Data information: (D, E) data are shown as mean ± SEM.
Figure 5
Figure 5. NbP45 reduced apoptosis and enhanced proliferation of T lymphocytes, and potently inhibited SFTSV replication.
(A) The inhibition activity of NbP45 (n = 3) or Tislelizumab (n = 3) against SFTSV (MOI = 1) infection PBMCs at 48 hpi. One-way ANOVA with Tukey’s test was performed to compare the treatment group with the control group (PBS) (****P < 0.0001). (B) The ratio of CD8+/CD4+ T cells in NbP45 (n = 3) or Tislelizumab (n = 3) against SFTSV (MOI = 1) infection PBMCs at 48 hpi. One-way ANOVA with Tukey’s test was performed to compare the treatment group with the control group (PBS) (**P = 0.0024; ***P = 0.0002). (C, D) Annexin V+ expression of CD4+ (C) and CD8+ (D) T cells was summarized for the untreated controls (n = 3) and the treatment (n = 3) at 48 hpi. One-way ANOVA with Tukey’s test was performed to compare the treatment group with the control group (PBS) (****P < 0.0001). (EG) The HLA-DR (E), Ki-67 (F), and IFN-γ (G) expression of CD4+ T cells were summarized for the untreated controls (n = 3) and the treatment (n = 3) at 48 hpi. One-way ANOVA with Tukey’s test was performed to compare the treatment group with the control group (PBS) (***P = 0.0009 (NbP45 vs. PBS), **P = 0.0017 (Tislelizumab vs. PBS), ***P = 0.0006 (PBS vs. Mock) (E); **P = 0.0060, ****P < 0.0001 (F); ***P = 0.0003 (NbP45 vs. PBS), ***P = 0.0001 (Tislelizumab vs. PBS), **P = 0.0021 (PBS vs. Mock) (G)). (HJ) The HLA-DR (H), Ki-67 (I), and IFN-γ (J) expression of CD8+ T cells were summarized for the untreated controls (n = 3) and the treatment (n = 3) at 48 hpi. One-way ANOVA with Tukey’s test was performed to compare the treatment group with the control group (PBS) (**P = 0.0013 (NbP45 vs. PBS), **P = 0.0020 (Tislelizumab vs. PBS), ****P < 0.0001 (PBS vs. Mock) (H); **P = 0.0026 (NbP45 vs. PBS), ***p = 0.0002 (Tislelizumab vs. PBS), **P = 0.0014 (PBS vs. Mock) (I); *P = 0.0112 (NbP45 vs. PBS), ***P = 0.0003 (Tislelizumab vs. PBS), **P = 0.0011 (PBS vs. Mock) (J)). Data information: Data are shown as mean ± SEM. *P <0.05; **P < 0.01; ***P < 0.001; ****P < 0.0001. The n means the number of sample repeats in one experiment at the same time. Source data are available online for this figure.
Figure 6
Figure 6. NbP45 administrated via s.c. exhibited long-lasting in vivo kinetics.
(A, B) Bioavailability of NbP45 or Tislelizumab in nude mice. NbP45 or Tislelizumab was administered into mice (n = 4, Female) at 400 μg/mouse via i.p. (A) or s.c. (B), respectively. Serum concentration of the NbP45 or Tislelizumab was determined at indicated time points by ELISA. AUC (area under the curve), the total absorption of the drug within 336 h after taking the drug, Cmax, maximum observed plasma concentration, Tmax, the time of maximum observed plasma concentration. (C) Spatial distribution of NbP45-YF750 or Tisilelizumab-YF750 at 14 d after infusion into mice via i.p. or s.c. was detected by NightOwl LB 983. The right figure is the dissected image of the left mouse in the red dashed line. The right figure is the organs from dissected mouse which were imaged immediately after sacrifice. Lu lung, H heart, Li liver, Sp spleen, St stomach, I large and small intestine, Ki kidneys, B bladder. (D) The fluorescence intensity of organs in the organ column of (C) was summarized. Dashed line = limit of detection. (E) Spatial distribution of NbP45-YF750 via subcutaneous administration at indicated time point. Mice was sacrificed at the indicated time point for the analysis of fluorescence intensity in various organs. The figure of blue dashed line was the fluorescence intensity of organs for different time. (F) The fluorescence intensity of the site in subcutaneous injection of NbP45 (n = 3) or Tislelizumab (n = 3) was summarized. The black dashed line was the fluorescence intensity of non-injection control. Data information: (A, B, F) data represent as mean ± SEM. Source data are available online for this figure.
Figure 7
Figure 7. Subcutaneous NbP45 was highly efficacious against SFTSV infection of humanized NCG Mice.
(A) Experimental schedule of NbP45 in the treatment of SFTSV infection. Bottom, table summary of groups with different treatments. (B) Plasma viral loads among seven groups of color-coded NCG-HuPBL mice including no SFTSV challenge (n = 8), SFTSV challenge with PBS treatment as control (n = 11), SFTSV challenge with isotype (NB15) treatment as control (n = 8), NbP45 treatment by s.c. (n = 8) or i.p. (n = 8), Tislelizumab treatment by s.c. (n = 5) or i.p. (n = 5). Each line represents data from 1 group. The limit of detection was 1000 genome copies/ml. Dashed line = limit of detection. Two-way ANOVA with Tukey’s test was performed to compare the treatment group with the control group (PBS) (**P = 0.0023 (9 days); *P = 0.0105 (12 days); ***P = 0.0009 (15 days)). (C) Platelet count was calculated among the same color-coded groups of animals at 15 days, including no SFTSV challenge (n = 8), SFTSV challenge with PBS treatment as control (n = 5), SFTSV challenge with isotype (NB15) treatment as control (n = 7), NbP45 treatment by s.c. (n = 8) or i.p. (n = 5), Tislelizumab treatment by s.c. (n = 3) or i.p. (n = 3). The normal range is between the two dashed lines. Each dot represents data from 1 mouse. The blood from infected mice was collected at 15 days and hematological examination was performed using a hematology analyzer. One-way ANOVA with Tukey’s test was performed to compare the treatment group with control group (PBS) (***P = 0.0003). (D) The ratio of human CD8+/CD4+ T cells from lymphocyte gate among seven groups of color-coded NCG-HuPBL mice at 15 days including no SFTSV challenge (n = 8), SFTSV challenge with PBS treatment as control (n = 5), SFTSV challenge with isotype (NB15) treatment as control (n = 7), NbP45 treatment by s.c. (n = 8) or i.p. (n = 5), Tislelizumab treatment by s.c. (n = 3) or i.p. (n = 3). One-way ANOVA with Tukey’s test was performed to compare the treatment group with control group (PBS) (**P = 0.0032). (E) Serum concentration of the NbP45/Tislelizumab was determined at indicated time points by ELISA. (F) The correlation between plasma viral load and platelet counts among the same color-coded groups of animals. Correlation analyses were performed by linear regression using the GraphPad Prism 6.0 program, Pearson’s correlation tests were used to measure the strength of association between variables. Data information: (BE) data represent mean ± SEM. *P < 0.05; **P < 0.01; ***P < 0.001. Source data are available online for this figure.
Figure EV1
Figure EV1. The expression levels of PD-1/PD-L1 was upregulated in immune cells of SFTS patients.
(AD) The expression levels of PD-1 in CD4+ (A) and CD8+ (B) T, CD19+ B (C) cells and CD14+ monocytes (D) was summarized for the SFTS patients (n = 15) and the healthy control (n = 15). Two‐tailed unpaired t test was performed to compare SFTS patients with healthy control (ns, no significance; **P = 0.0058; ***P = 0.0005). (E, F) The expression levels of PD-L1 in CD19+ B cells (E) and CD14+ monocytes (F) was summarized for the SFTS patients (n = 15) and the healthy control (n = 15). Two‐tailed unpaired t test was performed to compare SFTS patients with healthy control (**P = 0.0079; ****P < 0.0001). Data information: (AF) data are shown as mean ± SEM. ns, no significance; **P < 0.01; ***P < 0.001; ****P < 0.0001.
Figure EV2
Figure EV2. Correlation between PD-1/PD-L1 expression and serum viral load in SFTS patients.
(AD) Correlation between PD-1 in CD4+ (A) and CD8+ (B) T, CD19+ B (C) cells and CD14+ monocytes (D) expression and serum viral load in SFTS patients. (E, F) Correlation between PD-L1 in CD19+ B cells (E) and CD14+ monocytes (F) and viral RNA copies in serum viral load in SFTS patients. Data information: Correlation analyses were performed by linear regression using the GraphPad Prism 6.0 program, Pearson’s correlation tests were used to measure the strength of association between variables.
Figure EV3
Figure EV3. Kinetics of the T/B lymphocytes during SFTSV-infected PBMC.
(A, B) The expression of CD4+ (A) and CD8+ (B) T cells was summarized for the uninfected controls (n = 3) and the SFTSV (MOI = 1) infection (n = 3) at 72/96/120 h. Two-way ANOVA with Sidak’s multiple comparisons test was performed to compare SFTSV infection with uninfected control (**P = 0.0053; ***P = 0.0001). Data information: Data are shown as mean ± SEM. ns, no significance; **P < 0.01; ***P < 0.001. The n means the numbers of sample repeats in one experiment at a same time.
Figure EV4
Figure EV4. Kinetics of viral replication in THP-1/Macrophage cells was examined by serial sampling of cells.
(A) Kinetics of viral replication in THP-1 cells was examined at SFTSV (MOI = 1) infection (n = 3). (B) Annexin V+ expression of THP-1 cells was summarized for the uninfected controls (n = 3) and the SFTSV (MOI = 1) infection (n = 3). Two-way ANOVA with Sidak’s multiple comparisons test was performed to compare SFTSV infection with uninfected control (****P < 0.0001). (C) Kinetics of viral replication in macrophage cells was examined at SFTSV (MOI = 1) infection (n = 3). Data information: Data are shown as mean ± SEM. ****P < 0.0001. The n means the numbers of sample repeats in one experiment at a same time.
Figure EV5
Figure EV5. NbP45 potently inhibited another strain of SFTSV replication.
(A, B). The inhibition activity of NbP45 (n = 3) or Tislelizumab (n = 3) against SFTSV of subtype D (A) or subtype B (B) (MOI = 1) infection PBMCs at 48 hpi. The black dashed line was non-infected control. One-way ANOVA with Tukey’s test was performed to compare treatment group with control group (PBS) (****P < 0.0001). Data information: Data are shown as mean ± SEM. ****P <0.0001. The n means the numbers of sample repeats in one experiment at a same time.

Similar articles

Cited by

References

    1. Bekerman E, Hesselgesser J, Carr B, Nagel M, Hung M, Wang A, Stapleton L, von Gegerfelt A, Elyard HA, Lifson JD, et al. PD-1 blockade and TLR7 activation lack therapeutic benefit in chronic simian immunodeficiency virus-infected macaques on antiretroviral therapy. Antimicrob Agents Chemother. 2019;63:e01163–19. - PMC - PubMed
    1. Blackburn SD, Shin H, Haining WN, Zou T, Workman CJ, Polley A, Betts MR, Freeman GJ, Vignali DAA, Wherry EJ. Coregulation of CD8+ T cell exhaustion by multiple inhibitory receptors during chronic viral infection. Nat Immunol. 2009;10:29–37. - PMC - PubMed
    1. Channappanavar R, Twardy BS, Suvas S. Blocking of PDL-1 interaction enhances primary and secondary CD8 T cell response to herpes simplex virus-1 infection. PLoS ONE. 2012;7:e39757. - PMC - PubMed
    1. Chen C, Li P, Li K-F, Wang H-L, Dai Y-X, Cheng X, Yan J-B. Animals as amplification hosts in the spread of severe fever with thrombocytopenia syndrome virus: a systematic review and meta-analysis. Int J Infect Dis. 2019;79:77–84. - PubMed
    1. Choi S, Kim M-C, Kwon J-S, Kim J-Y, Lee KH, Kim S-H. Case Report: use of plasma exchange followed by convalescent plasma therapy in a critically Ill patient with severe fever and thrombocytopenia syndrome-associated encephalopathy: cytokine/chemokine concentrations, viral loads, and antibody responses. Am J Trop Med Hyg. 2018;99:1466–1468. - PMC - PubMed

Substances