. 2024 Jul 20;15(8):594-611.
doi: 10.1093/procel/pwad067.

Single-cell transcriptomic Atlas of aging macaque ocular outflow tissues

Affiliations

Single-cell transcriptomic Atlas of aging macaque ocular outflow tissues

Jian Wu et al. Protein Cell. .

Abstract

The progressive degradation in the trabecular meshwork (TM) is related to age-related ocular diseases like primary open-angle glaucoma. However, the molecular basis and biological significance of the aging process in TM have not been fully elucidated. Here, we established a dynamic single-cell transcriptomic landscape of aged macaque TM, wherein we classified the outflow tissue into 12 cell subtypes and identified mitochondrial dysfunction as a prominent feature of TM aging. Furthermore, we divided TM cells into 13 clusters and performed an in-depth analysis on cluster 0, which had the highest aging score and the most significant changes in cell proportions between the two groups. Ultimately, we found that the APOE gene was an important differentially expressed gene in cluster 0 during the aging process, highlighting the close relationship between cell migration and extracellular matrix regulation, and TM function. Our work further demonstrated that silencing the APOE gene could increase migration and reduce apoptosis by releasing the inhibition on the PI3K-AKT pathway and downregulating the expression of extracellular matrix components, thereby increasing the aqueous outflow rate and maintaining intraocular pressure within the normal range. Our work provides valuable insights for future clinical diagnosis and treatment of glaucoma.

Keywords: aging; macaque; ocular outflow tissue; single-cell transcriptomic atlas; trabecular meshwork.


Conflict of interest statement

The authors declare no conflict of interests.

Figures
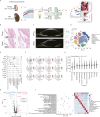
Figure 1.
Figure 1.
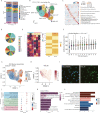
Identification of trabecular meshwork cell types from young and aging samples via single-cell sequence. (A) Experimental workflow for single-cell RNA sequencing of three young and three aging macaque trabecular meshworks. (B) H&E staining of trabecular meshwork of young and aging monkeys. (C) The anterior segment condition of young and aging monkeys was monitored by AS-OCT examination. (D) t-Distributed stochastic neighbor embedding (t-SNE) plot of cell classes from macaque trabecular meshwork labeled by their marker genes. (E) Violin plot showing the expression of different marker genes in diverse cell types. (F) Distribution of the marker genes projected into t-SNE plot. (G) Coefficient of variation showing the correlation between each cell type and aging. (H) Volcano plot for differentially expressed genes (DEGs) of macaque trabecular meshwork, in which APOE was among the upregulated ones. (I) Genetic ontology (GO) enrichment analysis results for all cell types from macaque trabecular meshwork.
Figure 2.
Figure 2.
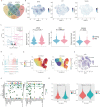
The heterogeneity of trabecular meshwork cell clusters in aging and young eyes. (A) Bar chart showing proportion changes of each cell type with aging, revealing that trabecular meshwork cells decreased significantly in older trabecular meshwork. (B) UMAP plot exhibiting clusters of trabecular meshwork cells distinguished by different markers (dots, individual cells; color, clusters). (C) GO analysis showing different pathways for each cluster performed in aging. (D) Distribution of clusters 0–12 in macaque samples of different ages is shown in pie chart. (E) Heatmap showing the difference of each cell cluster in trabecular meshwork cells, indicating some were enriched in the old group like cluster 0 while some others gathered more in the young group. (F) Coefficient of variation (CV) of TM Seurat clusters suggesting the significant role of cluster 0 in aging. (G) Co-varying neighborhood analysis showing cluster 0, 4, 10, 2, and 6 may exhibit aging tendency. (H) Distribution of the CCL26 in t-SNE plot. (I) Immunofluorescence staining of the cluster 0’s maker CCL26. (J) GO enrichment analysis for trabecular meshwork cells between the young and the old. Color of the dots indicates the significance of corresponding item and size of each dot represents the cell counts. (K) GO analysis of DEGs for cluster 0 showing the effect of collagen-containing extracellular matrix and cell migration in aging. (L) KEGG analysis showing the function of cluster 0.
Figure 3.
Figure 3.
Different molecular expression signatures of cluster 0 as well as macrophages with aging. (A) Venn diagram showing the overlapping gene between upregulated and downregulated DEGs within each dataset. UMAP for visualization of the distribution of three DEGs and corresponding expression levels in young and old respectively. (C) Volcano plot showing upregulated and downregulated genes of cluster 0 in young and aging trabecular meshwork. (D) Pseudotime of cluster 0 with the effect of APOE generated by Monocle 3 package of R software. Each dot represents a single cell. (E) The differentiation ability of each cluster analyzed by CytoTRACE, illustrating the cell living activities during different stages. (F) t-SNE plot showing the expression of APOE was significantly upregulated in aging trabecular meshworks and macrophages as well. (G) Cluster 0 was in connection with macrophages via CXCL signaling patterns. (H) Violin plot showing different M1 and M2 cell scores between young and aging samples.
Figure 4.
Figure 4.
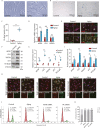
Aging increases the expression level of APOE, CLU, and VEGFA in TMCs. (A) Morphologic changes of trabecular meshwork cells (TMCs) after senescence induction. (B and C) SA-β-gal staining exhibits the increase of aging cells with H2O2. (D) QRT–PCR was used to detect the mRNA level of three DEGs. (E) Immunostaining of p21 and SA-β-gal in aging TMCs. Scale bars: 20 μm (left). (F) Western blot was performed to detect the protein levels of three DEGs, senescence markers, and β-actin. (G) Quantification of the relative expression level of proteins in (F). (H) Immunostaining of APOE, CLU, and VEGFA in normal and aging TMCs. Scale bars: 20 μm. (I) Quantification of relative fluorescence intensity in (E and H). (J) Flow cytometry was used to detect cell cycle of TMCs with different treatments. (K) Proportion of each cell cycle phase in TMCs at different stage. Data are presented as mean ± SEM values; *P < 0.05, **P < 0.01, ***P < 0.001, ****P < 0.0001; n = 3 (n = 5 for immunofluorescence).
Figure 5.
Figure 5.
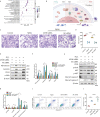
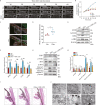
Knockdown of APOE partially rescues TMCs degeneration with aging. Functional enrichment analyses in biological process, cellular component, and molecular function of cluster 0. Schematic diagram illustrating possible mechanisms of APOE in trabecular meshwork degeneration with aging. TMCs were transfected with 50 nmol/L APOE siRNA or negative control (NC) siRNA for 24 h, followed by stimulation with H2O2 for 2 h and replacing fresh medium for more than 24 h. Transwell assay was used to investigate the migration ability of TMCs. (D) Quantification of cell migration in (C). (E) Western blot was performed to detect the protein levels of extracellular matrix (ECM) components including fibronectin, laminin, CD44, and α-SMA under different cell treatments. (F) Quantification of relative protein levels in (E). (G) Western blot was performed to detect the key molecular levels of PI3K-AKT pathway and the downstream caspase 3/9 under different cell treatments. (H) Quantification of relative protein levels in (G). (I) The apoptosis rate of TMCs in four groups was measured by flow cytometry. (J) Quantification of apoptotic proportion in all cells from (I). Data are presented as mean ± SEM values; *P < 0.05, **P < 0.01, ***P < 0.001; n = 3. ns: no significance.
Figure 6.
Figure 6.
Inhibition of APOE alleviates the dysfunction of trabecular meshwork by relieving apoptosis and ECM deposition in vivo. (A) Gd-MRI was used to estimate the outflow rate of aqueous humor (AH) among 3-month, 23-month, and COG 133 treated 23-month mice. (B) Curve chart of Gd signal of different time points. (C) immunofluorescence staining was performed to detect the protein levels of APOE in mice trabecular meshwork tissues. (D) Quantification of fluorescence intensity levels in (C). (E and G) A group of 23-month-old C57BL/6 mice were intraperitoneally injected with COG 133 TFA. Mice trabecular meshwork were obtained post-treatment. Western blot was performed to detect protein levels of ECM components as well as PI3K-AKT pathway and the downstream caspase 3/9 of mice trabecular meshwork tissues. (F and H) Quantification of relative protein levels in (F and H). (I) H&E staining was used to compare the cell number, ECM of trabecular meshwork, and the angle of anterior chamber. (J) Transmission electron microscopy (TEM) was used to observe the mitochondrial changes in mice trabecular meshwork. Scale bar for H&E staining: 20 μm. Data are presented as mean ± SEM values; *P < 0.05, **P < 0.01, ***P < 0.001, ****P < 0.0001; n = 5 for MRI and immunofluorescence. Referring to Western blot assays, n = 3.

Similar articles

References

    1. Adams CM, Stacy R, Rangaswamy N. et al. Glaucoma—next generation therapeutics: impossible to possible. Pharm Res 2018;36:25. - PubMed
    1. Angello JC, Pendergrass WR, Norwood TH. et al. Proliferative potential of human fibroblasts: an inverse dependence on cell size. J Cell Physiol 2005;132:125–130. - PubMed
    1. Beykin G, Norcia AM, Srinivasan VJ. et al. Discovery and clinical translation of novel glaucoma biomarkers. Prog Retin Eye Res 2021;80:100875. - PMC - PubMed
    1. Burton MJ, Ramke J, Marques AP. et al. The Lancet Global Health Commission on Global Eye Health: vision beyond 2020. Lancet Global Health 2021;9:e489–e551. - PMC - PubMed
    1. Chen Z, Sun J, Li M. et al. Effect of age on the morphologies of the human Schlemm’s canal and trabecular meshwork measured with swept‑source optical coherence tomography. Eye (London, England) 2018;32:1621–1628. - PMC - PubMed

Substances