. 2024 Jun;19(6):846-855.
doi: 10.1038/s41565-023-01585-y. Epub 2024 Feb 16.

Cellular uptake and in vivo distribution of mesenchymal-stem-cell-derived extracellular vesicles are protein corona dependent

Affiliations

Cellular uptake and in vivo distribution of mesenchymal-stem-cell-derived extracellular vesicles are protein corona dependent

Revadee Liam-Or et al. Nat Nanotechnol. 2024 Jun.

Abstract

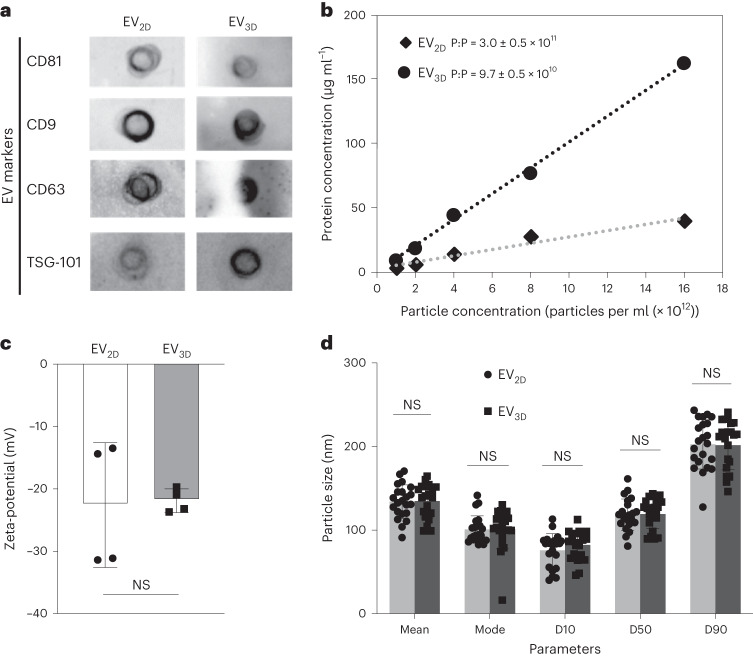
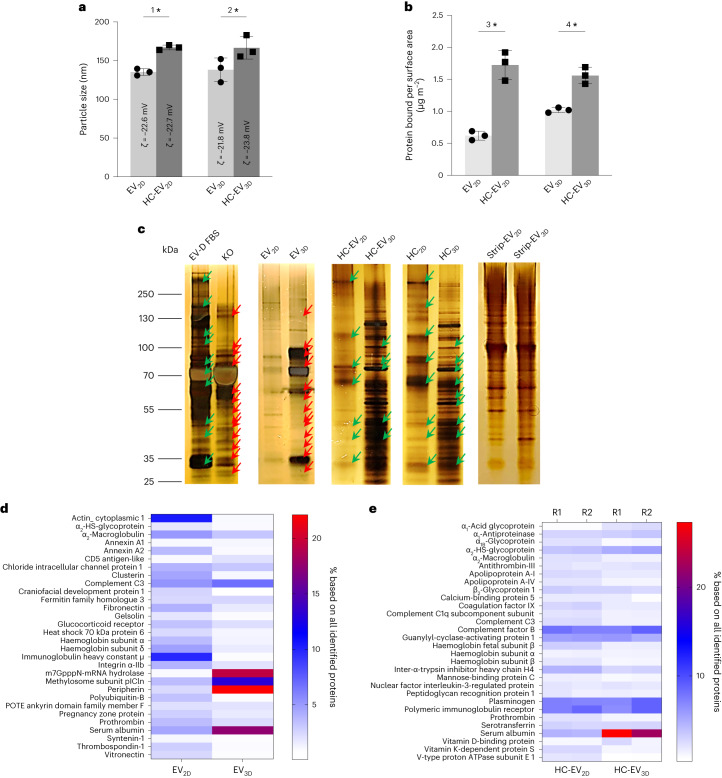
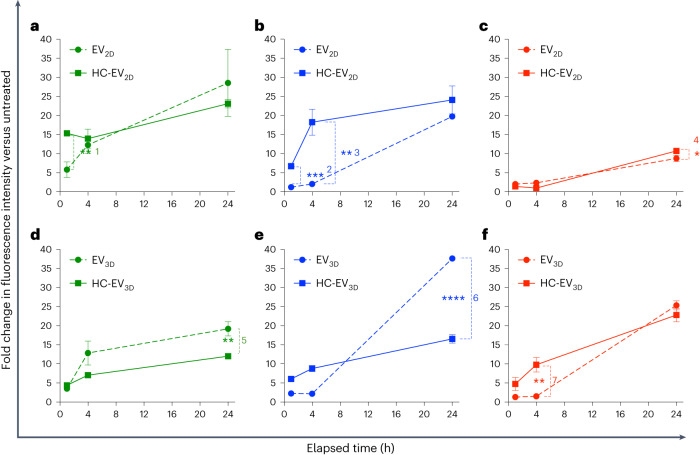
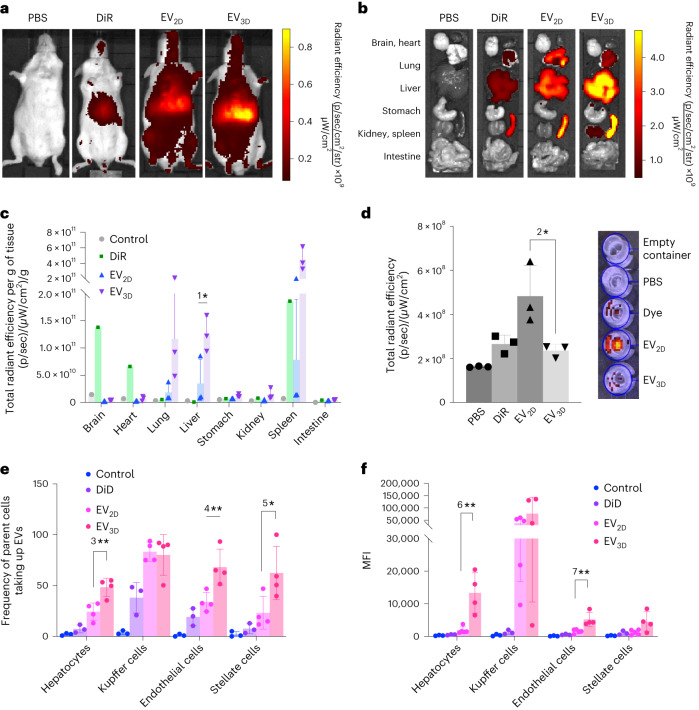
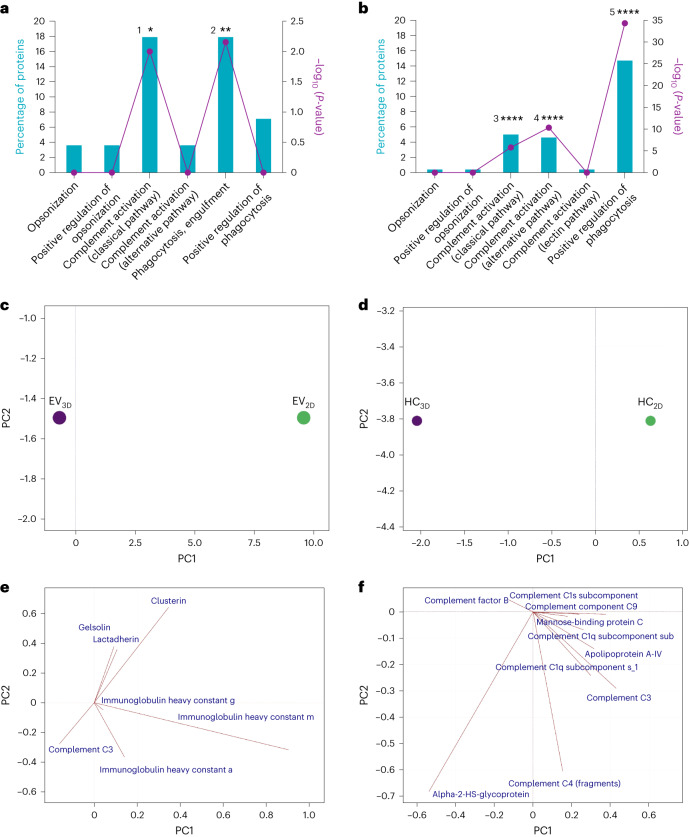
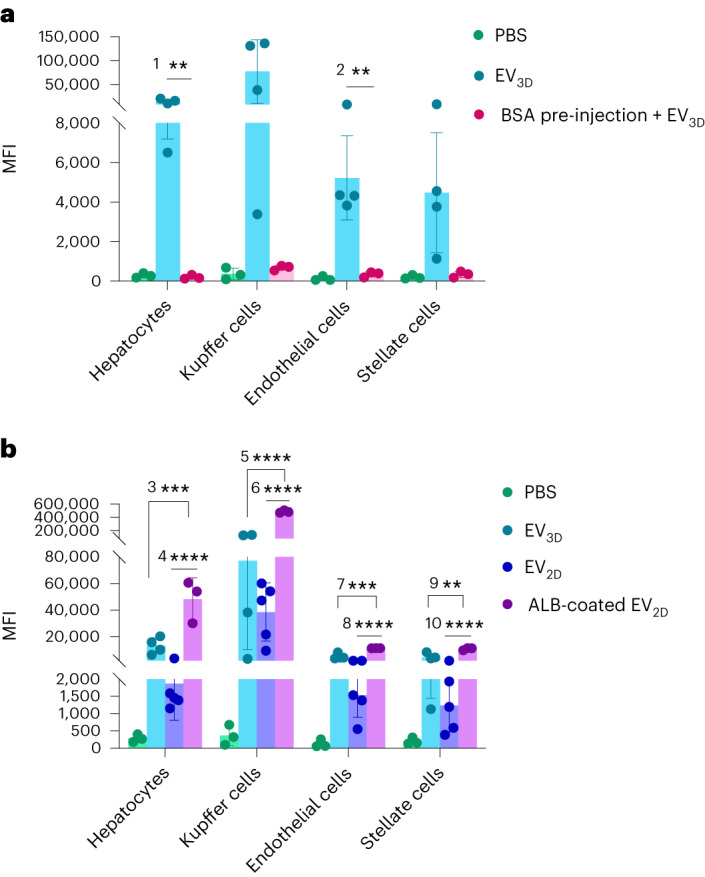
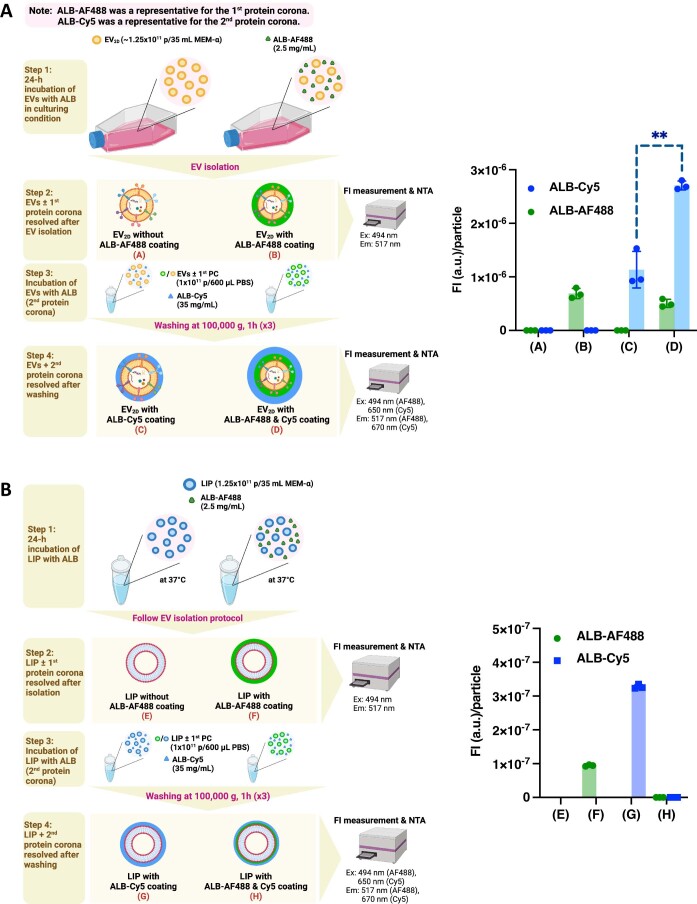
Extracellular vesicles (EVs) derived from mesenchymal stem cells are promising nanotherapeutics in liver diseases due to their regenerative and immunomodulatory properties. Nevertheless, a concern has been raised regarding the rapid clearance of exogenous EVs by phagocytic cells. Here we explore the impact of protein corona on EVs derived from two culturing conditions in which specific proteins acquired from media were simultaneously adsorbed on the EV surface. Additionally, by incubating EVs with serum, simulating protein corona formation upon systemic delivery, further resolved protein corona-EV complex patterns were investigated. Our findings reveal the potential influences of corona composition on EVs under in vitro conditions and their in vivo kinetics. Our data suggest that bound albumin creates an EV signature that can retarget EVs from hepatic macrophages. This results in markedly improved cellular uptake by hepatocytes, liver sinusoidal endothelial cells and hepatic stellate cells. This phenomenon can be applied as a camouflage strategy by precoating EVs with albumin to fabricate the albumin-enriched protein corona-EV complex, enhancing non-phagocytic uptake in the liver. This work addresses a critical challenge facing intravenously administered EVs for liver therapy by tailoring the protein corona-EV complex for liver cell targeting and immune evasion.


Conflict of interest statement

The authors declare no competing interests.

Figures

Fig. 1
Fig. 1. Physicochemical and biochemical characterization of EV2D and EV3D.
a, Expression of EV surface markers (CD81, CD9, CD63) and internal marker (TSG101) analysed by chemiluminescence dot-blot. Equal numbers of EVs (5 × 1010 particles per ml) were spotted on the nitrocellulose membrane prior to staining. b, Protein concentration measured by microBCA assay correlated with particle concentration measured by NTA (n = 5). c, Zeta-potential of EVs in deionized water (n = 4, biologically independent samples). Data are presented as mean ± s.d. d, Size of EVs in PBS measured by NTA (n = 22, biologically independent samples). Percentiles (D10, D50 and D90) determine particle size distribution. EV2D and EV3D exhibited comparable physicochemical and biochemical characteristics except for protein content (EV3D > EV2D). Data are presented as mean and mode ± s.d. Statistical analysis was performed by two-tailed unpaired t-test: NS, not significant, P > 0.05. Source data
Fig. 2
Fig. 2. Protein corona formation on EVs derived from different culturing conditions evaluated by NTA, microBCA assay, SDS–PAGE and LC–MS.
a, Size changes due to protein corona formation (n = 3; 1*P = 0.014, 2*P = 0.019). b, Protein bound per surface area of EVs measured by microBCA assay (n = 3; 3*P = 0.012, and *4P = 0.031). Data are presented as mean ± s.d. Statistical analysis is performed using two-tailed paired t-test (*P < 0.05). c, Representative silver-stained SDS–PAGE of EVs (n ≥ 2), HC-EV, HC and stripped EVs (strip-EV). EV-D FBS and KO are FBS incubation controls and culture media, respectively. Similarities and differences are depicted as green and red arrows, respectively. The results confirmed HC formation of both EV types although the compositions are qualitatively different. d,e, Quantitative LC–MS analysis of protein corona formation. The most abundant proteins in the non-FBS-incubated (d) and FBS-incubated (e) EVs identified by LC–MS against human protein and bovine protein databases, respectively, are displayed in the heatmap (R1 and R2 represent two biological replicates). Both EV3D and HC-EV3D, unlike their 2D counterpart, are rich in albumin. Values are expressed as percentage abundance of total protein amounts identified (n = 2, biological replicates with n = 3, technical replicates per sample). Source data
Fig. 3
Fig. 3. Cellular uptake of non-incubated EVs and HC-EVs in phagocytic and HepG2 cells.
a–f, Cellular uptake of EV2D ± HC (ac) and EV3D ± HC (df) in phagocytic J774 cells (a,d), human-monocyte-derived macrophages (Hu-Ø) (b,e) and HepG2, representing non-phagocytic liver hepatocytes (c,f). AF488-labelled EVs or HC-EVs were incubated with cells at a dose of 2 × 109 particles per well (24-well plate) for 1 h, 4 h and 24 h. Cellular uptake was measured by flow cytometry, and uptake was expressed as fold increase of the mean AF488 signal per cell (MFI) compared with non-treated cells. Doping of EVs with albumin-rich HC, that is, the case of EV3D, significantly reduces uptake in phagocytic cells while keeping uptake in HepG2 cells unchanged (1**P = 0.00417, 2***P = 0.00021, 3**P = 0.00243, 4*P = 0.04176, 5**P = 0.00871, 6****P = 0.00003, 7**P = 0.00522). Data are presented as mean ± s.d. (n = 3) with two-tailed unpaired t-test (*P < 0.05, **P < 0.01, ***P < 0.001, ****P < 0.0001). Source data
Fig. 4
Fig. 4. In vivo organ biodistribution and cellular uptake by liver subpopulations of EVs.
ad, Animals were intravenously injected with 2 × 1011 DiR-labelled EVs, PBS or the free dye (control): representative whole-body live (ventral) imaging (a), ex vivo images of whole major organs (b), semiquantitative analysis of the ex vivo images (n = 3 for EV samples, 1*P = 0.0464) (c) and urine clearance at 24 h post-injection (n = 3, 2*P = 0.0393) (d). Fluorescence intensity measured as total radiant efficiency per gramme of tissue was obtained by using an ROI tool and Living Image v.4.7.3 software. e,f, Cellular uptake of EVs by liver subpopulations (hepatocytes, Kupffer cells, endothelial cells and stellate cells) by flow cytometry shown as cell number positive for the signals (n ≥ 3, 3**P = 0.0032, 4**P = 0.0089 and 5*P = 0.0371) (e) or MFI (n ≥ 3, 6**P = 0.0014 and 7**P = 0.0033) (d). EV3D showed significantly higher uptake in hepatocytes, endothelial cells and stellate cells but not Kupffer cells. Data are presented as mean ± s.d. with two-tailed unpaired t-test (c,d) and one-way ANOVA with post hoc Tukey test (e,f) (*P < 0.05, **P < 0.01). Source data
Fig. 5
Fig. 5. GO analysis for classification of the protein identified by LC–MS.
a,b, Proteins detected in both EV3D/2D and HC2D/3D were decoded to obtain a gene list involved in biological processes contributing to the clearance of non-incubated EVs (against in-built UniProt human database, GO analysis with Bonferroni correction (1*P = 0.01 and 2**P = 0.007) (a) and hard protein corona of incubated EVs (against in-built UniProt non-human mammal (bovine) database, GO analysis with Bonferroni correction, 3****P = 1.6 × 10−6, 4****P = 4.97 × 10−11 and 5****P = 4.89 × 10−35) (b). c,d, GO analysis was performed using FunRich software v.3.1.3. Significantly enriched proteins (hypergeometric and Bonferroni analysis *P < 0.05, **P < 0.01 and ****P < 0.0001) by quantity underwent PCA for separation of EV2D and EV3D (c) and HC2D and HC3D (d), shown as score plots. e,f, Loading plots were used to illustrate how each protein influences the computed PCs in c,d, respectively. Overall, the intrinsic properties of EV protein corona constituents are fundamentally different. HC2D proteins are associated with higher extents of complement activation. The PCA was performed using mean of the LC–MS data (two biological and three technical replicates), and EVs were pooled from three batches. Source data
Fig. 6
Fig. 6. In vivo proof-of-concept studies confirming the effect of albumin receptor saturation or EV coating on liver cell internalization.
a, In vivo uptake of EV3D in liver cells is reduced/blocked when mice were injected with BSA (5 min pre-EV injection, 10 mg ml−1, 100 µl) followed by intravenous injection of DiD-labelled EV3D (2 × 1011 particles per mouse, n = 3, 1**P = 0.0091 and 2**P = 0.0063). b, In vivo uptake of albumin-coated DiD-labelled EV2D in liver cells after intravenous administration (2 × 1011 particles per mouse, n = 3, 3***P = 0.0004, 4****P < 0.0001, 5****P < 0.0001, 6****P < 0.0001, 7***P = 0.0001, 8****P < 0.0001, 9**P = 0.0018, 10****P < 0.0001). This confirms the involvement of albumin and albumin receptor in the cellular internalization of EVs. Data are presented as mean ± s.d. with one-way ANOVA with post hoc Tukey (*P < 0.05, **P < 0.01, ***P < 0.001 and ****P < 0.0001). Source data
Extended Data Fig. 1
Extended Data Fig. 1. In vitro study simulating formation of primary protein corona (1st corona) and secondary protein corona (2nd corona) on EVs and liposomes.
(a) EV2D and (b) Negatively charged liposomes (LIP, as representative of synthetic particles with lipid bilayers) were incubated firstly with albumin labelled with Alexa fluor 488 (ALB-AF488) (1st corona) then with albumin labelled with Cyanide 5 (ALB-Cy5) (2nd corona). Fluorescence was evaluated by a plate reader to determine the degree of albumin adsorption. Results confirmed that EV precoating with ALB (1st corona) induces deposition of more albumin (2nd corona) on EVs (**p = 0.0015). This is mimicking EVs interaction with blood when injected intravenously. In case of LIP, quenching was observed. Data are presented as mean ± SD (n = 3, biologically independent samples) with two-tailed unpaired t-Test analysis. The figure was created with BioRender.com. Source data

References

    1. Asrani SK, et al. Burden of liver diseases in the world. J. Hepatol. 2019;70:151–171. doi: 10.1016/j.jhep.2018.09.014. - DOI - PubMed
    1. Kwak KA, et al. Current perspectives regarding stem cell-based therapy for liver cirrhosis. Can. J. Gastroenterol. Hepatol. 2018;2018:4197857. doi: 10.1155/2018/4197857. - DOI - PMC - PubMed
    1. Guo Y, et al. Current status and future prospects of mesenchymal stem cell therapy for liver fibrosis. J. Zhejiang Univ. Sci. B. 2016;17:831–841. doi: 10.1631/jzus.B1600101. - DOI - PMC - PubMed
    1. Zagoura DS, et al. Therapeutic potential of a distinct population of human amniotic fluid mesenchymal stem cells and their secreted molecules in mice with acute hepatic failure. Gut. 2012;61:894–906. doi: 10.1136/gutjnl-2011-300908. - DOI - PubMed
    1. Li T, et al. Exosomes derived from human umbilical cord mesenchymal stem cells alleviate liver fibrosis. Stem Cells Dev. 2013;22:845–854. doi: 10.1089/scd.2012.0395. - DOI - PMC - PubMed