. 2024 Mar;21(3):521-530.
doi: 10.1038/s41592-024-02171-3. Epub 2024 Feb 16.

Multiscale biochemical mapping of the brain through deep-learning-enhanced high-throughput mass spectrometry

Affiliations

Multiscale biochemical mapping of the brain through deep-learning-enhanced high-throughput mass spectrometry

Yuxuan Richard Xie et al. Nat Methods. 2024 Mar.

Abstract

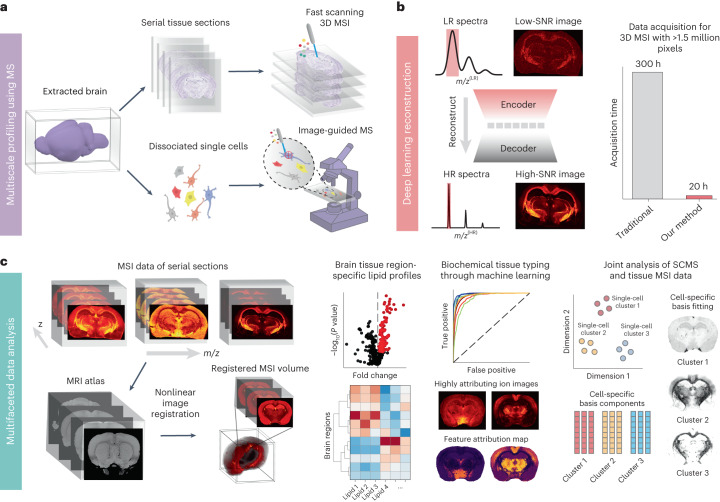
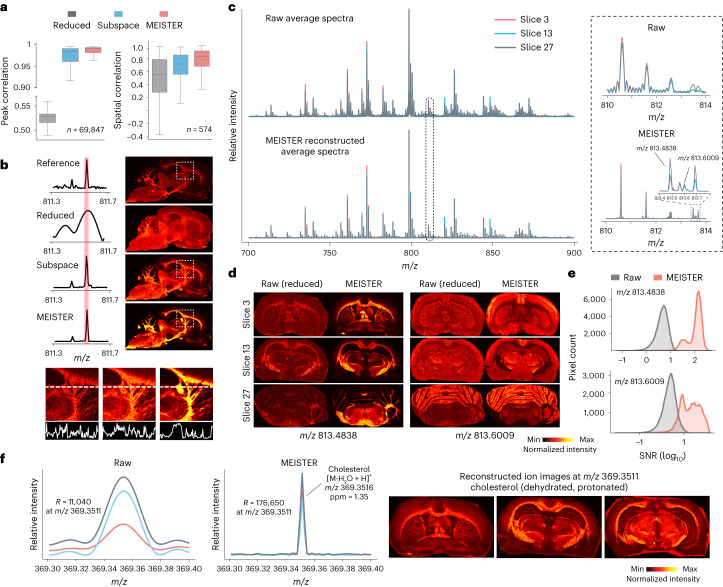
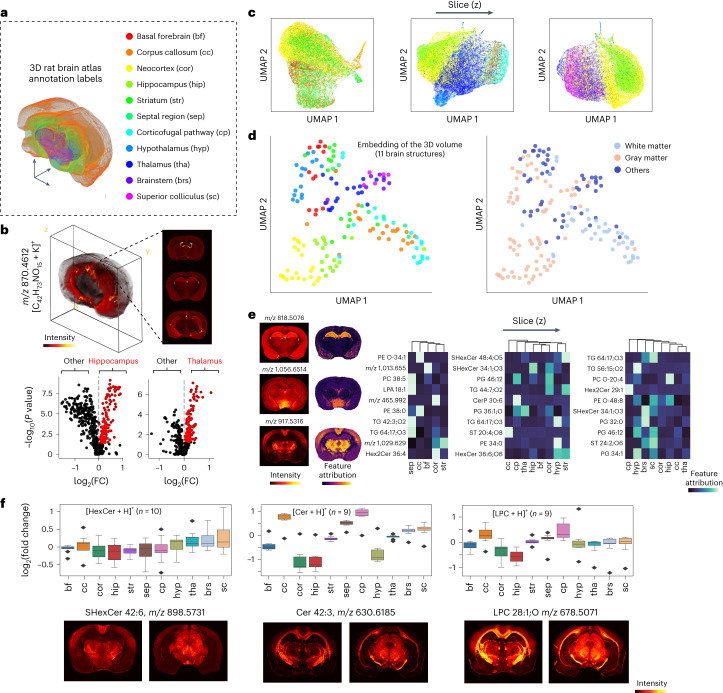
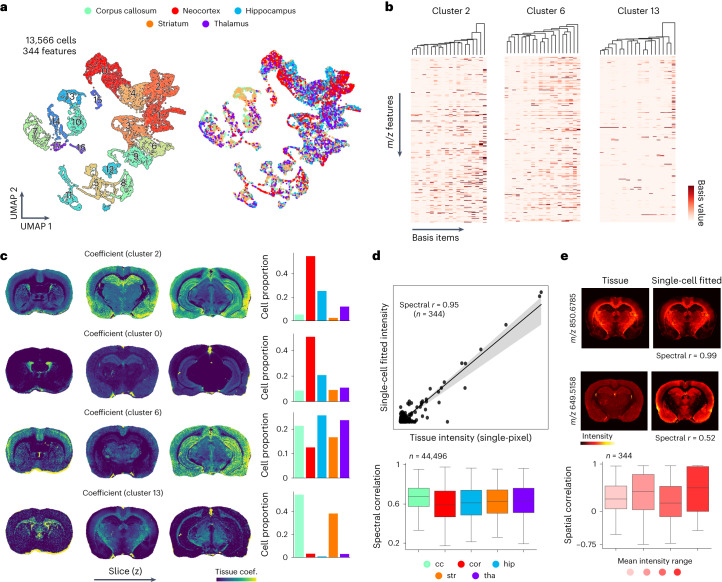
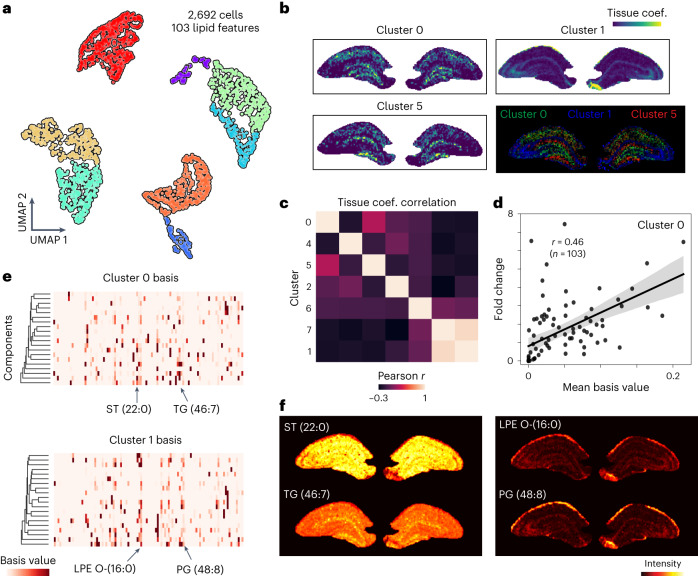
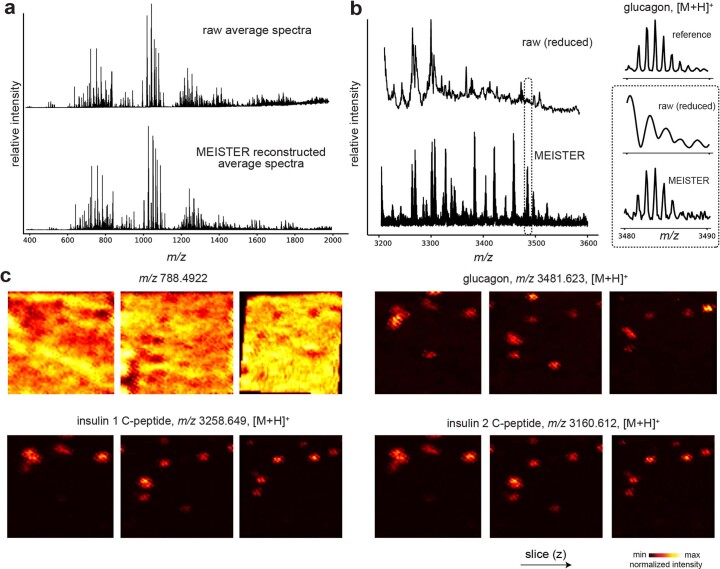
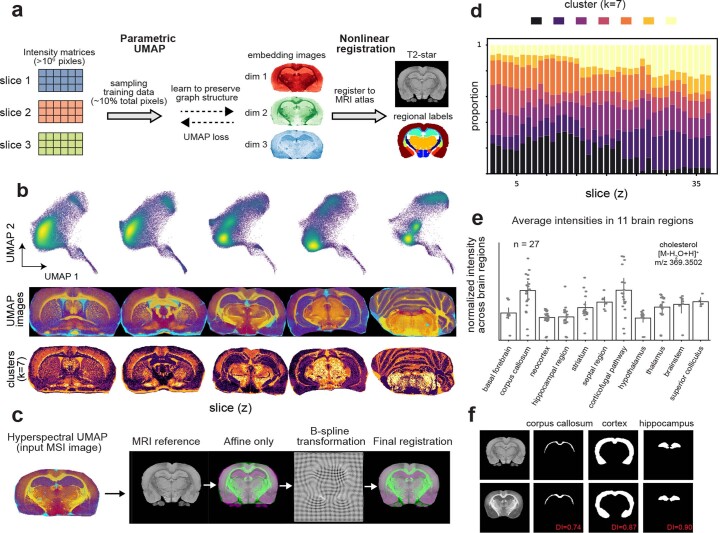
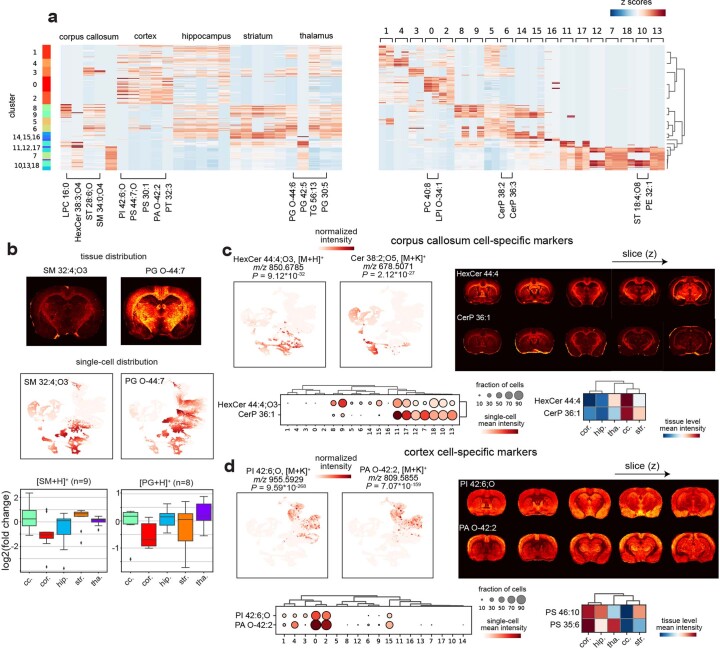
Spatial omics technologies can reveal the molecular intricacy of the brain. While mass spectrometry imaging (MSI) provides spatial localization of compounds, comprehensive biochemical profiling at a brain-wide scale in three dimensions by MSI with single-cell resolution has not been achieved. We demonstrate complementary brain-wide and single-cell biochemical mapping using MEISTER, an integrative experimental and computational mass spectrometry (MS) framework. Our framework integrates a deep-learning-based reconstruction that accelerates high-mass-resolving MS by 15-fold, multimodal registration creating three-dimensional (3D) molecular distributions and a data integration method fitting cell-specific mass spectra to 3D datasets. We imaged detailed lipid profiles in tissues with millions of pixels and in large single-cell populations acquired from the rat brain. We identified region-specific lipid contents and cell-specific localizations of lipids depending on both cell subpopulations and anatomical origins of the cells. Our workflow establishes a blueprint for future development of multiscale technologies for biochemical characterization of the brain.


Conflict of interest statement

The authors declare no competing interests.

Figures

Fig. 1
Fig. 1. The MEISTER framework for multiscale biochemical profiling using high-mass-resolution MS enhanced by computational methods.
a, Obtained from surgically extracted brain, serial tissue sections are imaged for 3D MSI using a fast acquisition strategy, and single-cell populations prepared by tissue dissociation are probed with high-throughput image-guided MS. b, A deep-learning model reconstructs high-mass-resolving and high-SNR MS data from the low-mass-resolution measurements acquired with fast acquisitions by exploiting a low-dimensional manifold structure for high-dimensional MS data, producing large datasets with millions of pixels, which was previously time-prohibitive with the conventional acquisition. LR, low resolution; HR, high resolution. c, Our multifaceted data analysis pipeline uses various data-driven methods for multimodal image registration to align MSI with 3D anatomical MRI for volumetric reconstruction, identifying differential lipid distributions, tissue typing using MS data and integrating MSI and SCMS data for joint analysis and resolving cell-type-specific contributions at the tissue level across the brain.
Fig. 2
Fig. 2. High-throughput MSI using MEISTER.
a, Correlation measures of mass spectra produced by different reconstruction methods; the case ‘reduced’ stands for a standard FT reconstruction from short transients (reduced data); the test data contain n = 69,847 pixels and n = 574 ion images for peak and spatial correlation, respectively. Data in boxplots are shown as median values (center) with the interquartile range (box), and the whiskers extend to 1.5 times the interquartile range. b, Comparisons of mass spectra and corresponding ion images to the reference (full transient; top row) show enhanced signal strength with MEISTER. The bottom row depicts line profiles of signal intensities in reference, subspace and MEISTER images. c, Averaged mass spectra from three different tissue sections for the reduced data (top) and our reconstruction (bottom). The inlet displays a small m/z window of the mass spectra, demonstrating mass-resolution (R) enhancement. d, Ion images obtained from raw MSI data (left) and our reconstruction (right) at m/z 813.4838 and m/z 813.6009. e, Reconstruction improved SNRs as shown in SNR distributions for signals at m/z 813.4838 (top, 100-fold higher) and at m/z 813.6009 (bottom, tenfold higher) compared to raw data. f, Raw and reconstructed mass spectra zoomed into the cholesterol range (left columns) and corresponding ion images showing tissue localization of cholesterol (right columns).
Fig. 3
Fig. 3. Differential lipid profiles across 11 brain structures revealed by high-resolution 3D MSI.
a, Atlas annotations colored for 11 brain structures with abbreviations. b, Top, the 3D volumetric reconstruction of a representative lipid ion enabled by our reconstruction and analysis methods. Bottom, volcano plots showing differential lipid distributions in hippocampus (left) and thalamus (right). Red dots indicate significantly different lipid features for the brain regions. P-values were determined by Wilcoxon rank-sum test (two-sided) and adjusted by Benjamini–Hochberg procedure. FC, fold change. c, Low-dimensional UMAP embeddings of the pixel-wise lipid profiles across different brain serial sections, revealing region-specific lipid distributions across a tissue volume. d, UMAP analysis of the average lipid profiles from different structures across the entire 3D volume (each dot represents a region in one tissue section). e, Interpreting the machine learning model trained to classify brain regions using lipid profiles reveals attribution of lipids most discriminative for specific brain structures. Examples of top predictive lipid features show distinct spatial distributions and feature attribution maps across the brain (left). f, Top, regional distributions of myelination-related lipids (HexCer, Cer and LPC) annotated by protonated ion and quantified by log2 fold change. Bottom, representative ion images corresponding to the lipids described in the plots on top. n is the number of lipid features for each lipid class. Data in boxplots are shown as median values (center) with the interquartile range (box), and the whiskers extend to 1.5 times the interquartile range.
Fig. 4
Fig. 4. Joint visualization and analysis of tissue MSI and SCMS data.
a, A total of 13,566 cells with 344 cross-annotated lipid features were subjected to UMAP and clustering analysis. As a result, 18 cell clusters were identified (left) with each cluster containing cells dissociated from different brain regions (right; annotated on the top). b, Cell-specific chemical dictionaries (lipids) can be extracted, for example, from clusters 2, 6 and 13 shown here (20 basis elements were obtained in each dictionary). ce, Results of our proposed UoSS fitting mapping cell-type-specific dictionaries (obtained from SCMS data) to the tissue MSI data. c, Estimated spatially dependent contributions of different cell clusters across the brain (UoSS coefficients for the cell-type-specific dictionaries). Distinct cell compositions can be resolved for different regions. Each row shows results for mapping contributions of one cell cluster to individual pixels in different tissue sections (left three columns), and the percentage compositions of regional cell populations (where they are from; right column) for each cluster. coef., coefficient. d, Signal intensities from tissue pixels (n = 44,496 pixels) obtained with tissue MSI are well correlated with the model fitted values (mean correlation coefficients > 0.6 for all regions, bottom box plot). The shaded band (top scatter plot) is the 95% confidence interval for the linear fit. Data in boxplots are shown as median values (center) with the interquartile range (box), and the whiskers extend to 1.5 times the interquartile range. e, The top four images illustrate lipids with excellent and moderate consistency between the actual tissue images and the single-cell-dictionary fit. The consistency was evaluated for lipid features (n = 344) by spatial correlation across different mean signal intensity ranges. Lipids at high mean intensity have slightly better fitting results than ones at lower intensity (lower boxplots). In total, 101 (of the total 344) lipid features have negative spatial correlation, a result of less accurate fit. Brain region abbreviations: cc, corpus callosum; cor, cortex; hip, hippocampus; str, striatum; tha, thalamus.
Fig. 5
Fig. 5. Integrative analysis of hippocampal tissue MSI and single-cell data.
a, A total of 2,692 hippocampal cells were probed and data were subjected to UMAP and clustering analysis, producing eight chemically unique single-cell clusters in terms of lipid profiles. b, Maps of resolved cell type contributions from fitting the cell-specific chemical dictionaries to tissue data. c, Correlation matrix for weights obtained from eight clusters. d, Basis values averaged on 20 dictionary items versus fold change for lipid features in cluster 0. The shaded band is the 95% confidence interval for the linear fit between basis values and fold change. e, Chemical dictionaries extracted for cluster 0 and cluster 1, with arrows indicating dominant cluster-specific lipid features. f, Ion images showing the distributions of lipids that are more cluster-specific within the hippocampal region. Sterol (ST) (22:0) and triglyceride (TG) (46:7) were selected on the basis of cluster 0 basis values, whereas LPE O-(16:0) and PG (48:8) were determined on the basis of cluster 1 basis values.
Extended Data Fig. 1
Extended Data Fig. 1. MEISTER model design.
a, MEISTER reconstruction model that contains an autoencoder to learn latent features from high-resolution signals, and a regressor network that maps low-resolution signals to encoded latent features. MEISTER training workflow for b, 3D MSI using high-mass resolution data acquired on a small number of tissue sections, and c, SCMS using high-mass resolution data acquired on a subset of individual cells.
Extended Data Fig. 2
Extended Data Fig. 2. Evaluating model performance on simulated and experimental MSI data.
Comparisons of a, mass spectra from the simulated MSI data. b, ion images extracted from several m/z features, showing enhanced spectral and image quality enabled by MEISTER reconstruction. c, Correlation coefficient and error distributions by evaluating mass spectra and ion images against the ground truth. the simulation data contain n = 26497 pixels and n = 152 ion images for peak and spatial correlation respectively. Data in boxplots are shown as median values (center) with the interquartile range (box), and the whiskers extend to 1.5 times the interquartile range. d, UMAP embeddings of encoded features of the simulated high-resolution data and the features of reconstruction from low-resolution data. Colors indicate different pseudo-tissue regions. e, K-means clustering for the experimental reference, subspace reconstruction, and MEISTER reconstruction. f, Pearson correlation coefficients between top-5 PCs extracted from the experimental reference versus from the data reconstructed by subspace (top) and MEISTER (bottom). g. Comparison of number of annotated lipids (top) and correlation of ion images (bottom) using METASPACE with FDR set to 20%.
Extended Data Fig. 3
Extended Data Fig. 3. Reconstructing image-guided SCMS data.
a, Experimental high-resolution single-cell mass spectra versus MEISTER reconstructed mass spectra. High peak correlation scores were obtained on 1000 validation cells (bottom box plot). b, Downstream analysis of the reference (full transients) and reconstructed data shows nearly identical clustering patterns through k-means (k = 4; 1-4 denote cluster numbers and each cluster of cells are coded with a different color) and ion distributions at the single-cell level. c, Peak correlation scores for cells sampled from five different brain regions. Data in boxplots are shown as median values (center) with the interquartile range (box), and the whiskers extend to 1.5 times the interquartile range.
Extended Data Fig. 4
Extended Data Fig. 4. Acquisition and reconstruction of 3D MSI data of rat coronal sections using MEISTER.
a, Number of pixels versus the slice order for the 3D rat coronal data set. b, Average mass spectra for 37 coronal sections obtained from MEISTER reconstruction. c, Comparison of the raw (reduced) and reconstructed mass spectra (left) in a small m/z window, and representative ion images (right). d. Distribution of ppm mass errors of 728 matched lipid features (left) and comparisons of mass spectra and mass resolution for several common brain lipids (right).
Extended Data Fig. 5
Extended Data Fig. 5. Generalizability to imaging peptides in rat pancreas.
a,b, Averaged mass spectra of rat pancreas tissue sections from the reduced data (top) and our reconstruction (bottom) for m/z range of 400 to 2000 (a; lipids) and 3200 to 3600 (b; peptides). Inlet displays a zoomed-in m/z window with signals of protonated glucagon for high-resolution reference (top), reduced (middle) and reconstructed (bottom) data. High-fidelity reconstruction by the proposed method w.r.t. the reference can be observed. c, Ion images of different sections obtained from deep learning reconstructed tissue MSI data for m/z 788.4922, glucagon, insulin 1 C-peptide, and insulin 2 C-peptide.
Extended Data Fig. 6
Extended Data Fig. 6. Data-driven registration to align 3D MSI and anatomical atlas.
a, The proposed workflow leveraging pixel-wise parametric UMAP to efficiently align MSI data from serial tissue sections to a 3D MRI volume. b, Across serial sections in z-axis, parametric UMAP embeddings (top, colored by point density) formed consistent and structurally informative feature images (middle) and k-means clusters (bottom), c, Nonlinear image registration aligning the hyperspectral UMAP image to the target MR image via sequential affine and B-spline registration. The combination produced excellent alignment and enabled coherent volumetric reconstruction of MSI sections. d, The cluster proportions for 7 clusters varying with the slice order. e, Differential signal intensity distributions for lipids across 11 brain anatomical structures (for n = 27 tissue sections) identified using the ROI labels from a rat MRI atlas, that is, cholesterol shown here with distinct regional differences. The bars indicate the mean value intensity values, and the error bars indicate the 95 percent confidence intervals of the intensity distributions. f, Anatomical masks from the atlas (top) and manual annotations of MSI post registration (bottom). Dice Indices are shown in red indicating good alignment.
Extended Data Fig. 7
Extended Data Fig. 7. Identification of brain region-specific lipid features at the single-cell level.
a, Top five single-cell lipid features identified to be brain-region specific (left), and top two lipid features identified to be cluster-specific (right). Lipid features were selected based on p-values and log2 of fold change obtained by differential analysis. Rows and columns correspond to cells organized by the clusters and lipid features organized by regions respectively. Region and cluster specific lipids can be identified. For instance, PI 42:6;O is significantly elevated (adj. p-value = 9.6*10-268) in cells from cortex. Inspecting the PI 42:6;O column in the heatmap, we can observe that most cells in cluster 0, 2, 3, 4 contain this particular lipid. b, Tissue and single-cell distributions of lipid markers identified by region-specific lipid analysis, demonstrated by data of two representative lipids, SM (32:4);O3 and PG O-(44:7). Bottom: regional distributions of SM and PG signal intensities quantified by log2 of fold change at the single-cell level. n is the number of lipid features for each lipid classes. Data in boxplots are shown as median values (center) with the interquartile range (box), and the whiskers extend to 1.5 times the interquartile range. c, d, Highly-specific lipid markers (significance indicated by p-values) were identified for different brain regions, showing agreement between single-cell and tissue imaging data for c, corpus callosum and d, cortex regions. For c, d, top left: single-cell UMAP, top right: corresponding ion images, bottom left: relations between clusters, mean signal intensity for single cells in cluster, and size of cell fraction per cluster, bottom right: relation between mean of signal intensities, brain locations of collected signals. p-values were tested by Wilcoxon rank-sum (two-sided) and adjusted by Benjamini-Hochberg procedure.
Extended Data Fig. 8
Extended Data Fig. 8. Integrative analysis of MSI and SCMS data from rat pancreas.
a, A total of 13,739 cells from rat pancreas with 428 cross-annotated features (tissue and single cells) are subjected to UMAP and Leiden clustering analysis. 10 cell clusters were identified (left), which can also be mapped to three major pancreatic cell types (right). Inlet shows the distributions of insulin 1 and 2 C-peptides within single cells. b, Top two features identified to be cluster-specific across all clusters. c, Cell-cluster-specific dictionaries extracted from representative cluster 0, 2, 4, and 8. d, Estimated spatial contributions of individual cell clusters across pancreas tissue. Each row shows results of mapping the contributions of one cluster to individual pixels, revealing distinct spatial organizations of islet, vasculature, and acinar cells.

Update of

Similar articles

Cited by

References

    1. Hawrylycz MJ, et al. An anatomically comprehensive atlas of the adult human brain transcriptome. Nature. 2012;489:391–399. doi: 10.1038/nature11405. - DOI - PMC - PubMed
    1. Darmanis S, et al. A survey of human brain transcriptome diversity at the single cell level. Proc. Natl Acad. Sci. USA. 2015;112:7285–7290. doi: 10.1073/pnas.1507125112. - DOI - PMC - PubMed
    1. Rao A, Barkley D, França GS, Yanai I. Exploring tissue architecture using spatial transcriptomics. Nature. 2021;596:211–220. doi: 10.1038/s41586-021-03634-9. - DOI - PMC - PubMed
    1. Tsui-Pierchala BA, Encinas M, Milbrandt J, Johnson EM. Lipid rafts in neuronal signaling and function. Trends Neurosci. 2002;25:412–417. doi: 10.1016/S0166-2236(02)02215-4. - DOI - PubMed
    1. Allaman I, Bélanger M, Magistretti PJ. Astrocyte–neuron metabolic relationships: for better and for worse. Trends Neurosci. 2011;34:76–87. doi: 10.1016/j.tins.2010.12.001. - DOI - PubMed