. 2024 Mar;25(3):1469-1489.
doi: 10.1038/s44319-024-00089-7. Epub 2024 Feb 16.

Tumor acidosis-induced DNA damage response and tetraploidy enhance sensitivity to ATM and ATR inhibitors

Affiliations

Tumor acidosis-induced DNA damage response and tetraploidy enhance sensitivity to ATM and ATR inhibitors

Léo Aubert et al. EMBO Rep. 2024 Mar.

Abstract

Tumor acidosis is associated with increased invasiveness and drug resistance. Here, we take an unbiased approach to identify vulnerabilities of acid-exposed cancer cells by combining pH-dependent flow cytometry cell sorting from 3D colorectal tumor spheroids and transcriptomic profiling. Besides metabolic rewiring, we identify an increase in tetraploid cell frequency and DNA damage response as consistent hallmarks of acid-exposed cancer cells, supported by the activation of ATM and ATR signaling pathways. We find that regardless of the cell replication error status, both ATM and ATR inhibitors exert preferential growth inhibitory effects on acid-exposed cancer cells. The efficacy of a combination of these drugs with 5-FU is further documented in 3D spheroids as well as in patient-derived colorectal tumor organoids. These data position tumor acidosis as a revelator of the therapeutic potential of DNA repair blockers and as an attractive clinical biomarker to predict the response to a combination with chemotherapy.

Keywords: 3D Spheroids; ATM; DNA Damage Response; Organoids; Tumor Acidosis.


Conflict of interest statement

The authors declare no competing interests.

Figures

Figure 1
Figure 1. pHLIP-based sorting of acid-exposed cancer cells from 3D tumor spheroids and transcriptomic validation.
(A) Diagram depicting the molecular mechanism for spontaneous folding and insertion of the pH (low) insertion peptide (pHLIP) into the cell membrane of acid-exposed cancer cells. (B) Labeling of a 3D HCT116 spheroid equatorial section with either pH-dependent Alexa 568 pHLIP or pH-independent Alexa 594 K-pHLIP (negative control). Scale bars = 100 µm. (C) Schematic representation of the Fluorescence-activated cell sorting (FACS) approach used to isolate pHLIP-positive, K-pHLIP-negative acid-exposed cancer cells (vs. pHLIP-negative non-acid cancer cells) from 3D spheroids. (D) FACS density plots depicting Alexa 568 pHLIP vs. Alexa 594 K-pHLIP fluorescence intensity for unlabeled (left side) and double-labeled (right side) cells sorted from 3D HCT116 spheroid. (E) Volcano plot of differentially expressed protein-coding genes between isolated acid-exposed and non-acid HCT116 cancer cell populations. Shaded areas represent the cutoff range of negative log10 (P value) vs. Log2 fold change [FC] (acid/non-acid). Log2 FC (acid/non-acid) above 1 or below −1 (i.e., twofold changes) and P values  ≤  0.05 were considered as significantly upregulated (red) or downregulated (blue), respectively. (F) GSEA plots showing enrichment in hallmark gene sets of oxidative phosphorylation, fatty acid metabolism and reactive oxygen species pathway in acid-exposed vs. non-acid cells. Data information: (B) quantification data (bar graph, below) are presented as means ± SD of n = 3 independent biological replicates. (E, F) Data are represented as mean of n = 3 independent biological replicates and P values were calculated by DESeq2 with Benjamini–Hochberg multiple test correction (E). GSEA normalized enrichment scores (NES) and P values are indicated in (F). Source data are available online for this figure.
Figure 2
Figure 2. Acid-exposed cancer cells in 3D tumor spheroids exhibit a DNA damage response (DDR) signature and enrichment in genes related to G2/M checkpoint.
(A, B) Bar chart (A) and network plot (B) of the top-20 most significant Metascape-annotated functional clusters enrichment correlating with differentially expressed protein-coding genes from the transcriptome of acid-exposed cancer cells isolated from 3D spheroids. (B) Each circle node represents a distinct pathway annotation colored according to its Metascape-identified cluster and with a size proportional to the number of pathway-associated genes. The thickness of the purple edges indicates the number of common genes between various pathway annotations. (C, D) PGSEA (C) and GSEA (D) analyses using WikiPathways and Hallmark databases, respectively, revealed a propensity of transcripts of acid-exposed cancer cells to positive enrichment in DDR-related pathways. (E) Protein–protein interactions (PPI) network analysis of the DE protein-coding genes in acid-exposed cancer cells using the Metascape MCODE algorithm to identify neighborhoods where proteins are densely connected. Each MCODE network corresponds to the most significant enriched pathway annotation and is assigned a unique color. (F) GSEA analysis revealed that HALLMARK_G2M_CHECKPOINT gene set is positively enriched in acid-exposed cancer cells. Data information: (A, B) significance was determined using multi-test adjusted P values (q value) in negative log10 (Q < 0.05). GSEA normalized enrichment scores (NES) and P values were used in (D, F).
Figure 3
Figure 3. Acid-exposed cancer cells accumulate in G2/M cycle phase and activate ATM/ATR pathways.
(A) Flow cytometry analysis of DNA content was used to determine the cell cycle distribution of HCT116 cells cultured at pH 6.5 vs. pH 7.4. Representative cell cycle analysis (A, left panels) and quantification (A, right bar graph) are shown. (B) Proportion of tetraploid HCT116 cancer cells determined as described in Fig. EV3A from cells cultured at pH 6.5 or 7.4. (C, D) Heatmap of relative expression of genes (Log2 FC (acid/non-acid) >|0.5| and P < 0.05) that are involved either in (C) ATM pathway (WP2516) or (D) ATR pathway (WP4016). Data information: (A, B) quantification data are presented as means ± SD of n = 3 independent biological replicates. The relative proportion of HCT116 cells in G1, S, and G2/M phases was determined using the Dean–Jett–Fox algorithm in (A). Statistical analysis was performed using an unpaired two-tailed Student’s t test (*P < 0.05) in (B). (C, D) Data are representative of n = 3 independent biological replicates. Each column represents relative expression values in independent biological replicates. Source data are available online for this figure.
Figure 4
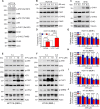
Figure 4. Acid-exposed cancer cells activate ATM, ATR, and CHK1/2 kinases mimicking the response to chemotherapy.
HCT116, HT-29 and SiHa cancer cells were chronically adapted at pH 6.5 or maintained at pH 7.4 (A, C, D) or native HCT116 cells were acutely exposed to acidic pHe (B) or treated with 5-FU at the indicated doses to be compared with cancer cells adapted at pH 6.5 (E, F). (AC) Representative immunoblots of total and phosphorylated ATM, ATR, CHK1, CHK2. Actin or tubulin was used as loading control, as indicated. (D) Bar graph showing the proportion of tetraploid cells. (E, F) Representative immunoblots of total and phosphorylated ATM, ATR, CHK1, CHK2. Actin was used as loading control, as indicated. (GJ) Cell viability assays in HCT116 (G, I) and HT-29 cancer cells (H, J) cultured at pH 7.4 or 6.5, and treated with the indicated doses of ATMi AZD0156 (G, H) or ATRi elimusertib (I, J) for 72 h. Data information: (AJ) data represent n  =  3 independent biological replicates. (D, GJ) Bar graphs represent means ± SD with three biological replicates (D) or six technical replicates (GJ), and significance was determined using two-way ANOVA with Tukey’s multiple-comparison analysis (ns non-significant; *P < 0.05; **P < 0.01; ***P < 0.001; ****P < 0.0001). Source data are available online for this figure.
Figure 5
Figure 5. Growth inhibitory effects of a combination of 5-FU with ATMi or ATRi on 3D tumor spheroids.
(AD) 3D cell viability assay in 3D HCT116 (A, B, left bar graphs) and HT-29 spheroids (C, D, left bar graphs) treated with the indicated doses of 5-FU combined with logarithmic dilutions of ATMi AZD0156 (A, C) or ATRi gartisertib (B, D) for 72 h. 2D synergy landscapes for serial dilutions of 5-FU and ATMi or ATRi are depicted (AD, right panels). Data information: (AD) bar graphs represent means ± SEM (3–12 technical replicates, n = 3 independent biological replicates). Statistical evaluation of drug combination effect was calculated using the Bliss independence dose-response model. Bliss synergy scores (± SD) and color legend are indicated. Source data are available online for this figure.
Figure EV1
Figure EV1. Sorting of pHLIP-positive and K-pHLIP-positive cancer cells from 3D tumor spheroids and visualization of global transcriptome changes.
(A, B) Dot plots of DAPI signal vs. Alexa 568 pHLIP (A) and Alexa 594 K-pHLIP (B) fluorescence intensities in cells sorted from 3D HCT116 spheroid. (C) PCA plot for the acid vs. non-acid-independent biological replicates (n = 3) of the 15,600 identified genes (TPM > 0.5). (D) MA-plot of the global transcriptome changes associated with acidic pHe value. Upregulated (red) or downregulated (blue) genes are shown (Log2 FC (acid/non-acid) > |1 | ). (E) Donut-plots showing the proportion of total expressed genes (left side) and protein-coding genes (right side) upregulated (red) or downregulated (blue) in acid-exposed cancers cells (TPM > 0.5; P value  ≤  0.05). Data information: Data are representative of n  =  3 independent biological replicates. (E) P values filtering was determined from statistics in Fig. 1E.
Figure EV2
Figure EV2. DDR signature in acid-exposed cancer cells isolated from 3D tumor spheroids.
(A, B) Network analysis of Metascape-annotated functional clusters for (top-20) DE protein-coding genes upregulated or downregulated in acid-exposed cancer cells isolated from 3D spheroids. Each circle node represents a distinct pathway annotation. The thickness of the purple edges indicates the number of common genes between various pathway annotations. (A) Significance is indicated by the darkness of the node’s color while in (B), red (upregulated) or blue (downregulated) color indicates the number of enriched genes in that pathway annotation. (C, D) Bar charts depicting the most significant Gene Ontology (GO): Cellular Component (CC) terms (C) and Reactome pathway (D) enrichment correlating with transcripts upregulated in acid-exposed cancer cells (Q < 0.05). (E) PGSEA analysis using Pathway Interaction Database (PID) revealed that many DDR-related gene sets are positively enriched in acid-exposed cancer cells. (F) Heatmap of relative expression of genes filtered with Log2 FC (acid/non-acid) > |0.5| and P < 0.05, that are involved in DNA repair (GO0006281). (G) PPI network analysis of the DE protein-coding genes in acid-exposed cancer cells using the Metascape MCODE algorithm to identify neighborhoods where proteins are densely connected. MCODE network nodes are displayed in red or blue color to represent upregulated or downregulated DEGs in the transcriptome of acid-exposed cancer cells, respectively. Data information: data are representative of n  =  3 independent biological replicates. (F) P values filtering was determined from statistics in Fig. 1E. Each column represents relative expression values in independent biological replicates.
Figure EV3
Figure EV3. Acid-exposed cancer cells accumulate as tetraploid cells.
(A, B) Representative propidium iodide (PI) signal vs. forward scatter (FSC) plots of flow cytometry analysis of HCT116 (A) or HT-29 (B) cells cultured at pH 6.5 (right panels) vs. pH 7.4 (left panels). Note that the areas of interest on the PI vs. FSC charts were established in cells at pH 7.4 (A, B, left panels) and do not intersect for diploid G2/M and tetraploid G1 cells; fluorescence intensity of PI may indeed fluctuate based on DNA packing according to the cell cycle phase. (C) Flow cytometry analysis of DNA content was used to determine cell cycle distribution of HT-29 cells cultured at pH 6.5 vs. pH 7.4. Representative HT-29 cell cycle analysis (C, left panels) and quantification (C, right bar graph) are shown. (D) Proportion of tetraploid HT-29 cancer cells determined as described in (B) from cells cultured at pH 6.5 or 7.4. (CE) Representative PI signal vs. FSC plots of flow cytometry analysis from n = 30 independent dissociated HT-29 spheroids with size > 500 µm (right panel) vs. < 300 µm (left panel). Data information: data are representative of n  =  3 independent biological replicates. (C, D) Quantification data are presented as means ± SD of n = 3 independent biological replicates. The relative proportion of HT-29 cells in G1, S and G2/M phases was determined using the Watson algorithm in (C). Statistical analysis was performed using an unpaired two-tailed Student’s t test (**P < 0.01) in (D).
Figure EV4
Figure EV4. The proportion of G2/M arrested acid-exposed cancer cells is not influenced by 5-FU exposure and growth of acid-exposed cancer cells is inhibited either by single ATMi KU60019 or combination of 5-FU with ATMi or ATRi.
(A) Flow cytometry analysis of DNA content was used to determine cell cycle distribution of HCT116 cultured at pH 6.5 vs. pH 7.4 and exposed (or not) to 1 µM 5-FU. Representative cell cycle analysis plots (left panels), and quantification (right bar graph) are shown. (BG) Cell viability assays in HCT116 (B, D, E) and HT-29 (C, F, G) cancer cells cultured at pH 7.4 or 6.5, and treated with the indicated dose of ATMi KU60019 (B, C), or 100 µM 5-FU alone or in combination with 1 µM ATMi AZD0156 or 0.1 µM ATRi Elimusertib (DG) for 72 h. Data information: (A) The relative proportion of cells in G1, S and G2/M phases was determined using the Dean–Jett–Fox algorithm. Data are represented as means ± SD of n = 3 independent biological replicates. For panels (B–G) bar graphs represent means ± SD (six technical replicates, n = 3 independent biological replicates) and significance was determined using two-way ANOVA (B, C) or one-way ANOVA (D–G) with post hoc Tukey’s multiple-comparison analysis (ns non significant; *P < 0.05; **P < 0.01; ***P < 0.001; ****P < 0.0001).
Figure EV5
Figure EV5. ATM is activated in the core of 3D spheroids and combination of 5-FU with ATMi results in growth inhibitory effects on patients-derived organoids.
(A, B) Immunofluorescence labeling of 3D HCT116 spheroid equatorial sections with antibodies targeting either phospho-ATM (A) or ATM (B). Scale bars = 100 µm. (C, D) Effects of 10 µM ATMi AZD0156, 10 µM 5-FU or the combination of both drugs on the growth of colorectal cancer patient-derived tumor organoids. Representative pictures of organoids at day 7 post-treatment are presented (C) together with quantification (D). Scale bars = 500 µm. Data information: (D) Bar graph represents means ± SD of n = 5–6 independent biological replicates and significance was determined using one-way ANOVA with Tukey’s multiple-comparison analysis (**P < 0.01; ****P < 0.0001). Source data are available online for this figure.

Similar articles

Cited by

References

    1. Andreev OA, Dupuy AD, Segala M, Sandugu S, Serra DA, Chichester CO, Engelman DM, Reshetnyak YK. Mechanism and uses of a membrane peptide that targets tumors and other acidic tissues in vivo. Proc Natl Acad Sci USA. 2007;104:7893–7898. doi: 10.1073/pnas.0702439104. - DOI - PMC - PubMed
    1. Anemone A, Consolino L, Arena F, Capozza M, Longo DL. Imaging tumor acidosis: a survey of the available techniques for mapping in vivo tumor pH. Cancer Metastasis Rev. 2019;38:25–49. doi: 10.1007/s10555-019-09782-9. - DOI - PMC - PubMed
    1. Anemone A, Consolino L, Conti L, Irrera P, Hsu MY, Villano D, Dastru W, Porporato PE, Cavallo F, Longo DL. Tumour acidosis evaluated in vivo by MRI-CEST pH imaging reveals breast cancer metastatic potential. Br J Cancer. 2021;124:207–216. doi: 10.1038/s41416-020-01173-0. - DOI - PMC - PubMed
    1. Aricthota S, Rana PP, Haldar D. Histone acetylation dynamics in repair of DNA double-strand breaks. Front Genet. 2022;13:926577. doi: 10.3389/fgene.2022.926577. - DOI - PMC - PubMed
    1. Blaszczak W, Swietach P. What do cellular responses to acidity tell us about cancer? Cancer Metastasis Rev. 2021;40:1159–1176. doi: 10.1007/s10555-021-10005-3. - DOI - PMC - PubMed

Substances