. 2024 May;18(5):1093-1122.
doi: 10.1002/1878-0261.13604. Epub 2024 Feb 17.

The multispecies microbial cluster of Fusobacterium, Parvimonas, Bacteroides and Faecalibacterium as a precision biomarker for colorectal cancer diagnosis

Affiliations

The multispecies microbial cluster of Fusobacterium, Parvimonas, Bacteroides and Faecalibacterium as a precision biomarker for colorectal cancer diagnosis

Kelly Conde-Pérez et al. Mol Oncol. 2024 May.

Abstract

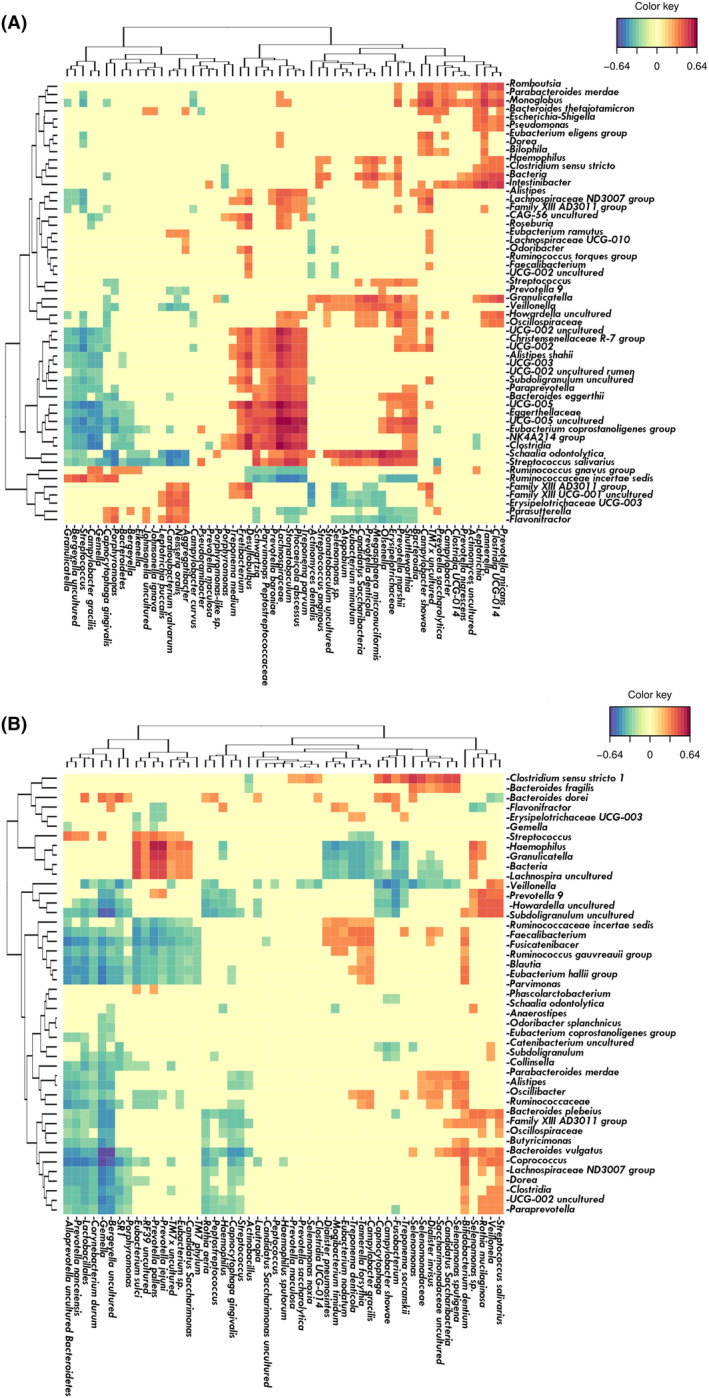
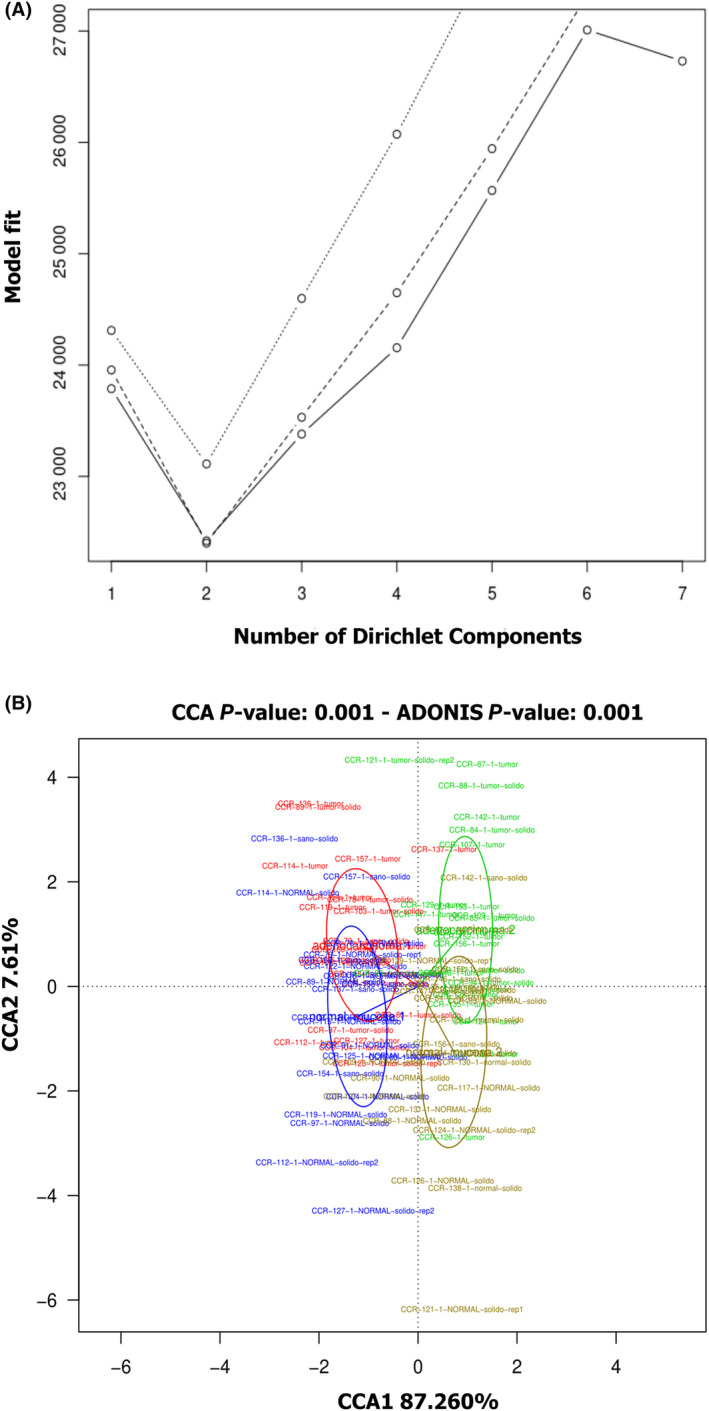
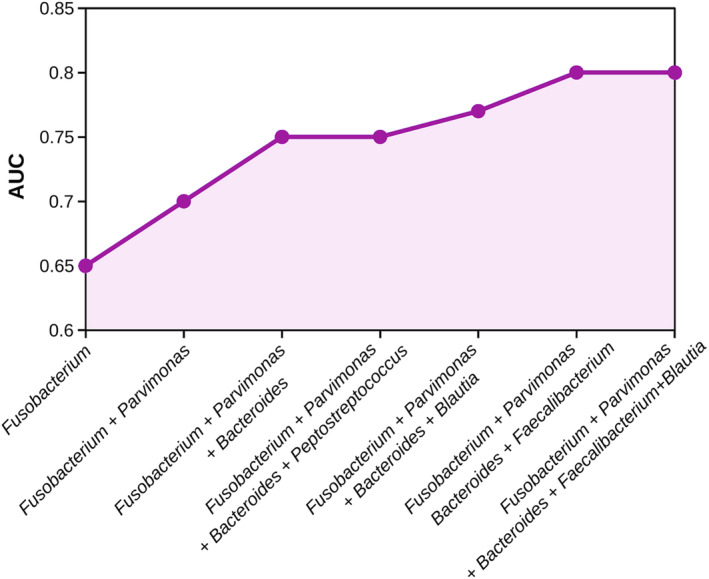
The incidence of colorectal cancer (CRC) has increased worldwide, and early diagnosis is crucial to reduce mortality rates. Therefore, new noninvasive biomarkers for CRC are required. Recent studies have revealed an imbalance in the oral and gut microbiomes of patients with CRC, as well as impaired gut vascular barrier function. In the present study, the microbiomes of saliva, crevicular fluid, feces, and non-neoplastic and tumor intestinal tissue samples of 93 CRC patients and 30 healthy individuals without digestive disorders (non-CRC) were analyzed by 16S rRNA metabarcoding procedures. The data revealed that Parvimonas, Fusobacterium, and Bacteroides fragilis were significantly over-represented in stool samples of CRC patients, whereas Faecalibacterium and Blautia were significantly over-abundant in the non-CRC group. Moreover, the tumor samples were enriched in well-known periodontal anaerobes, including Fusobacterium, Parvimonas, Peptostreptococcus, Porphyromonas, and Prevotella. Co-occurrence patterns of these oral microorganisms were observed in the subgingival pocket and in the tumor tissues of CRC patients, where they also correlated with other gut microbes, such as Hungatella. This study provides new evidence that oral pathobionts, normally located in subgingival pockets, can migrate to the colon and probably aggregate with aerobic bacteria, forming synergistic consortia. Furthermore, we suggest that the group composed of Fusobacterium, Parvimonas, Bacteroides, and Faecalibacterium could be used to design an excellent noninvasive fecal test for the early diagnosis of CRC. The combination of these four genera would significantly improve the reliability of a discriminatory test with respect to others that use a single species as a unique CRC biomarker.

Keywords: bacterial consortium; biomarkers; colorectal cancer; microbiome; oral‐gut axis; periodontal disease.


Conflict of interest statement

The authors declare no conflict of interest.

Figures

Fig. 1
Fig. 1
Flow chart of the study. A total of 159 patients diagnosed with colorectal cancer (CRC) at the University Hospital of A Coruña (CHUAC) were enrolled in this project. To ensure homogeneity among CRC participants, a set of exclusion criteria was established, resulting in the inclusion of only 93 out of the initial 159 patients. Concurrently, companions or couples of CRC patients, who shared similar lifestyles and ages, were invited to participate, and only 34 of them consented to join the study. Individuals constituting the healthy control cohort (non‐CRC) were subjected to the same exclusion criteria as CRC patients, with the additional requirement of not having been diagnosed with any type of cancer. Ultimately, only 30 out of the 34 individuals fulfilled these criteria. Informed consent was obtained from all participants prior to the sample collection phase. Subsequently, for microbial identification, two hypervariable regions of the 16S rRNA gene (V3‐V4) were sequenced. Bioinformatic analysis was employed to determine the bacterial diversity in each sample.
Fig. 2
Fig. 2
Schematic representation of the workflow during the present study. All colorectal cancer (CRC) patients involved in this study were diagnosed and treated at the University Hospital of A Coruña (CHUAC; Galicia, Spain). CRC diagnosis was based on: (1) positive colonoscopy for colorectal neoplasia confirmed by histopathological analysis of biopsied tissues or (2) through CRC screening programs consisting of a positive fecal occult blood test (FOBT) followed by a positive colonoscopy validated by histopathological analysis. The cohort for the study consisted of 93 patients diagnosed with CRC and 30 healthy individuals without any digestive disorders (non‐CRC). All the participants completed a questionnaire and collected saliva (S) and fecal (F) samples at home. Tissue samples such as normal colorectal mucosa tissue (NM) and adenocarcinoma tissue (Ac) of CRC patients were collected by the surgery team after colon laparoscopic resection at CHUAC. Besides, gingival crevicular fluid samples (GCF) were collected at Pardiñas Medical Dental Clinic (A Coruña, Galicia, Spain) during an oral examination. Finally, all different‐nature samples were sent to the microbiology laboratory at CHUAC where they were processed, sequenced, and analyzed using different bioinformatic tools.
Fig. 3
Fig. 3
Bacteriome landscape of the different‐nature samples obtained from colorectal cancer patients (CRC) and healthy individuals without any digestive disorders (non‐CRC) analyzed by 16S rRNA Illumina sequencing. Barplots show the relative abundance (RA) at the family level (A), genera level (B) and species level (C), with a prevalence filter of 30%. The panel D shows a Venn diagram indicating the number of bacterial genera detected in each of the samples, as well as the number of genera common to all the samples with a list of oral bacteria. Samples analyzed: saliva (S) and feces (F) from both non‐CRC and CRC individuals; gingival crevicular fluid (GCF), adenocarcinomas (Ac), and normal colorectal mucosa tissues (NM) from CRC patients.
Fig. 4
Fig. 4
Differential abundance analysis (DAA) of the bacteriomes of fecal samples (F) from colorectal cancer (CRC) patients and healthy individuals without any digestive disorders (non‐CRC). Analyses were made at the genus (A), species (B) and amplicon sequencing variants (ASVs) (C) levels. Effect size (log fold change), standard error and adjusted P‐values for each entry were obtained using the ANCOM‐BC method, with a prevalence filter of 30% and subsequent Holm‐Bonferroni statistical test. Only effect sizes with adjusted P‐values < 0.05 are shown (***: < 0.001, **: < 0.01, *: < 0.05).
Fig. 5
Fig. 5
Landscape of oral‐related bacteria among different‐nature samples of colorectal cancer patients (CRC) and healthy individuals without any digestive disorders (non‐CRC). (A) Alluvial barplot of oral‐related bacterial and their relative abundance (RA) among the different samples: saliva (S) from non‐CRC and CRC individuals, gingival crevicular fluid (GCF) from CRC patients, adenocarcinomas (Ac) from CRC patients, normal colorectal mucosa tissues (NM) from CRC patients and feces (F) from both non‐CRC and CRC participants. (B) Differential abundance analysis (DAA) of groups of amplicon sequencing variants (ASVs) from typical oral‐related genera obtained from feces (F) from CRC and non‐CRC individuals. Effect size (log fold change), standard error and adjusted P‐values for each entry were obtained using the ANCOM‐BC method and subsequent Holm‐Bonferroni statistical test (P‐values ***: < 0.001, **: < 0.01, −: > 0.1). No prevalence cut was used for this analysis in order to show unsignificant entries belonging to oral‐related bacteria.
Fig. 6
Fig. 6
Heat map showing the associations found among bacteria in the oral cavity of colorectal cancer (CRC) patients. (A) Gingival crevicular fluid samples (GCF) of CRC patients. (B) Saliva samples (S) of CRC patients. Species belonging to the Socransky complexes (red, orange, green, yellow, blue, and purple) are marked with the corresponding color.
Fig. 7
Fig. 7
Networks among oral bacteria present in colon tissue of colorectal cancer (CRC) patients. (A) Non‐neoplastic colon tissue (NM). (B) Colorectal adenocarcinoma tissue (Ac). Edge color corresponds to correlation strength, shown in the color key. Color of nodes corresponds to Socransky complexes color and, additionally, light blue was used for other oral‐related species and gray for gut associated species. Size of nodes was related to mean abundance in tissue.
Fig. 8
Fig. 8
Heat map of associations between oral‐related bacteria and all the bacteria present in intestinal samples of colorectal cancer (CRC) patients. (A) Non‐neoplastic colon tissue (NM). (B) Colorectal adenocarcinoma tissue (Ac). Species belonging to the Socransky complexes were marked with the corresponding color.
Fig. 9
Fig. 9
Heat map of associations between bacteria in the oral cavity and the tumor of colorectal cancer (CRC) patients. (A) Gingival crevicular fluid (GCF) and adenocarcinoma (Ac) paired samples. (B) Saliva (S) and Ac paired samples.
Fig. 10
Fig. 10
Tissue enterotypes analysis in colorectal cancer (CRC) patients. (A) Dirichlet Multinomial Mixtures (DMM) was used to infer the optimal number of community types in non‐neoplastic colon tissue samples (NM). Model fit was measured by Akaike's Information Criterion (aic) (dotted line), Bayesian Information Criterion (bic) (dashed line) and Laplace approximation (lplc) (solid line). (B) NM samples from both enterotypes (enterotype 1: blue, enterotype 2: yellow) and their corresponding adenocarcinoma sample (Ac) (enterotype 1: red, enterotype 2: green) were represented with a canonical correlation analysis (CCA) plot.
Fig. 11
Fig. 11
Prediction performance of bacterial biomarkers detected in fecal samples. Prediction performance is indicated as area under de curve (AUC) values obtained from receiver operating characteristic (ROC) curves of a leave‐one‐out cross validation method based on models with 1, 2, 3 or 4 bacterial genera.
Fig. 12
Fig. 12
Differential abundance analysis (DAA) of the bacteriomes of fecal samples from colorectal cancer (CRC) patients and healthy individuals without any digestive disorders (non‐CRC) obtained from three different datasets compared to our study. Analyses were made at the (A) genus, (B) species and (C) amplicon sequencing variants (ASVs) levels. Effect size (log fold change), standard error and adjusted P‐values for each entry were obtained using the ANCOM‐BC method with a prevalence filter of 10% and subsequent Holm‐Bonferroni statistical test (P‐values ***: < 0.001; **: < 0.01; *: < 0.05).

References

    1. International Agency for Research on Cancer (IARC) , World Health Organization (WHO) . Global cancer observatory (GLOBOCAN) 2020. Lyon (France): IARC; 2020. https://gco.iarc.fr/. Accessed 12 Dec 2022.
    1. Asociación Española Contra el Cáncer . Informe dinámico: Cáncer de Colon. Madrid, Spain: Asociación Española Contra el Cáncer; 2023. https://observatorio.contraelcancer.es/informes/informe‐dinamico‐cancer‐.... Accessed 26 Sep 2022.
    1. Kong F, Cai Y. Study insights into gastrointestinal cancer through the gut microbiota. Biomed Res Int. 2019;2019:8721503. 10.1155/2019/8721503 - DOI - PMC - PubMed
    1. Louis P, Hold GL, Flint HJ. The gut microbiota, bacterial metabolites and colorectal cancer. Nat Rev Microbiol. 2014;12:661–672. 10.1038/nrmicro3344 - DOI - PubMed
    1. Salehiniya H, Pouyesh V, Tarazoj AA, Mohammadian‐Hafshejani A, Aghajani M, Yousefi SM, et al. Colorectal cancer in the world: incidence, mortality and risk factors. Biomed Res Ther. 2017;4:1656–1675. 10.15419/bmrat.v4i10.372 - DOI

Publication types