. 2024 Feb 27;43(2):113776.
doi: 10.1016/j.celrep.2024.113776. Epub 2024 Feb 15.

Modulation of central synapse remodeling after remote peripheral injuries by the CCL2-CCR2 axis and microglia

Affiliations

Modulation of central synapse remodeling after remote peripheral injuries by the CCL2-CCR2 axis and microglia

Travis M Rotterman et al. Cell Rep. .

Abstract

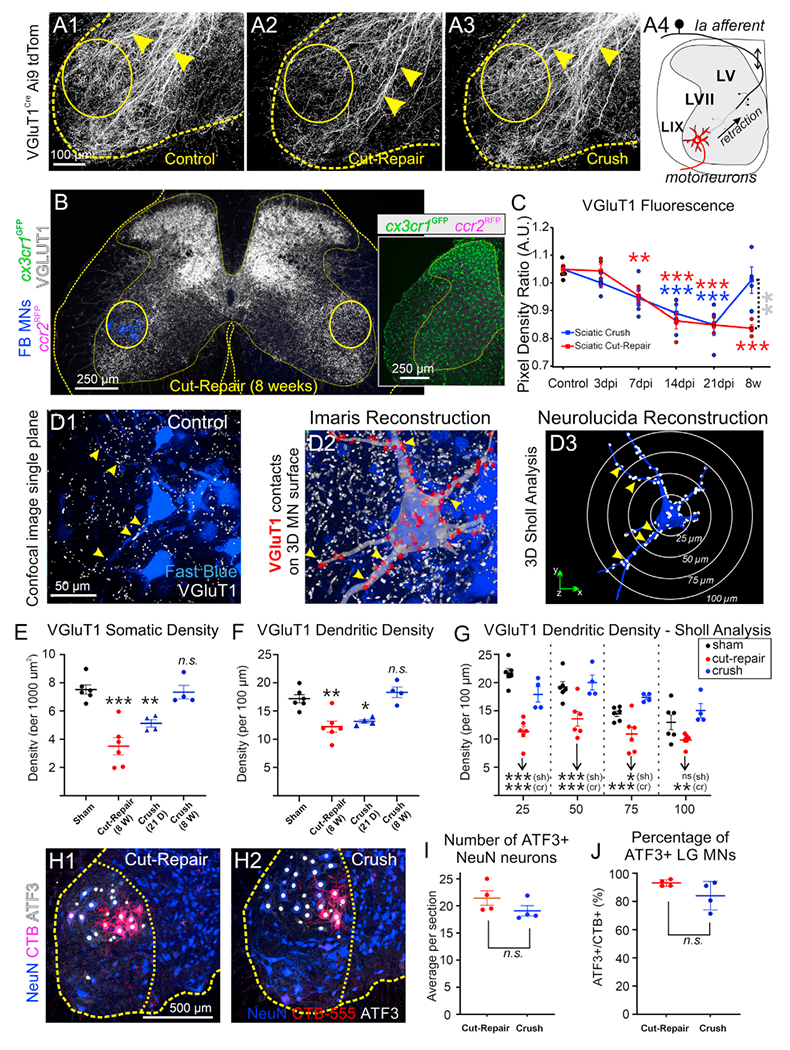
Microglia-mediated synaptic plasticity after CNS injury varies depending on injury severity, but the mechanisms that adjust synaptic plasticity according to injury differences are largely unknown. This study investigates differential actions of microglia on essential spinal motor synaptic circuits following different kinds of nerve injuries. Following nerve transection, microglia and C-C chemokine receptor type 2 signaling permanently remove Ia axons and synapses from the ventral horn, degrading proprioceptive feedback during motor actions and abolishing stretch reflexes. However, Ia synapses and reflexes recover after milder injuries (nerve crush). These different outcomes are related to the length of microglia activation, being longer after nerve cuts, with slower motor-axon regeneration and extended expression of colony-stimulating factor type 1 in injured motoneurons. Prolonged microglia activation induces CCL2 expression, and Ia synapses recover after ccl2 is deleted from microglia. Thus, microglia Ia synapse removal requires the induction of specific microglia phenotypes modulated by nerve regeneration efficiencies. However, synapse preservation was not sufficient to restore the stretch-reflex function.

Keywords: C-C chemokine; CP: Immunology; CP: Neuroscience; Ia afferent; colony stimulating factor 1; motoneuron; nerve injury; neuroinflammation; regeneration; stretch reflex; synapse.


Conflict of interest statement

Declaration of interests The authors have no competing interests.

Figures

Figure 1.
Figure 1.. VGluT1 synapses recover following nerve crush but are permanently lost after nerve cut
(A) VGluT1Cre/+ tdTomato axons (A1) in sham mice and 8 weeks after (A2) sciatic cut-repair or (A3) sciatic crush. Arrowheads, ventrally directed VGluT1 axons; circles, sciatic motor pools. In (A2), VGluT1 axon loss inside sciatic motor pools is shown. (A4) Model of Ia axon ventral collateral dieback after nerve cut. (B) VGluT1-IR decreases in injured sciatic motor pools (circles) 8 weeks post-cut-repair. FB labels LG motoneurons (MNs). cx3cr1GFP/+::ccr2RFP/+ mice were used. Inset: GFP (microglia) and RFP (CCR2+ cells). (C) VGluT1 density ratio (ipsilateral/contralateral to injury) after cut-repair (red) or crush (blue). Each mouse estimate is the average of 10 sections. Red and blue asterisks are comparisons to control. Gray asterisks compare cut-repair and crush. Statistics in the Table S1. (D) VGluT1 synapses (arrowheads) on LG motoneurons. (D1) Single optical plane of a sham control. (D2) Neurolucida tracing on the confocal stack. Red dots mark VGluT1 synapses. (D3) VGluT1 synapses (white dots) on a reconstructed motoneuron. White circles indicate Sholl bins. (E and F) VGluT1 density on (E) soma and (F) proximal dendrites. VGluT1 synapses are depleted in both compartments 8 weeks after cut-repair (red). Following crush (blue), they are significantly reduced 21 days after injury, but return to control 8 weeks post-injury. Dots are mouse estimates from six motoneurons each. Significance levels compared with sham controls. Statistics in the Tables S2 and S3. (G) Sholl analyses 8 weeks post-injury (bin size: 25, 50, 75, and 100 μm from cell body). Following crush (blue), VGluT1 densities were not different from controls. After cut-repair (red), VGluT1 synapses were depleted at all dendrite distances. Asterisks indicate significance compared with crush (cr, blue) or sham (sh, black). Statistics in the Table S4. (H) Nuclear ATF3 (white) in NeuN+ (blue) motoneurons and CTB-555-labeled LG motoneurons (red). Ventral horn and LIX indicated with dashed outlines. (I) ATF3+ motoneurons per section (50 μm thick) 7 days post cut-repair (red) or crush (blue). No significant differences between injuries (t test, t(6) = 1.451, p = 0.197). (J) Percentage of CTB+ motoneurons with ATF3. No significant differences (two-tailed t test, t(6) = 1.735, p = 0.134). In (I) and (J), each dot is the average of six sections per mouse. In all graphs, each dot is an animal estimate, the animal’s average is represented by a bar or square, and error bars are ±SD. *p < 0.05, **p < 0.01, ***p < 0.001. Statistical comparisons are from two-way ANOVAs (injury type and time after injury in C; injury type and distance in G) or one-way ANOVAs (E and F) followed by post hoc Bonferroni’s t tests. Statistics in (I) and (J) are two-tailed t tests.
Figure 2.
Figure 2.. Stretch reflexes recover following regeneration after sciatic nerve crush but not after sciatic nerve cut-repair
(A) Decerebrate mouse preparation for stretch-reflex testing. Triceps surae muscle tendon is attached to a servomotor to apply stretch (ramp-hold-release [ramp] or vibration), while simultaneously recording force and EMG activity. Insets: Muscle spindle reinnervation following cut-repair (top) and crush (bottom). Sensory axons were labeled with neurofilament heavy chain (NFH; green) and VGluT1 (magenta) antibodies. (B) Raw muscle force traces (black) to ramp stretch (left) or vibration (right) in control, cut-repair, and crush mice and corresponding EMGs (blue). Passive force (red) to ramps was measured under isoflurane. (C) Percentage of trials resulting in a reflex response. Each dot represents average data from 40 to 100 trials per animal. All mice produced a reflex in control and 8 weeks post-crush to either ramp or vibration. After cut-repair, only one mouse (of five) produced a reflex in 22% of trials in response to ramp stretch. None elicited responses after vibration. (D) Time-integrated reflex muscle force. No reflex force was elicited after cut-repair, except for one mouse partially responsive to ramps. After nerve crush, reflex to ramps was significantly enhanced (two-tailed t test, t(7) = 2.776; p = 0.0275), but not to vibration (two-tailed t test, t(7) = 0.4256; p = 0.9832). (E) Time-integrated EMGs in response to ramp or vibration. After cut-repair most mice had no response to either ramp or vibration, with the one exception noted in (C) and (D). After crush there was a trend toward larger responses to ramps, although this was not significant (two-tailed t test, t(7) = 1.066; p = 0.3220). Average responses to vibration were similar to control (two-tailed t test, t(7) = 0.1199; p = 0.9080). In all graphs each dot is one animal estimate, animals’ averages are represented by a line, and error bars are ±SD. *p < 0.05. Statistical comparisons were not done when most data equal 0 (cut-repairs).
Figure 3.
Figure 3.. The ventral horn microglial response is prolonged after sciatic nerve cut
(A) Differences in ventral cx3cr1+ microglia (GFP) 14 days post cut-repair or crush. FB LG motoneurons are in blue. Dashed line divides dorsal and ventral horns. (B) GFP+ cell counts in the ventral horn at different days post-injury (dpi) after cut-repair or crush. GFP+ microglia increase similarly in both injury models during the first week. Red and blue asterisks are comparisons to control. Gray asterisks compare cut-repair with crush. Statistics in the Table S5. (C) cx3cr1-GFP cells at 3 and 7 days after cut-repair or crush injury incorporating EdU injected 24 h before. (D) Percentage of cx3cr1+ cells with EdU. Similar numbers of microglia incorporate EdU at 2 days after cut-repair (red) or crush (blue). The percentage of microglia that incorporate EdU at 6 days drops below 10% after either injury. Differences between ages were significant (asterisks), but not between injuries. Statistics in the Table S7. (E) cx3cr1-GFP cells with Ki67 at 3 and 7 days post-injury after cut-repair or crush injury. (F) Percentage of cx3cr1+ cells with Ki67. Significant differences were found between 3 and 7 dpi following crush. After cut-repair two of three animals returned toward baseline at 7 dpi, while one remained elevated. Statistics in the Table S8. (G and H) Colony-stimulating factor 1 (CSF1, red) is (G) strong in injured motoneurons, including FB + LG pools (blue), 14 days after cut-repair, but (H) weak after crush. Insets: high magnifications of areas outlined by boxes. (I) CSF1 in individual FB+ motoneurons 14 days after cut-repair (red, mice 1–5) or crush (blue, mice 6–10). Average background + 2 SD is represented by gold bars. Black bars represent mouse averages, and error bars are ±SD. Motoneurons retained higher CSF1 14 days after cut-repair compared with nerve crush. Statistics in the Table S9. (J) Percentage of FB+ motoneurons with CSF1 2XSD background 14 days post cut-repair (red) or crush (blue). A significantly larger proportion of motoneurons express CSF1 post cut-repair (two-tailed t test, t(8) = 3.604, p = 0.0069). (K) Average fluorescence intensity in motoneurons that are CSF1+ 14 days post cut-repair (red) or crush (blue). Motoneurons express significantly more CSF1 after cut-repair compared with crush (two-tailed t test, t(8) = 4.523, p = 0.0019). In all graphs (except I), each dot is one animal, animals’ averages are represented by a line, and error bars are ±SD. *p < 0.05, **p < 0.01, ***p < 0.001, ****p < 0.0001. In (B), (D), and (F), two-way ANOVA was used for injury type and days post-injury followed by post hoc Bonferroni’s test; in (J) and (K), t test.
Figure 4.
Figure 4.. CCR2+ cells preferentially infiltrate the ventral horn following nerve cut
(A and B) Larger infiltration of CCR2+ cells (white) around FB LG motoneurons (blue) 14 days after (A) cut-repair compared with (B) crush. Bottom: enlarged images of areas outlined by yellow boxes. (C) CCR2+ cell infiltration time course after cut-repair or crush. Graph represents average (±SD) number of RFP cells per ventral horn section (50 μm thick; six sections per animal). Peak infiltration occurs 14 days after injury. No significant infiltration of CCR2+ cells occurs after nerve crush. Statistics in the Table S10. (D) cx3cr1+ cells (GFP) co-expressing CCR2 (RFP) are branched and “microglia-like.” (E) Dual-expressing GFP::RFP cells per ventral horn are few, but significantly higher compared with control. Prolonged presence occurs only after cut-repair. Statistics in the Table S11. (F and G) Iba1 microglia and FB LG motoneurons 14 days after unilateral sciatic cut-ligation in ccr2-CreERT2::tdTomato mice (F). (G) Same section showing CCR2+ cells lineage labeled prior to injury and visualized 14 days after cut-repair. (H–J) Images of FB LG motoneurons, Iba1+ cells, tdTomato genetically labeled CCR2+ cells, and the T cell marker Cd3ε 14 days following sciatic cut-repair. Dashed boxes in (H) are shown at higher magnitude in (J) and (I). Iba1+ and CCR2+ cells surround axotomized motoneurons. Most lineage-labeled CCR2+ cells are T cells (single arrowheads). A few cells branch and express Iba1 (double arrowheads). In graphs (C) and (E) each dot is one animal estimate, animals’ averages are represented by a line, and error bars are ±SD. *p < 0.05, **p < 0.01, ***p < 0.001, ****p < 0.0001. Two-way ANOVA for injury type and time followed by post hoc Bonferroni’s test. Red and blue asterisks are comparisons with control. Gray asterisks compare cut-repair with crush.
Figure 5.
Figure 5.. Microglia and injured motoneurons differentially express CCL2 depending on injury type and time after injury
(A–D) ccl2::mCherry (A and C) 3 and (B and D) 14 days after (A and B) nerve crush or (C and D) cut-repair injury. All sections contain four fluorochromes: FB LG motoneurons (FB, blue), ChAT+ motoneurons (FITC, green), mCherry (Cy3, magenta), and Iba1+ microglia (Cy5, green). Pseudocolors were chosen for best visualization. Motoneurons express ccl2:mCherry after either injury with stronger expression at 3 days. Microglia express ccl2::mCherry only 14 days after nerve cut-repair injuries (white/whitening green). (E) ChAT+ motoneuron numbers expressing ccl2:mCherry are not significantly different among injuries. Expression significantly decreases from 3 to 14 days. Statistics in the Table S12. (F) Similar results as in (E) estimating the percentage of FB LG motoneurons expressing ccl2::mCherry. Statistics in the Table S13. (G) Few Iba1+ microglia contained within a circular ROI centered on FB motoneurons express ccl2::mCherry at any post-injury time after crush or 3 days after cut-repair injuries. This number significantly increases 14 days after a nerve cut-repair injury. Statistics in the Table S14. (H) Same conclusion as in (G), but considering the percentage of Iba1+ microglia with ccl2::mCherry. Statistics in the Table S15. (I) Time course of ccl2 expression in ChAT+ motoneurons and Iba1+ microglia after nerve cut-ligation (no regeneration, two animals per time point). Expression in motoneurons precedes that in microglia, which peaks 14 days post-injury. Left: number of ChAT+ motoneurons and Iba1+ cells with ccl2::mCherry over time. Right: percentage of FB+ motoneurons and Iba1+ cells with ccl2::mCherry. (J) ccl2::mCherry signal (magenta) in Iba1+ microglia (green) 14 days and 8 weeks after a nerve cut-repair injury. At 14 days mCherry labeling fills the whole cell body and processes, at 8 weeks it is clustered in one side of the cytoplasm. In graphs (E) to (H), each dot is one section from n = 2 animals (one male and one female; see Figure S5 for animals’ individualized data). Averages of all pooled sections are represented by a line and error bars are ±SD. *p < 0.05, ****p < 0.0001. Two-way ANOVA for injury type and days post-injury followed by post hoc Bonferroni’s test.
Figure 6.
Figure 6.. Genetic ablation of ccl2 in microglia preserves VGluT1 synapses on motoneuron dendrites but does not recover stretch reflexes
(A) Specific ccl2 deletion from motoneurons (MNΔccl2) or microglia (MGΔccl2) 14 days after cut-repair. White arrowheads, motoneurons; yellow arrowheads, microglia. (B) VGluT1 synapses mapped on motoneuron reconstructions in uninjured controls and ccl2lfox/flox, MNΔccl2, and MGΔccl2 mice 12 weeks post-injury. (C) VGluT1 density on soma (left) and dendrites (right) (six to eight motoneurons per animal estimate). Cell bodies show a significant loss compared with control in all nerve-injured animals. MGΔccl2 mice VGluT1 density on dendrites is not significantly different from that of control. (D and E) ccl2 removal from motoneurons or microglia does not recover reflex force or EMG responses to (D) ramps or (E) vibration stretches. Twelve weeks of regeneration. (F and G) Percentage of responding trials and integrated force after (F) ramp or (G) vibration stretches. These data demonstrate no reflex recovery in MNΔccl2 or MGΔccl2 mice. (H) Spindles in MGΔccl2 mouse muscles ipsilateral and contralateral to the injury. Neurofilament heavy chain (NFH; green) labels motor and sensory axons. Sensory axons make annulospiral endings in control spindles (left) and are disorganized in reinnervated spindles (right). Motor axons end in α-bungarotoxin (α-BTx)-labeled intrafusal NMJs (white) in control and reinnervated spindles. DAPI labels intrafusal fiber nuclei. In all graphs, each marker is one animal estimate, animals’ averages are represented by a bar or square, and error bars are ±SD. *p < 0.05, **p < 0.01, ***p < 0.001. Unless otherwise indicated, statistical comparisons are one-way ANOVA followed by post hoc pairwise comparisons using Bonferroni’s corrected t test.
Figure 7.
Figure 7.. Effect of removing ccl2 from motoneurons or microglia on peripheral immune cell entry
(A) Peripheral immune cells analyzed in quadruple-immunofluorescence sections: FB LG motoneurons (FB; blue), ccl2::mCherry (magenta), microglia (Iba1; green), and the CD45 leukocyte marker (white). We compared genetic controls (ccl2flox/flox) with animals in which ccl2 was removed in cholinergic neurons (ChATcre/cre mice: MNΔccl2) or after tamoxifen in microglia (cx3cr1creERT2/+ mice: MGΔccl2). Specific removal of ccl2 from motoneurons or microglia is shown in the middle images. Presence of CD45 cells in all types of mice is shown in the left images. (B) A local cluster of CD45 cells close to axotomized FB motoneurons. Different images show FB motoneurons (blue), CD45 cells (white), and Iba1 microglia (green) in different combinations. Some CD45 cells are in contact with motoneurons (yellow arrow), others associate with microglia. The circle (dashed line) indicates a local accumulation of CD45 cells coincident with a region containing microglia at high density. (C) Number of CD45high cells per ventral horn. Each dot is the estimate from a single animal. Average and ±SD are illustrated. Two-way ANOVA for injured side and genetics (statistics in the Table S17) showed significant differences according to spinal cord side (ipsilateral or contralateral to the injury), but not according to cell-type-specific ccl2 deletions. *p < 0.05, **p < 0.01, ***p < 0.001 in pairwise Bonferroni’s corrected t test.

Similar articles

Cited by

References

    1. Bisicchia E, Sasso V, Molinari M, and Viscomi MT (2019). Plasticityof microglia in remote regions after focal brain injury. Semin. Cell Dev. Biol 94, 104–111. 10.1016/j.semcdb.2019.01.011. - DOI - PubMed
    1. Whitelaw BS, Stoessel MB, and Majewska AK (2023). Movers and shakers: Microglial dynamics and modulation of neural networks. Glia 71, 1575–1591. 10.1002/glia.24323. - DOI - PMC - PubMed
    1. Wilton DK, Dissing-Olesen L, and Stevens B (2019). Neuron-Glia Signaling in Synapse Elimination. Annu. Rev. Neurosci 42, 107–127. 10.1146/annurev-neuro-070918-050306. - DOI - PubMed
    1. Costigan M, Scholz J, and Woolf CJ (2009). Neuropathic pain: a maladaptive response of the nervous system to damage. Annu. Rev. Neurosci 32, 1–32. 10.1146/annurev.neuro.051508.135531. - DOI - PMC - PubMed
    1. Kuner R, and Flor H (2016). Structural plasticity and reorganisation in chronic pain. Nat. Rev. Neurosci 18, 20–30. 10.1038/nrn.2016.162. - DOI - PubMed

Publication types

Substances