Randomized Controlled Trial
. 2024 Feb 29;187(5):1238-1254.e14.
doi: 10.1016/j.cell.2024.01.037. Epub 2024 Feb 17.

Selection of epigenetically privileged HIV-1 proviruses during treatment with panobinostat and interferon-α2a

Affiliations
Randomized Controlled Trial

Selection of epigenetically privileged HIV-1 proviruses during treatment with panobinostat and interferon-α2a

Marie Armani-Tourret et al. Cell. .

Abstract

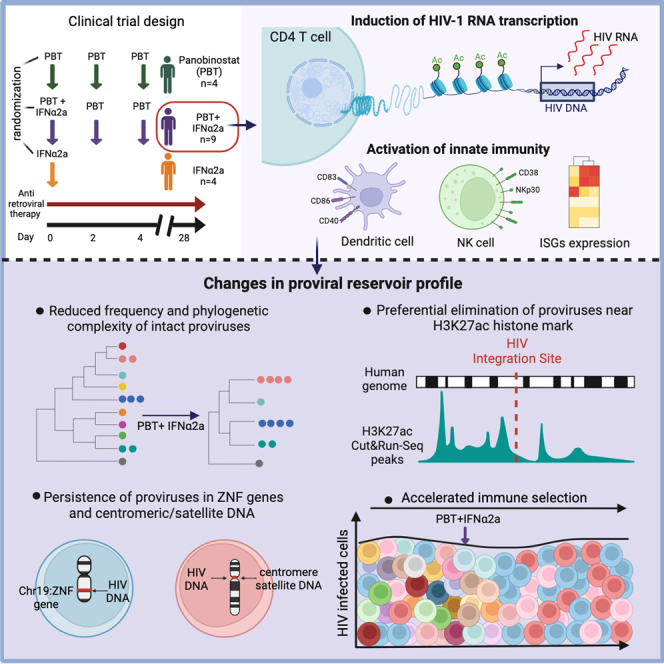
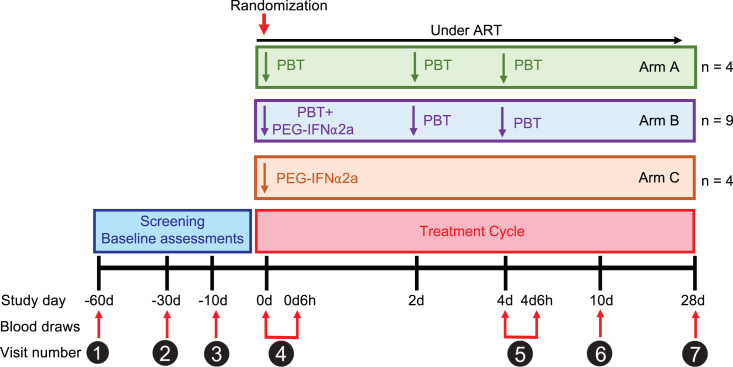
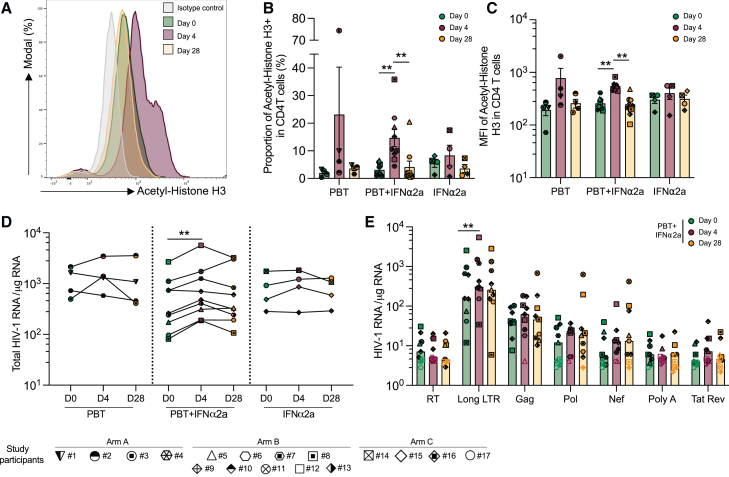
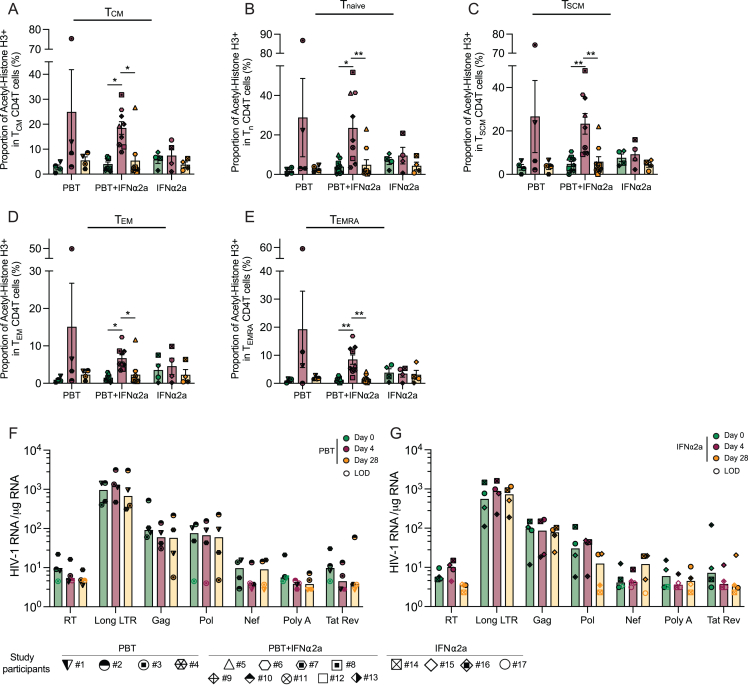
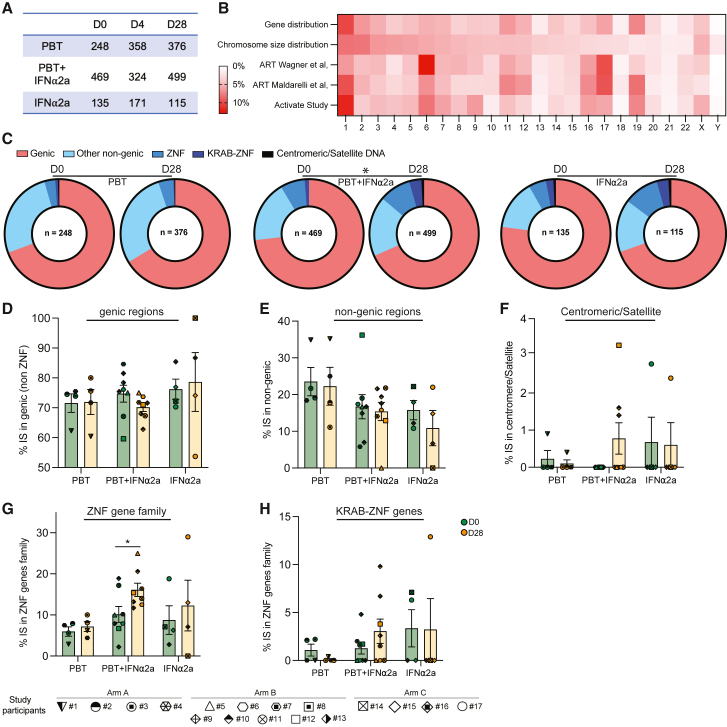
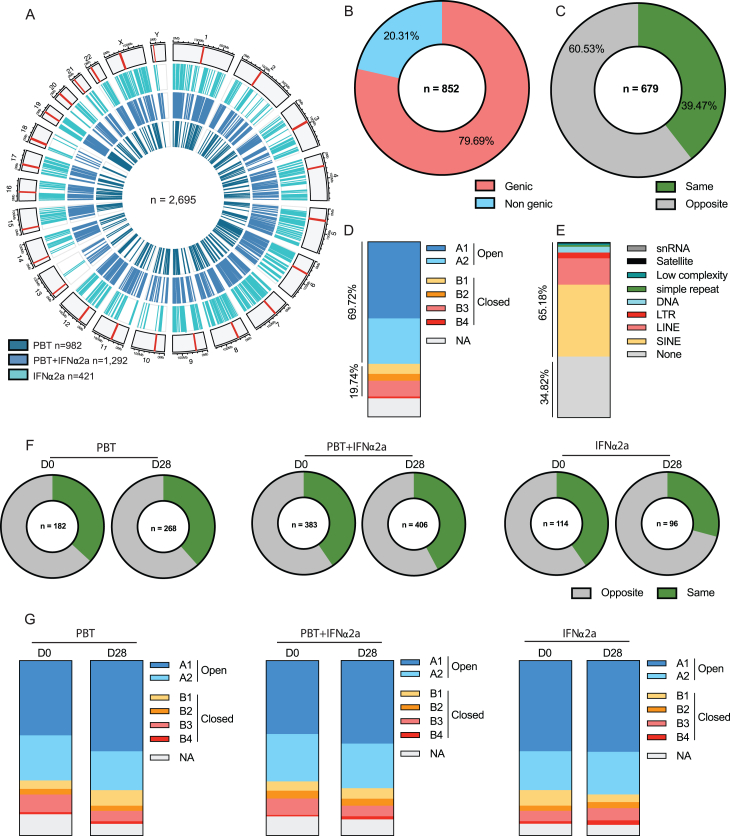
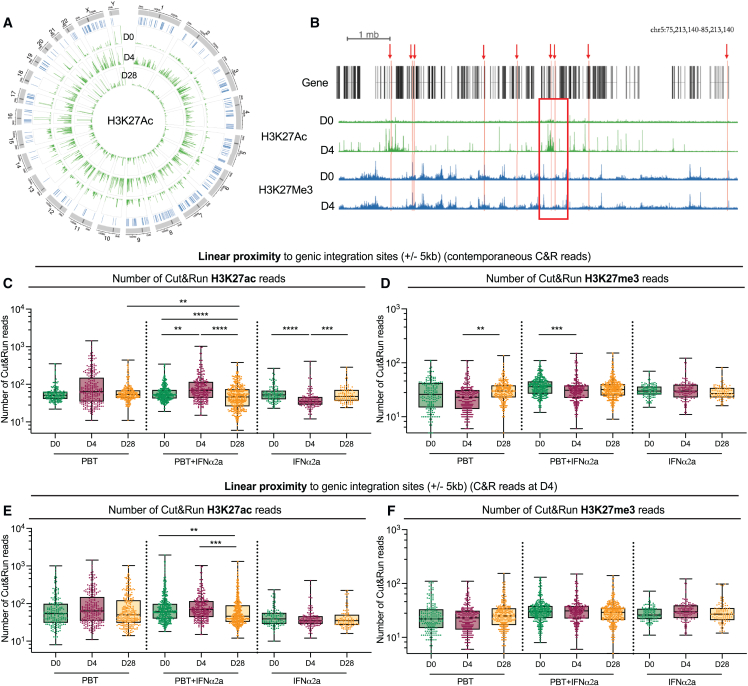
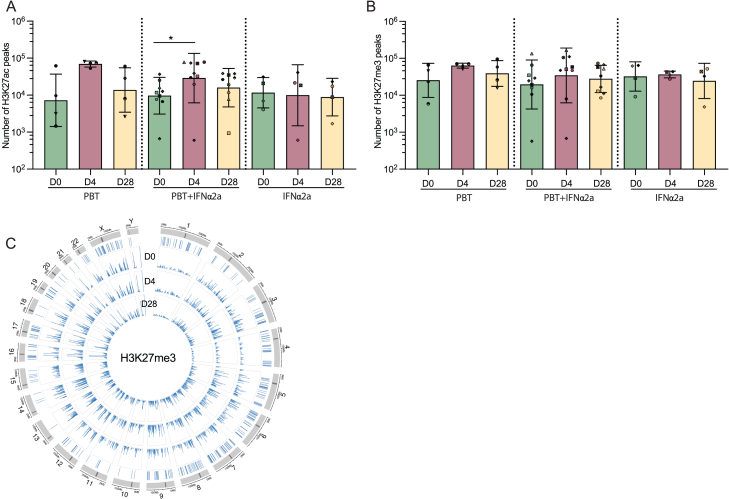
CD4+ T cells with latent HIV-1 infection persist despite treatment with antiretroviral agents and represent the main barrier to a cure of HIV-1 infection. Pharmacological disruption of viral latency may expose HIV-1-infected cells to host immune activity, but the clinical efficacy of latency-reversing agents for reducing HIV-1 persistence remains to be proven. Here, we show in a randomized-controlled human clinical trial that the histone deacetylase inhibitor panobinostat, when administered in combination with pegylated interferon-α2a, induces a structural transformation of the HIV-1 reservoir cell pool, characterized by a disproportionate overrepresentation of HIV-1 proviruses integrated in ZNF genes and in chromatin regions with reduced H3K27ac marks, the molecular target sites for panobinostat. By contrast, proviruses near H3K27ac marks were actively selected against, likely due to increased susceptibility to panobinostat. These data suggest that latency-reversing treatment can increase the immunological vulnerability of HIV-1 reservoir cells and accelerate the selection of epigenetically privileged HIV-1 proviruses.

Keywords: HIV-1; HIV-1 cure; epigenetics; histone acetylation; innate immunity; integration sites; interferon; panobinostat; shock and kill; viral reservoir.


Conflict of interest statement

Declaration of interests D.R.K. discloses having received research funding and a speaker fee from Novartis.

Figures

None
Graphical abstract
Figure 1
Figure 1
Schematic overview of the ACTIVATE study design Individual treatment arms after randomization are shown: arm A (n = 4) received only panobinostat (PBT), arm B (n = 9) received panobinostat (PBT) in combination with pegylated IFN-α2a (PEG-IFN-α2a), and arm C (n = 4) received only pegylated IFN-α2a. Time points of PBMC sample collection for analytical purposes are shown.
Figure 2
Figure 2
Increases in H3 histone acetylation and viral transcription during treatment with the study medication (A) Representative flow cytometry histograms of acetyl-histone H3 expression at days 0, 4, and 28 after panobinostat (PBT) treatment. (B) Proportion of CD4+ T cells expressing acetylated H3 in indicated study groups. (C) Mean fluorescent intensity (MFI) of acetylated H3 expression in CD4+ T cells in the different study groups. (D) Total cell-associated HIV-1 RNA copies (determined as the sum of the seven amplified HIV-1 transcripts) in purified CD4+ T cells normalized to 1 μg of cellular RNA and plotted on a log scale at day 0, day 4, and day 28. (E) Cell-associated HIV-1 RNA copies in purified CD4+ T from study participants receiving panobinostat and pegylated IFN-α2a cells normalized to 1 μg of cellular RNA. Seven different viral transcripts were analyzed: readthrough (RT), long LTR, Gag, Pol, Nef, polyA, and Tat/Rev. Empty symbols represent the limit of detection (LOD), defined as the total number of cells assayed without target identification. In (B) and (C), vertical bars reflect the mean with SEM; in (E), vertical bars reflect the geometric mean. p < 0.05, ∗∗p < 0.01, Friedman test followed by Dunn’s multiple comparisons or Wilcoxon matched-pairs signed rank test. See also Figure S1.
Figure S1
Figure S1
Changes in H3 acetylation and HIV-1 transcription in the ACTIVATE study, related to Figure 2 (A–E) Proportions of TCM (A), Tnaive (B), TSCM (C), TEM (D), and TEMRA (E) expressing acetylated H3, determined by flow cytometry. Vertical bars reflect the mean with SEM. (F and G) HIV-1 RNA quantities in purified CD4+ T cells from study participants receiving panobinostat alone (study arm A in F) or pegylated IFN-α2a alone (study arm C in G) normalized to 1 μg of cellular RNA. Seven different HIV-1 transcripts were analyzed: readthrough (RT), long LTR, Gag, Pol, Nef, polyA, and Tat/Rev. Empty symbol represents the limit of detection (LOD) defined as the number of cells assayed without target identification. Vertical bars reflect the geometric mean. (p < 0.05, ∗∗p < 0.01, Friedman test followed by Dunn’s multiple comparisons or Wilcoxon matched-pairs signed rank test.)
Figure 3
Figure 3
Innate immune responses during treatment with panobinostat (PBT) and/or pegylated IFN-α2a (A) Representative flow cytometry dot plots indicating the gating strategy for defining plasmacytoid dendritic cells (pDCs) and myeloid dendritic cells (mDCs). (B and C) Proportions of plasmacytoid dendritic cells (pDCs) (B) expressing CCR7 (left), CD40 (middle), and CD86 (right) or myeloid dendritic cells (mDCs) (C) expressing CD83 (left), CD40 (middle), and CD86 (right). (D) Representative flow cytometry dot plots indicating the gating strategy for defining natural killer (NK) cells and the subpopulations of cytotoxic NK cells expressing CD16 and CD56. (E) Proportions of cytotoxic NK cells (left) and the proportions of these cytotoxic NK cells expressing CD38 (middle) and NKp30 (right). (F) Representative flow cytometry dot plots indicating the gating strategy for defining CD8+ T cells co-expressing perforin and granzyme A at day 0 (left) and day 4 (right). (G) Proportions of CD8+ T cells expressing granzyme A (left), granzyme B (middle), and perforin (right). (H) Simplified presentation of incredibly complex evaluations (SPICE) diagrams reflecting the proportions CD8+ T cells expressing granzyme A, granzyme B, and/or perforin at day 0 before treatment or at day 4 after receiving the combined treatment. The pie charts indicate the relative proportions of cells expressing 1, 2, or 3 features; individual features are shown as overlaying arches. (I) Proportion of CD4+ T cells expressing granzyme A (left), granzyme B (middle), and perforin (right). (J) Significant canonical pathways predicted by ingenuity pathway analysis (IPA) of differentially expressed genes (DEGs) (day 4 vs. day 0) using RNA-seq data from CD4+ T cells of participants receiving the combined treatment. Pathways predicted to be upregulated are marked in red, and pathways with no predicted directional change are marked in gray. The cutoff was established at −log (p value) ≥ 1.3 (yellow dashed line). (K) Heatmap displaying interferon regulated gene (IRG, defined by www.interferome.org), differentially expressed at day 4 vs. day 0, determined using RNA-seq data from CD4+ T cells of individuals receiving the combined study medication. In (B), (C), (E), (G), and (I), vertical bars reflect the mean with SEM. p < 0.05, ∗∗p < 0.01, Friedman test followed by Dunn’s multiple comparisons was used for all the comparisons. Symbols for identification of individual study participants are as in Figure 2. See also Figure S2.
Figure S2
Figure S2
Analysis of monocytes and HIV-1-specific T cell responses during treatment with the study medication, related to Figure 3 (A) Representative flow cytometry dot plots indicating the gating strategy for defining monocytes. (B and C) Proportions of monocytes in live cells (B) and proportions of these cells expressing CD40 (C), determined at indicated time points in the study. (D–L) Representative flow cytometry dot plots and bar diagrams representing the expression of IFN-γ (D–F), TNF-α (G–I), or IL-2 (J–L) after stimulation with gag peptides in CD4+ T cells (E, H, and K) or CD8 T cells (F, I, and L); stimulation with SEB was used as a positive control. Vertical bars reflect mean and SEM.
Figure 4
Figure 4
Evolution of intact and defective HIV-1 DNA during treatment with the study medication (A) Frequencies of total, defective, and intact proviruses per 106 total CD4+ T cells as measured by the IPDA at days 0 and 28. Total proviruses were determined as the sum of intact, 5′ defective, and 3′ defective proviruses from each study participant. Empty symbols represent the limit of detection (LOD), defined as the total number of cells assayed without target identification. Note that due to the low frequencies of intact proviruses, data from total proviruses and defective proviruses are very similar. In study subject 12, a large proviral clone was detected that was classified as genome intact by IPDA but was defective when analyzed using FLIP-seq. (B and C) Spearman correlation between total (B) or intact (C) proviruses determined by FLIP-seq (and MIP-seq for participants #5, #6, #9, #10, and #12) and by IPDA. Note that FLIP-seq/MIP-seq results are reported as copies per million PBMCs, whereas IPDA data are reported as copies per million CD4+ T cells. (D–H) Frequencies of total HIV-1 proviruses (D), total intact proviruses (E), intact proviruses detected once at any of the analyzed time points (F), proviruses with 5-LTR defects (G), and hypermutated proviruses (H) per 106 PBMCs, as measured by the FLIP-seq (and MIP-seq for participants #5, #6, #9, #10, and #12; p < 0.05, Wilcoxon matched-pairs signed rank test). (I) Proportion of non-clonal intact sequences (detected once at any given time point, shown in gray) and clonal intact sequences (detected more than once at any given time point, colors denote members of the same clones) determined by FLIP-seq (and MIP-seq for participants #5, #6, #9, #10, and #12) at days 0 and 28. p < 0.05, chi-squared test. (J and K) Maximum-likelihood phylogenetic trees for intact HIV-1 proviruses from study participants #6, #9, #10, and #12 obtained at days 0 and 28. Coordinates of chromosomal integration sites obtained by integration site loop amplification (ISLA) and corresponding gene names (where applicable) are indicated. Colors denote members of the same clone. $, integration sites that could not be definitively mapped to one exact genomic location due to positioning in repetitive centromeric satellite DNA present in multiple regions of the human genome. See also Figure S3.
Figure S3
Figure S3
Molecular profiling of the proviral reservoir landscape during treatment with panobinostat and PEG-IFN-α2a, related to Figure 4 (A–C) Spearman correlation between the fold change (FC) in HIV-1 DNA levels (determined by IPDA) between days 28 and 0 (expressed as Log2FC) and the proportion of NK cells expressing NKp30 at day 0 (A), day 4 (B), and the difference (Δ) of NK cells expressing NKp30 between days 0 and 4 (C). (D) Virograms summarizing n = 614 individual HIV-1 proviral sequences from days 0 and 28 aligned to the HXB2 reference genome from each participant in study group B; color coding reflects the classification of proviral sequences. (E) Phylogenetic tree of all the intact sequences collected at days 0 and 28 by FLIP-seq and MIP-seq (n = 106) in study participants from group B. (F) Frequencies of proviruses with deletions in the D1 splice donor site at days 0 and 28 in study participants from study group B.
Figure 5
Figure 5
Changes in the proviral integration site landscape in the ACTIVATE study (A) Table describing the number of integration sites (IS) collected for each treatment arm at the indicated time points. (B) Heat map reflecting the contributions of individual chromosomes to the total human genome and to the numbers of detected HIV-1 integration sites from all study arms and time points. Data from Wagner et al. and from Maldarelli et al. are shown for comparison. (C) Pie charts showing the distributions of HIV-1 integration sites in genes, in non-genic regions, in the zinc-finger gene family, in KRAB-ZNF genes, and in centromeric/satellite DNA at days 0 and 28. The numbers within each pie chart indicate the total number of integration sites. (D–H) Proportions of integration sites located in genic regions (excluding ZNF genes) (D), non-genic regions (E), centromeric/satellite (F), and in the zinc-finger gene family (G) and KRAB-ZNF genes (H). The vertical bars reflect the mean with SEM,p < 0.05, Wilcoxon matched-pairs signed rank test or chi-squared tests. See also Figure S4.
Figure S4
Figure S4
HIV-1 chromosomal integration site features in the ACTIVATE study, related to Figure 5 (A) Circos plot representing the genome-wide distribution of all HIV-1 integration sites (IS) identified in the three different treatment arms. The red bar in each chromosome represents the centromere. (B) Proportions of IS collected at day 0 (n = 852) integrated in genic or non-genic regions. (C) Proportions of IS collected at day 0 in genic regions (n = 679) integrated in the opposite or same direction as the host gene transcription. (D) Proportions of IS collected at day 0 mapped within chromatin structural compartments A and B and their respective sub-compartments as determined by Hi-C sequencing data. (E) Proportions of IS collected at day 0 in different repetitive genomic elements. (F) Proportions of IS in genic regions integrated in the opposite or same direction as host gene transcription collected at days 0 and 28. (G) Proportions of IS collected at days 0 and 28 mapped within chromatin structural compartments A and B and their respective sub-compartments.
Figure 6
Figure 6
Longitudinal evolution of proviral chromosomal locations relative to epigenetic histone modifications in linear proximity (A) Circos plot representing the distribution of HIV-1 integration sites in the human genome (in blue) and the genome-wide H3K27ac peaks (in green) detected at days 0, 4, and 28 in the ACTIVATE study. (B) Representative genome browser snapshot reflecting the epigenetic environment surrounding HIV-1 integration sites. Integration sites (red arrows) were aligned to H3K27ac (in green) and H3K27me3 (in blue) Cut & Run seq data (C&R) from autologous isolated CD4+ T cells; the number of Cut & Run seq reads was calculated in ±5 kb intervals of each IS (example indicated by a red square). (C–F) Box and whisker plots showing the median, the 25th and 75th percentiles, and the maximum/minimum values of the read numbers of H3K27ac (C and E) or H3K27me3 (D and F). Data reflect Cut & Run seq reads in linear proximity to IS in genic regions at indicated study time points using the Cut & Run seq data from autologous CD4+ T cells from contemporaneous study time points (C and D) or using the autologous Cut & Run seq data collected at day 4 (E and F). p < 0.05, ∗∗p < 0.01, ∗∗∗p < 0.001, ∗∗∗∗p < 0.0001, Kruskall-Wallis test, false discovery rate (FDR)-adjusted p values are shown. See also Figure S5.
Figure S5
Figure S5
Genome-wide analysis of epigenetic histone modifications in CD4+ T cells, related to Figures 6 and 7 (A and B) Bar diagrams representing the numbers of H3K27ac (A) or H3K27me3 (B) Cut & Run seq peaks detected at day 0, 4, or 28 (p < 0.05, Friedman test followed by Dunn’s multiple comparisons). Bars indicate mean with SEM. (C) Circos plot representing the distribution of IS within the genome and the H3K27me3 peak detected at days 0, 4, and 28 after panobinostat treatment.
Figure 7
Figure 7
Longitudinal evolution of proviral chromosomal locations relative to epigenetic features in three-dimensional chromatin contact regions (A) Genome browser snapshot highlighting intra-chromosomal contact regions of HIV-1 integration sites highlighted by red arrows. Alignments of Cut & Run seq data for H3K27ac and H3K27me3 are also visualized. (B–E) Box and whisker plots showing the median, the 25th and 75th percentiles, and the maximum/minimum values of the read numbers of H3K27ac (B and D) or H3K27me3 (C and E) Cut & Run seq (C&R) reads in intrachromosomal 3D contact regions to genic integration sites (±10 kb) detected at indicated study time points. 3D contact regions of integration sites were identified using Hi-C data from primary CD4+ T cells at 20kb binning resolution. Autologous Cut & Run seq data from contemporaneous study time points (B and C) or from day 4 (D and E) are shown. p < 0.05, ∗∗p < 0.01, ∗∗∗p < 0.001, ∗∗∗∗p < 0.0001, Kruskall-Wallis test, FDR-adjusted p values are shown. See also Figure S5.

Similar articles

Cited by

References

    1. Finzi D., Hermankova M., Pierson T., Carruth L.M., Buck C., Chaisson R.E., Quinn T.C., Chadwick K., Margolick J., Brookmeyer R., et al. Identification of a reservoir for HIV-1 in patients on highly active antiretroviral therapy. Science. 1997;278:1295–1300. - PubMed
    1. Wong J.K., Hezareh M., Günthard H.F., Havlir D.V., Ignacio C.C., Spina C.A., Richman D.D. Recovery of replication-competent HIV despite prolonged suppression of plasma viremia. Science. 1997;278:1291–1295. - PubMed
    1. Ruelas D.S., Greene W.C. An integrated overview of HIV-1 latency. Cell. 2013;155:519–529. - PMC - PubMed
    1. Ho Y.C., Shan L., Hosmane N.N., Wang J., Laskey S.B., Rosenbloom D.I., Lai J., Blankson J.N., Siliciano J.D., Siliciano R.F. Replication-competent noninduced proviruses in the latent reservoir increase barrier to HIV-1 cure. Cell. 2013;155:540–551. - PMC - PubMed
    1. Lee G.Q., Orlova-Fink N., Einkauf K., Chowdhury F.Z., Sun X., Harrington S., Kuo H.H., Hua S., Chen H.R., Ouyang Z., et al. Clonal expansion of genome-intact HIV-1 in functionally polarized Th1 CD4+ T cells. J. Clin. Invest. 2017;127:2689–2696. - PMC - PubMed

Publication types

MeSH terms