. 2024 Mar 7;111(3):562-583.
doi: 10.1016/j.ajhg.2024.01.010. Epub 2024 Feb 16.

Alternative polyadenylation quantitative trait methylation mapping in human cancers provides clues into the molecular mechanisms of APA

Affiliations

Alternative polyadenylation quantitative trait methylation mapping in human cancers provides clues into the molecular mechanisms of APA

Yige Li et al. Am J Hum Genet. .

Abstract

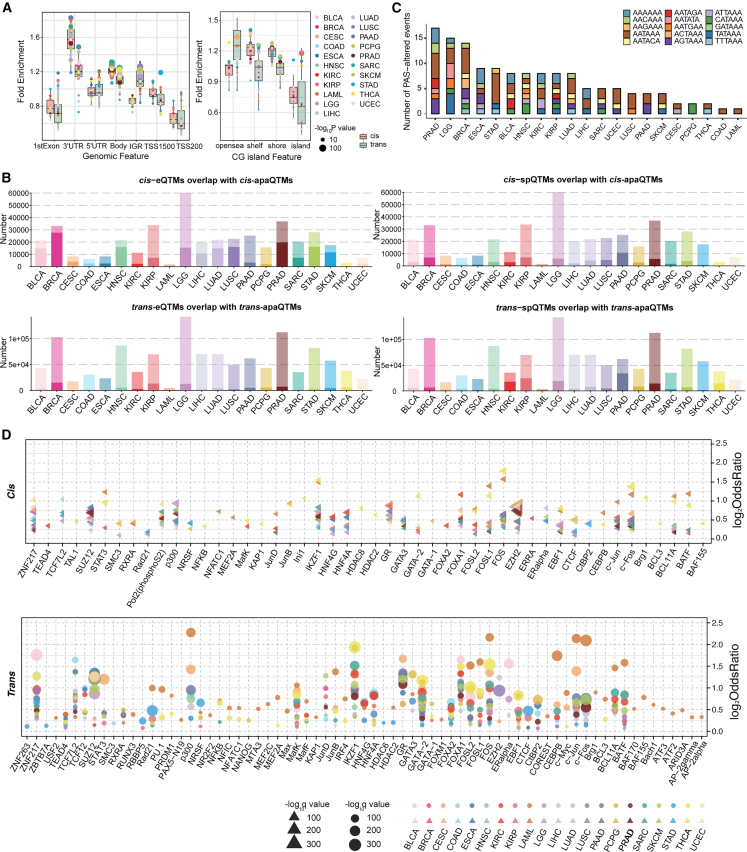
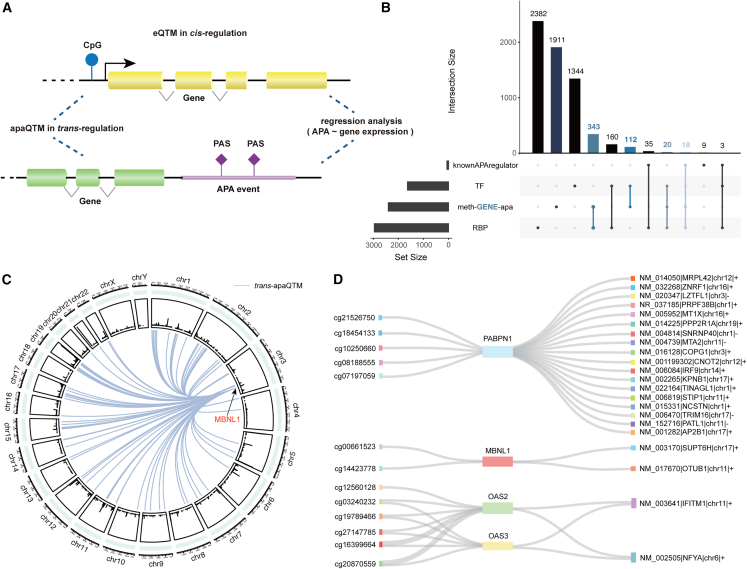
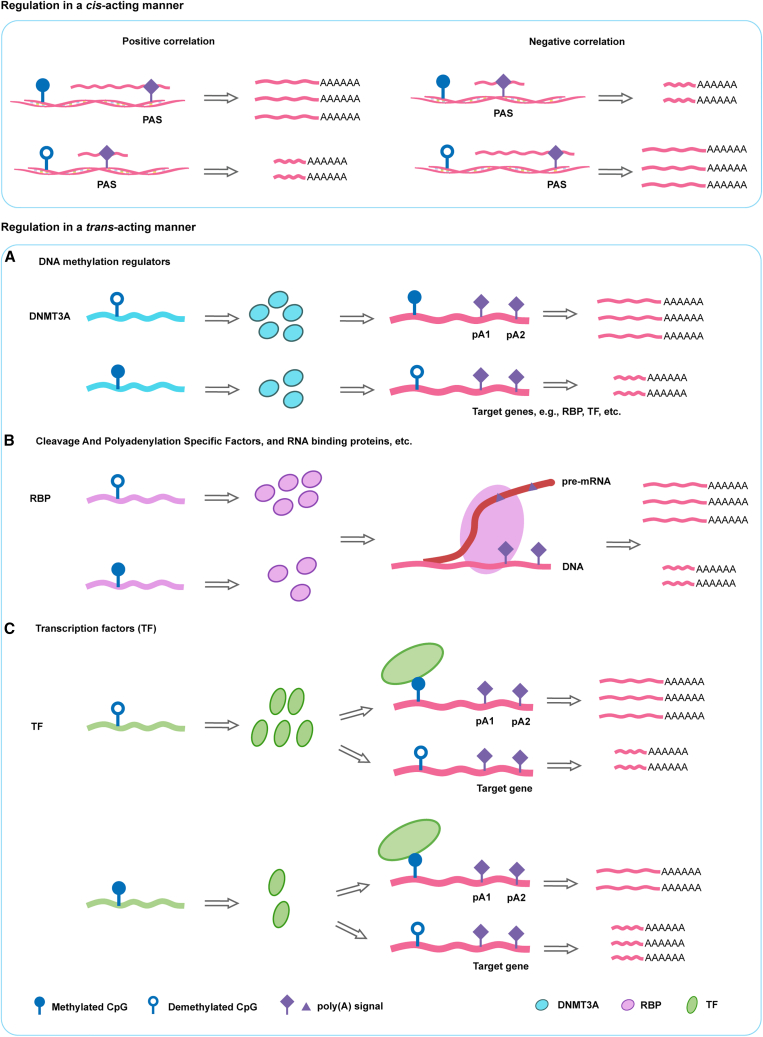
Genetic variants are involved in the orchestration of alternative polyadenylation (APA) events, while the role of DNA methylation in regulating APA remains unclear. We generated a comprehensive atlas of APA quantitative trait methylation sites (apaQTMs) across 21 different types of cancer (1,612 to 60,219 acting in cis and 4,448 to 142,349 in trans). Potential causal apaQTMs in non-cancer samples were also identified. Mechanistically, we observed a strong enrichment of cis-apaQTMs near polyadenylation sites (PASs) and both cis- and trans-apaQTMs in proximity to transcription factor (TF) binding regions. Through the integration of ChIP-signals and RNA-seq data from cell lines, we have identified several regulators of APA events, acting either directly or indirectly, implicating novel functions of some important genes, such as TCF7L2, which is known for its involvement in type 2 diabetes and cancers. Furthermore, we have identified a vast number of QTMs that share the same putative causal CpG sites with five different cancer types, underscoring the roles of QTMs, including apaQTMs, in the process of tumorigenesis. DNA methylation is extensively involved in the regulation of APA events in human cancers. In an attempt to elucidate the potential underlying molecular mechanisms of APA by DNA methylation, our study paves the way for subsequent experimental validations into the intricate biological functions of DNA methylation in APA regulation and the pathogenesis of human cancers. To present a comprehensive catalog of apaQTM patterns, we introduce the Pancan-apaQTM database, available at https://pancan-apaqtm-zju.shinyapps.io/pancanaQTM/.

Keywords: DNA methylation; Mendelian randomization analysis; alternative polyadenylation; and colocalization; cis-regulation; human cancer; pan-cancer analysis; post-transcription; quantitative trait methylation sites; trans-regulation.


Conflict of interest statement

Declaration of interests The authors declare no competing interests.

Figures

None
Graphical abstract
Figure 1
Figure 1
Atlas of apaQTM across 21 cancers (A) The number of apaQTMs and mAPAs in each cancer type. cis-apaQTMs are defined as CpG sites that affect APA in cis, cis-mAPAs represent APA events influenced by CpG sites in cis; trans-apaQTMs are CpG sites that affect APA in trans, and trans-mAPAs are APA events influenced by CpG sites in trans. (B) Distance of cis-apaQTMs from polyadenylation sites (PAS). The locations of the cis-apaQTMs in the apaQTM analysis are shown relative to the PAS for 535,336 pairs. (C) The average proportion of variation of APA events explained by CpG sites. The histogram shows the number of APA events for a given correlation coefficient. The bottom boxplot illustrates the overall distribution of the APA variation explained by CpG sites, which was at a median of 4.6% for cis and 13.6% for trans. (D) DNA methylation level was found to be associated with the usage of NFYA 3′-UTR in a previous study; here, we show that four CpG sites are associated with NFYA polyadenylation in skin cutaneous melanoma (SKCM) and stomach adenocarcinoma (STAD). Color represents correlation (r), with red indicating positive correlation and blue representing negative correlation. In these examples, the boxplots demonstrate that high levels of DNA methylation at cg11290720 are associated with increased usage of distal PAS (and therefore have higher PDUI) of NYFA in both SKCM and STAD. p values were calculated by the Wilcoxon rank-sum test. ∗∗p < 1e-04.
Figure 2
Figure 2
Features of apaQTM (A) Enrichment of cis-apaQTMs and trans-apaQTMs at positions relative to genomic regions and CpG islands. The y axis represents the fold change (FC) of the enrichment. Point size indicates significance of enrichment. Colors in points indicate the cancer types. Red boxplot represents the enrichment outcomes for apaQTMs in cis-acting regions, whereas the green boxplot represents apaQTMs in trans-regions. As shown, cis-acting CpGs exhibited enrichment predominantly within gene body regions, CpG shelves, and shores, while trans-acting CpGs were enriched within the intergenic regions (IGRs) and open seas. CpG shores: the region within 2 kb upstream and downstream of CpG island; CpG shelf: 2–4 Kb from CpG islands; open sea: other regions except for islands, shores, and shelves. TSS, transcription start site. TSS200: region from TSS to −200 nt upstream of TSS; TSS1500: region between −200 and −1,500 nt upstream of TSS. (B) Comparisons of apaQTMs with eQTMs and spQTMs, in cis and trans separately. Colors in different bars represent cancer types; the darker colors in each bar indicate the number/proportion of apaQTMs that overlap with eQTMs or spQTMs, while the lighter colors show the total number of identified apaQTMs. Although a considerable proportion of eQTMs and spQTMs overlap with apaQTMs, there remains a significant portion of apaQTMs that do not exert their influence through either gene expression or splicing regulation. (C) Overview of the apaQTMs that altered the usage of PAS motif across cancers. The x axis displays the cancer type and the y axis lists the number of apaQTMs potentially influencing the PAS signal. Of note, the canonical PAS signal (AATAAA) was found to be frequently implicated. (D) Enrichment analysis for transcription factor (TF) binding regions among cis- and trans-apaQTMs. Of the 171 binding regions of TFs from ENCODE, 48 of them were enriched in relation to cis-apaQTMs, while 71 of them to trans-apaQTMs. The x axis shows log2OddsRatio (calculated by LOLA), and the y axis lists the TFs from ENCODE. Point size indicates enrichment significance.
Figure 3
Figure 3
Prioritization of cis-mGenes (A) A schematic of the prioritization. To prioritize genes possessing apaQTM(s) that regulate 3′UTR usage in target genes (i.e., cis-mGenes), evidence from 4 criteria, i.e., apaQTM, Mendelian randomization (MR), dmCpG in tumor and normal tissues, and associations with prognosis, each conferring a score of 1, were integrated to produce a priority score (ranging from 1 to 4). (B) The number of mGenes for increasing priority scores from 1 to 4. Symbols of genes with a score of 4 are shown; 12 mGenes with such attributes were found. (C) Top: schematic illustration of TMEM8A (hg19). The top five tracks show the RefSeq gene structure, the polyA sites predicted by DaPars v2, the poly(A) sites collected by polyA_db, apaQTM locations, and the PAS motifs around the CpG site cg26944245. Green alphabets highlight the PAS motifs, and the CG in orange represents the CpG site, cg26944245. Middle: the x axis shows the corresponding chromosome location of the CpG sites, while the y axis indicates -log10 p values. Blue dots indicate -log10 p values of apaQTM analysis, red for methylation-APA MR analysis, and orange for eQTM analysis. Bottom: ChIP-seq peak of NF-κB and CTCF in chr16:420,000–437,500 (data from ENCODE), corresponding to both panels above, which clearly demonstrate the interaction of cis-apaQTMs with TFs such as NF-κB and CTCF. (D) Relationship between methylation level of the cg16579431 site and APA, expression, and splicing level of TMEM8A. The boxplots show cg16579431 being specifically associated with APA but with neither splicing nor gene expression. p values were calculated by Wilcoxon rank-sum test. ∗∗p < 0.01; NS, no significance.
Figure 4
Figure 4
The genes broadly involved in the regulation of APA events in trans (A) Top 100 trans-mGenes. The circle barplot displays the top 100 mGenes that regulate the frequency of APA events, decreasing in clockwise order. (B) The relationship between PDUI of MMAB or SDC2 with methylation levels of their respective CpG sites. Left panel shows DNA methylation level at cg19256292 was associated with the alternative usage of MMAB 3′UTR in low grade glioma (LGG). The right panel shows DNA methylation level at cg15150970 was associated with the alternative usage of SDC2 3′UTR, also in LGG. (C) Circos plot for DMNT3A summarizing (1) the DNA-binding sites of DNMT3A identified by ChIP-exo/seq studies (black bars); and (2) the genomic distribution of CpG sites associated in trans (inner connections) with APA events at the DNMT3A DNA-binding sites. Orange lines represent dAPA events in noDox vs. Dox, and blue lines represent dAPA events in ZF-D3A-wt vs. ZF-D3A-mut. (D) The relationship between PDUI of AK2 with cg15624624. Boxplot shows high DNA methylation level at cg15624624 was associated with the usage of AK2 3′UTR as implicated in thyroid cancer (THCA). (E) The TCF7L2 binding peak in AK2. The first track shows the ChIP-seq data of TCF7L2 around AK2 in HCT116 cells, and the second track represents the p values, which were obtained from ENCODE with accession no. ENCSR000EUV. (F) Network of proteins interacting with TCF7L2. Green circles represent mAPA regulated by TCF7L2 in trans and orange circles represent the genes that bind to TCF7L2. Orange-green circles represent the genes both associated with TCF7L2 in trans and binding to TCF7L2. p values were calculated by Wilcoxon rank-sum test. ∗∗p < 1e-11; ∗∗∗p < 2.2e-16.
Figure 5
Figure 5
Integrative analysis of gene expression on APA events and association in trans (A) Depiction of our hypothesis that DNA methylation sites regulate APA events in trans through control of target gene expression. By combining evidence from trans-apaQTMs, cis-eQTMs, and regression analysis of gene expression on APA events, we found some genes regulated by methylation may play an important role in APA. (B) Bar plot of intersection size of genes corresponding to trans-apaQTMs with known factors. The bar plot shows intersection size of these genes with known APA regulators, transcription factors, and RBPs. (C) Circos plot for MBNL1 summarizing (1) the DNA-binding sites of MBNL1 identified by ChIP-exo/-seq studies (black bars) and (2) the genomic distribution of CpG sites associated in trans (inner connections) with APA events at the MBNL1 DNA-binding sites. (D) The interrelationship of DNA methylation sites, gene expression, and the APA event. The Sankey plot shows the DNA methylation sites (DNAm, left), genes (middle), and the APA events (right). In this study, we chose MBNL1, PABPN1 as examples of known APA regulators, and OAS2, OAS3 as examples of RBPs. Here, we listed the CpG sites that regulate gene expression and thus affect APA events. Meanwhile, the expression of the gene is also associated with APA events.
Figure 6
Figure 6
Theorized regulatory mechanisms underlying cis- and trans-apaQTMs For cis-apaQTMs (distance between CpG site and PAS ≤1 Mb), DNA methylation sites may regulate APA positively or negatively (i.e., positive correlation being distal PAS preference in a gene with higher methylation levels, and in contrast, negative correlation being proximal PAS preference in a gene with higher methylation levels). For trans-apaQTMs (distance between CpG site and PAS >1 Mb or lie on different chromosomes), we propose three hypotheses based on analysis of apaQTMs, eQTMs, and regression analysis of gene expression with APA: (1) methylation sites on DNA methylation regulators, such as DNMT3A, modulate their own expression and alter PAS usage of target genes by widely perturbing methylation levels of genes; (2) CpG sites on RBPs or cleavage and polyadenylation-specific factors, which are known regulators of APA events, modulate gene expression of these factors, which in turn lead to the change of PAS usage; (3) similarly, CpG sites on TFs can affect gene expression of TFs themselves, thus altering PAS usage. Lastly, similar to cis-apaQTMs, trans-apaQTMs also can have positive or negative correlation with APA events (e.g., genes with higher DNA methylation levels have lower gene expression, which induce proximal PAS usage). PAS, poly(A) site; pA1, proximal PAS; pA2, distal PAS; RBP, RNA binding protein; TF, transcription factor.
Figure 7
Figure 7
Colocalization of QTMs with cancers (A) Barplot for colocalization analysis of EWAS signals and 5 cancers. Total number of colocalized EWAS signals (y axis) for 5 cancers (x axis). (B) Number of QTM-colocalizing genes, colored based on the gene colocalized with each type of QTM. Blue represents genes of eQTMs colocalizing with spQTMs and traits. Yellow indicates the genes are shared by three types of QTMs colocalizing with traits. Pink represents genes of apaQTMs colocalizing with spQTMs and traits. Green represents genes of apaQTMs colocalizing with eQTMs and traits. Red represents genes of apaQTMs colocalizing with traits only.

Similar articles

References

    1. Ha K.C.H., Blencowe B.J., Morris Q. QAPA: a new method for the systematic analysis of alternative polyadenylation from RNA-seq data. Genome Biol. 2018;19:45. doi: 10.1186/s13059-018-1414-4. - DOI - PMC - PubMed
    1. Tian B., Manley J.L. Alternative polyadenylation of mRNA precursors. Nat. Rev. Mol. Cell Biol. 2017;18:18–30. doi: 10.1038/nrm.2016.116. - DOI - PMC - PubMed
    1. Venkat S., Tisdale A.A., Schwarz J.R., Alahmari A.A., Maurer H.C., Olive K.P., Eng K.H., Feigin M.E. Alternative polyadenylation drives oncogenic gene expression in pancreatic ductal adenocarcinoma. Genome Res. 2020;30:347–360. doi: 10.1101/gr.257550.119. - DOI - PMC - PubMed
    1. Lee C.Y., Chen L. Alternative polyadenylation sites reveal distinct chromatin accessibility and histone modification in human cell lines. Bioinformatics. 2013;29:1713–1717. doi: 10.1093/bioinformatics/btt288. - DOI - PMC - PubMed
    1. Elkon R., Ugalde A.P., Agami R. Alternative cleavage and polyadenylation: extent, regulation and function. Nat. Rev. Genet. 2013;14:496–506. doi: 10.1038/nrg3482. - DOI - PubMed

Publication types

Substances

LinkOut - more resources