. 2024 Apr:261:109942.
doi: 10.1016/j.clim.2024.109942. Epub 2024 Feb 15.

Relevance of lymphocyte proliferation to PHA in severe combined immunodeficiency (SCID) and T cell lymphopenia

Affiliations

Relevance of lymphocyte proliferation to PHA in severe combined immunodeficiency (SCID) and T cell lymphopenia

Roshini S Abraham et al. Clin Immunol. 2024 Apr.

Abstract

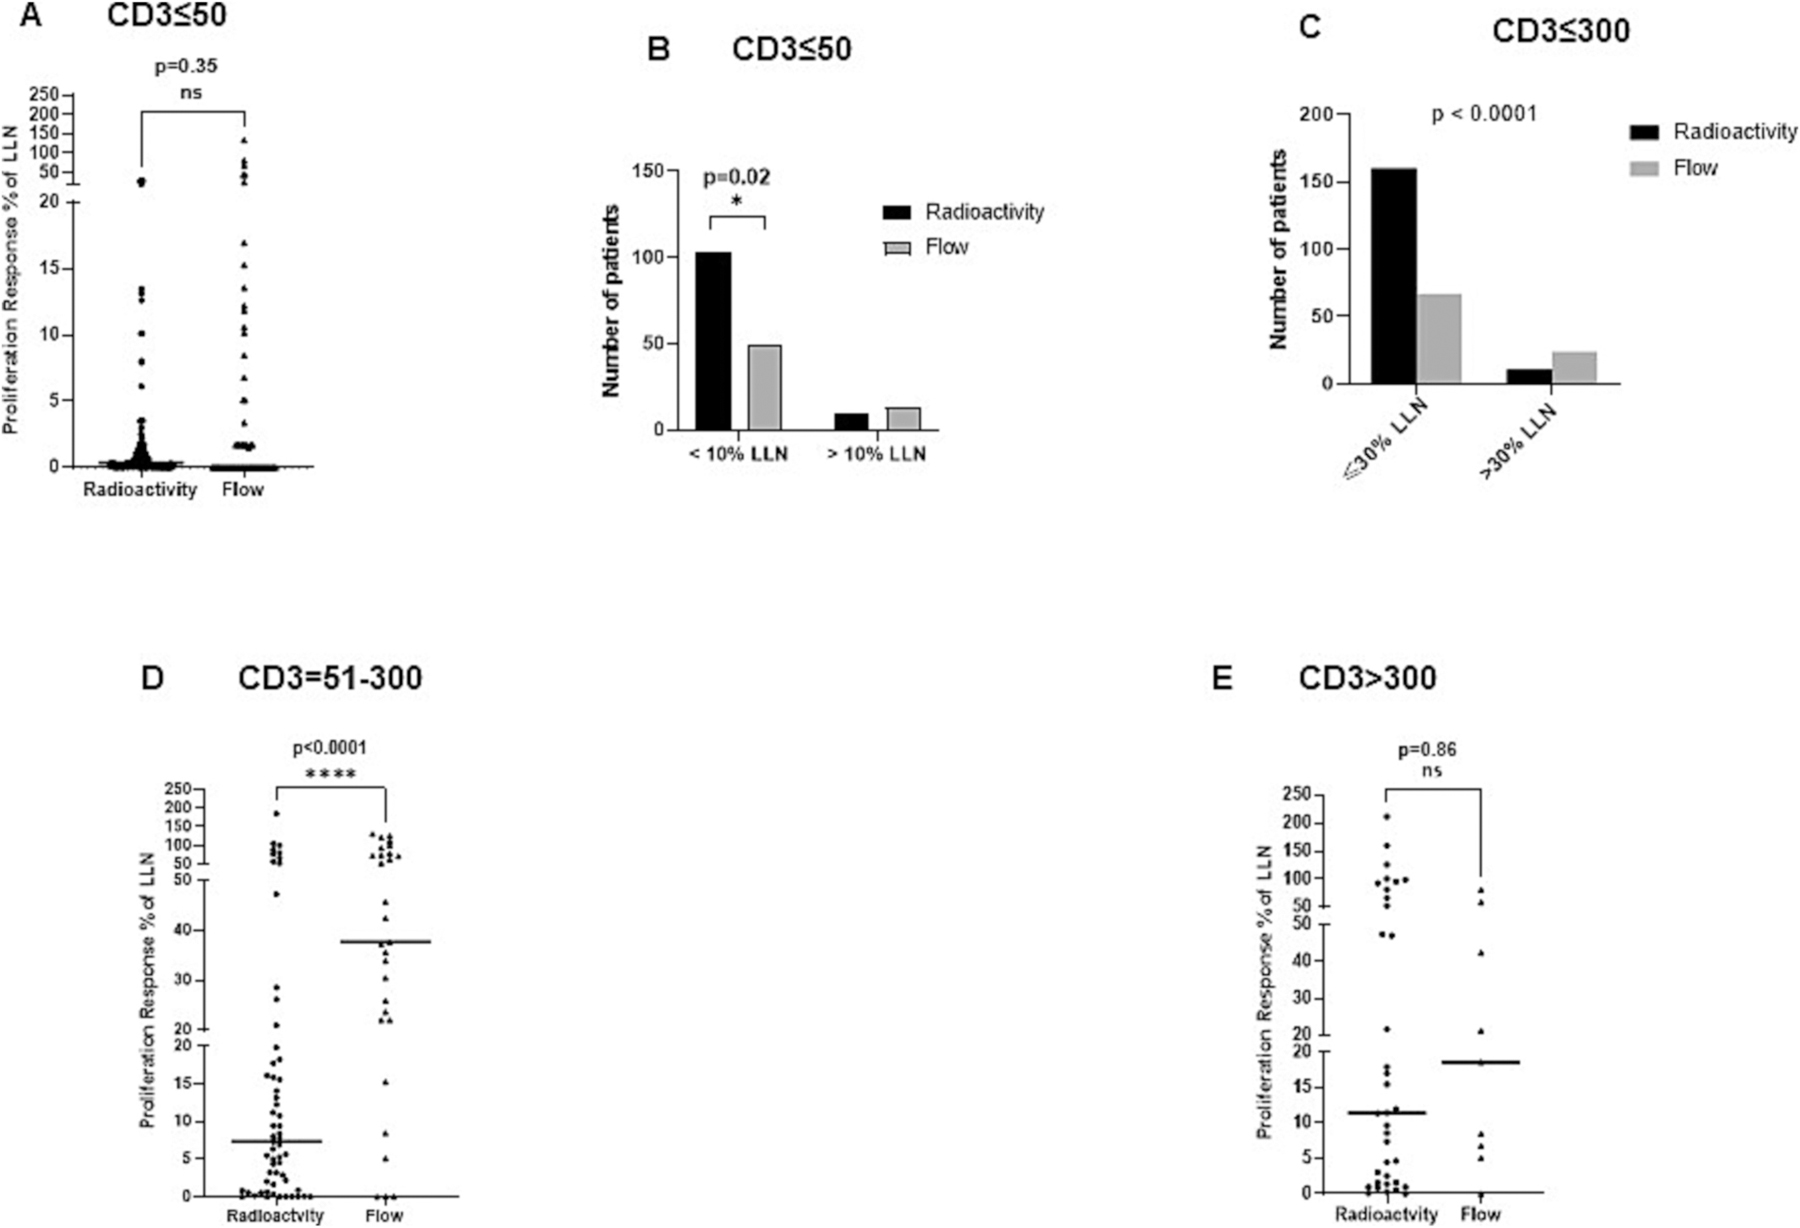
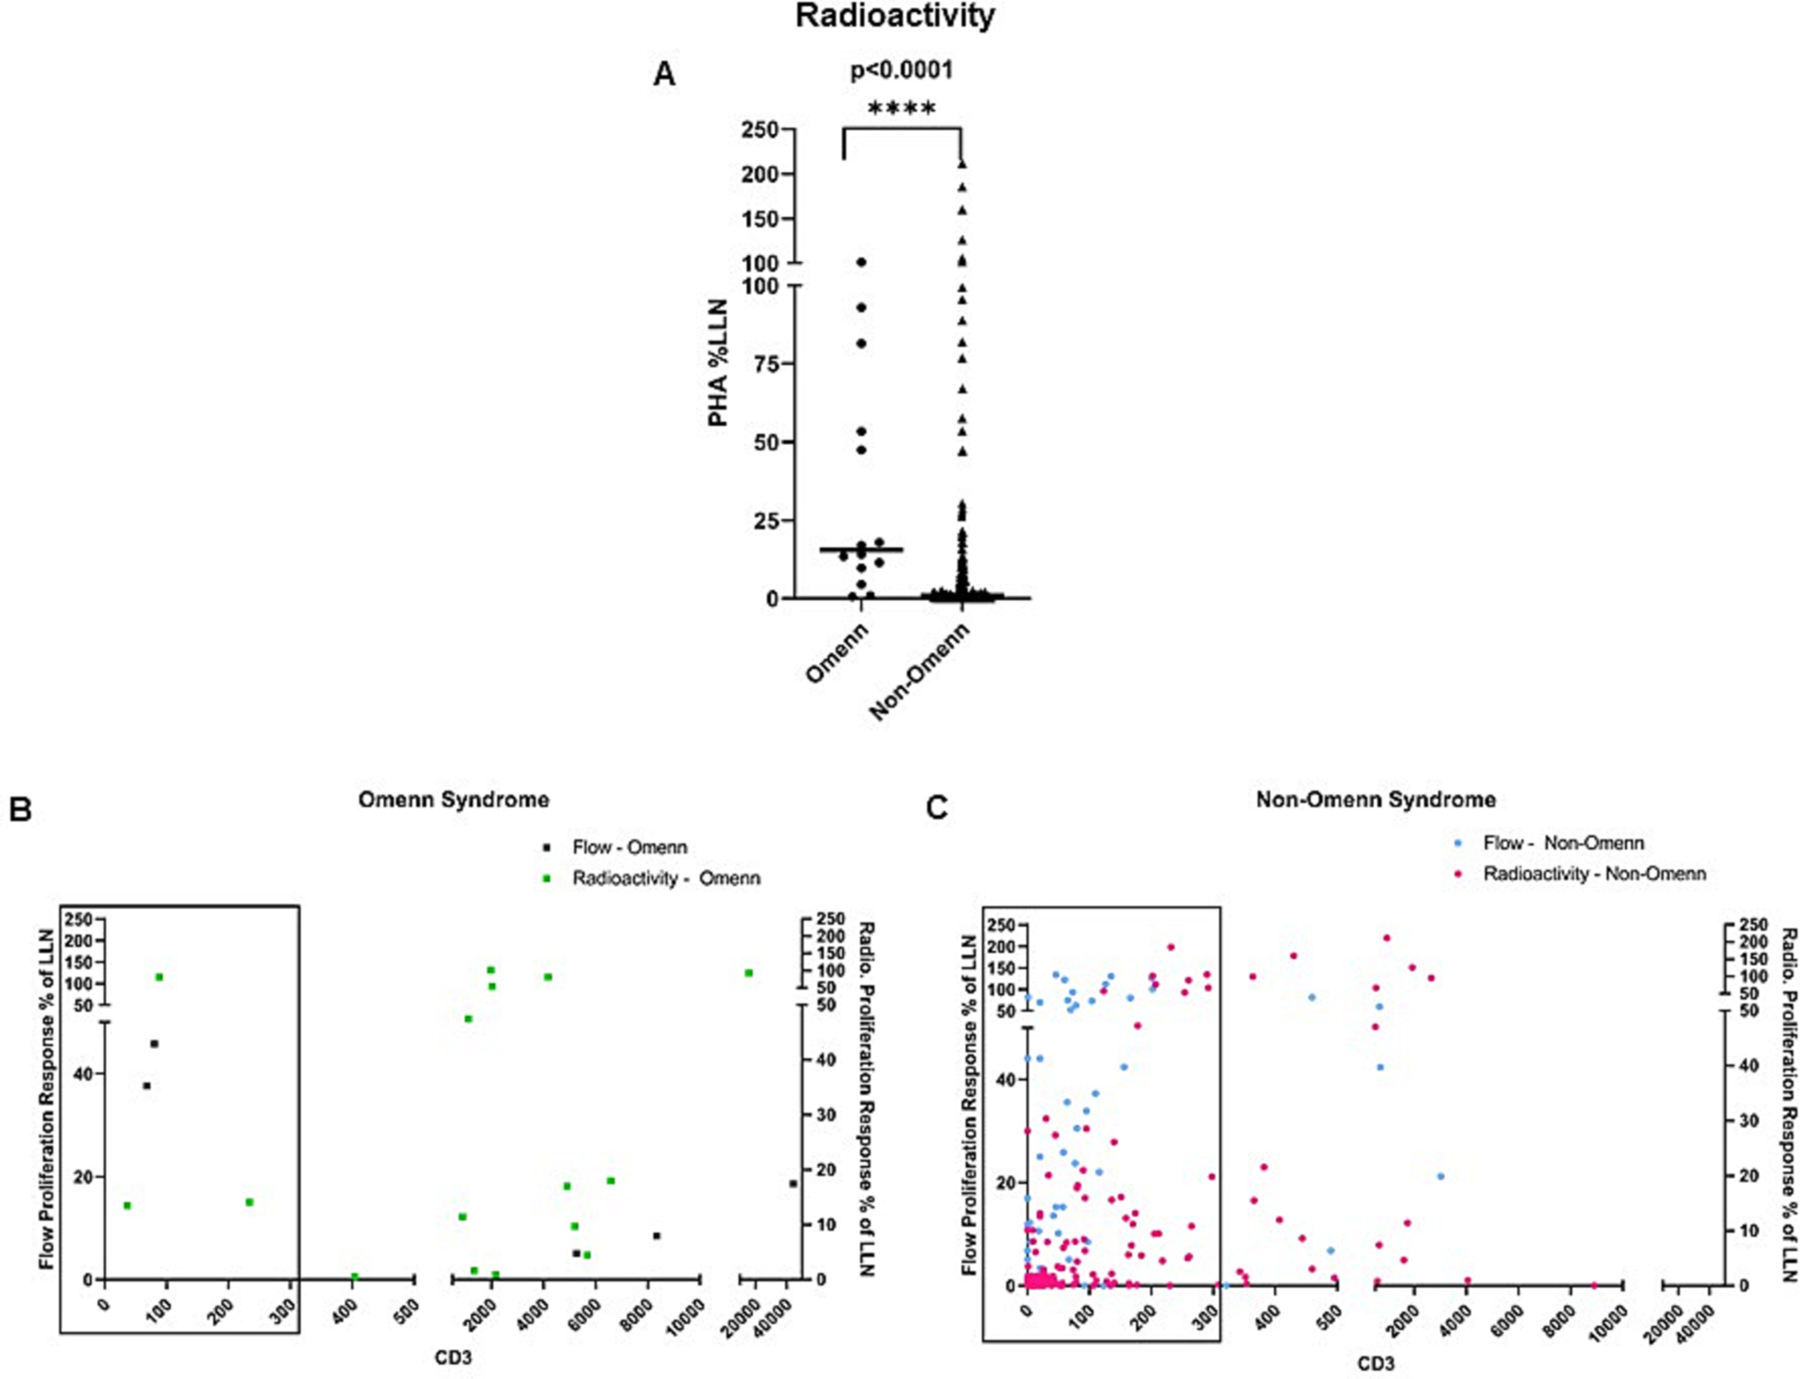
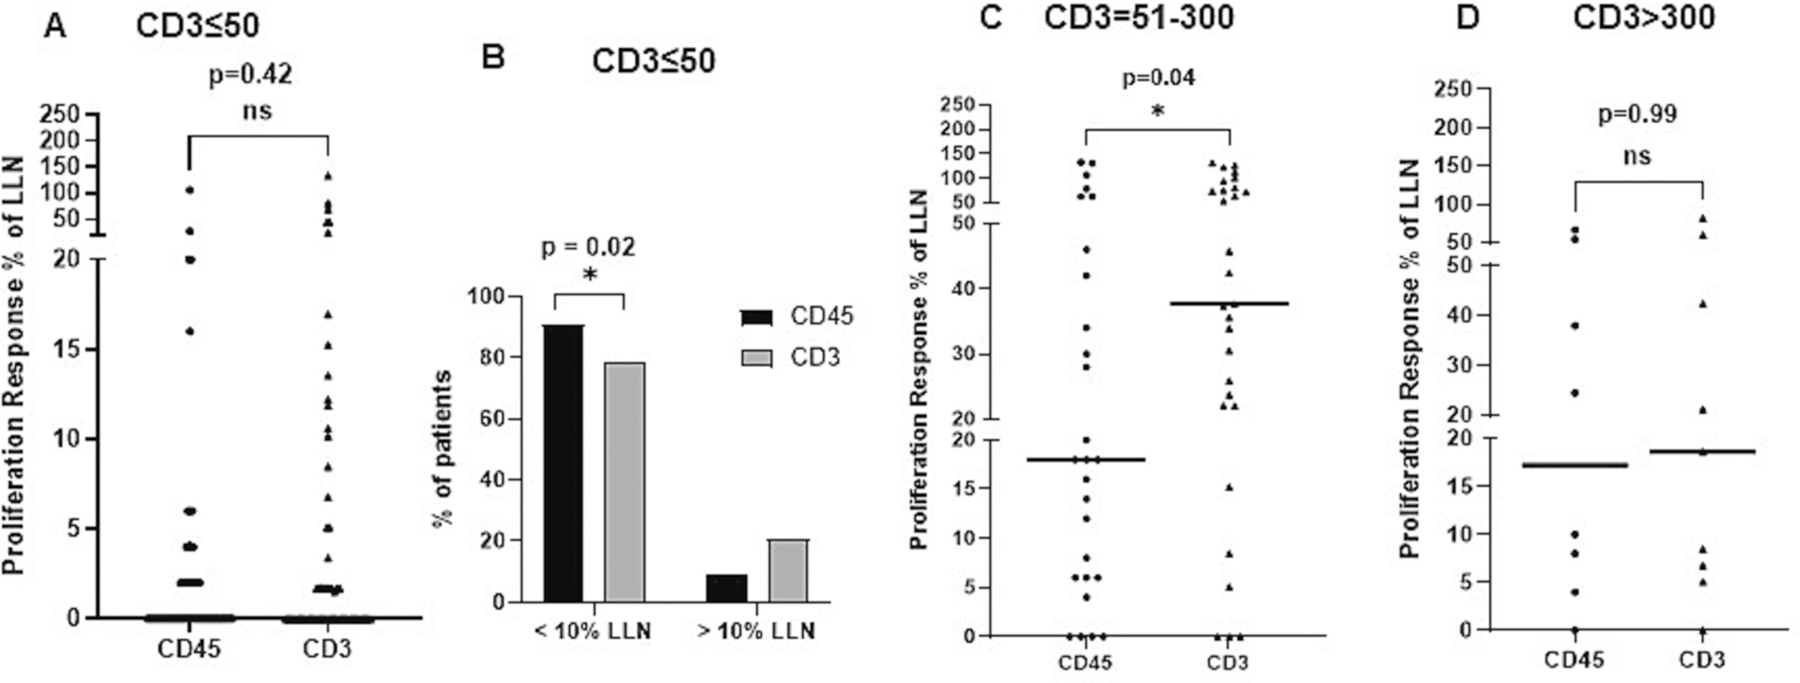
Severe combined immunodeficiency (SCID) is characterized by a severe deficiency in T cell numbers. We analyzed data collected (n = 307) for PHA-based T cell proliferation from the PIDTC SCID protocol 6901, using either a radioactive or flow cytometry method. In comparing the two groups, a smaller number of the patients tested by flow cytometry had <10% of the lower limit of normal proliferation as compared to the radioactive method (p = 0.02). Further, in patients with CD3+ T cell counts between 51 and 300 cells/μL, there was a higher proliferative response with the PHA flow assay compared to the 3H-T assay (p < 0.0001), suggesting that the method of analysis influences the resolution and interpretation of PHA results. Importantly, we observed many SCID patients with profound T cell lymphopenia having normal T cell proliferation when assessed by flow cytometry. We recommend this test be considered only as supportive in the diagnosis of typical SCID.

Keywords: Mitogen; PHA; PIDTC; SCID; Severe combined immunodeficiency; T-cell lymphopenia; T-cell proliferation.


Conflict of interest statement

Declaration of competing interest RSA has been on the advisory board for Horizon Pharma (now Amgen) and Sobi in the past 2 years but is not currently serving in that capacity. RM is an employee of Pharming Healthcare Inc., Warren, NJ. JWL is an employee and shareholder of Bluebird Bio, and has been a speaker/consultant and on the advisory board for Sobi, Inc.

Figures

Fig. 1.
Fig. 1.
Flow chart depicting selection of protocol # 6901 SCID patients for the study. A total of 395 individuals were screened for eligibility for this study and 35 patients were excluded by the PIDTC 6901 protocol. Of the remaining 362 patients, 55 were excluded and 307 were eligible for this study.
Fig. 2.
Fig. 2.
PHA induced proliferative response measured by 3H-T radioactivity-based and CD3+ T cell flow-based assays. (A) Proportion (%) of patients having ≤10% (n = 155 for 3H-T; flow: 58) and > 10% LLN (n = 3H-T: 52; Flow: 42) proliferative response to PHA measured by either method. (B) The full range of %LLN proliferation response in all patients assessed by both methods (n = 3H-T: 207; flow: 100). (C) This graph demonstrates proliferation response ≤50% LLN in patients assessed by each method. (** = p < 0.01; ns, not significant. (n = 3H-T: 188; Flow: 83). Horizontal lines represent the median of each dataset. For flow cytometry, T cells were identified using CD3 and side scatter (SSC) from the lymphocyte (CD45+/SSC) population.
Fig. 3.
Fig. 3.
Comparison of % LLN proliferative response by radioactive and CD3+ T cell flow-based methods relative to the T cell count. (A) CD3+ T cell count ≤50 cells/μL (n = 3H-T: 112, Flow: 62); (B) The number of patients with ≤10%LLN (n = 3H-T: 103, Flow: 49) or > 10%LLN (n = 3H-T: 9, Flow: 13) in the 3H-T vs. flow method and CD3+ T cell count ≤50 cells/μL (p value based on Fisher’s exact test); (C) the number of patients with a baseline CD3+ T cell count ≤300 cells/μL and ≤ 30% LLN (n = 3H-T: 160, Flow: 67) or > 30% LLN (n = 3H-T: 11, Flow: 24); (D) CD3+ T cell count = 51–300 cells/μL (n = 3H-T: 59, Flow: 29), (E) CD3+ T cell count >300 cells/μL (n = 3H-T:36, Flow: 9). The median of each dataset is depicted by a horizontal line.
Fig. 4.
Fig. 4.
PHA proliferative response in patients with or without transplacental maternal engraftment (TME). The effect of TME on the T cell proliferative response was assessed for the (A) 3H-T and (B) flow 3H-T by rank comparison of the nonparametric datasets with Mann-Whitney test. (C) Comparison between 3H-T and flow assay in SCID patients without TME, using the Mann-Whitney non-parametric test. The median of each dataset is depicted in the graph. The number of patients with TME present is 44 and with TME absent (n = 94) for 3H-T; for flow cytometry, TME present (n = 22) and TME absent (n = 62).
Fig. 5.
Fig. 5.
PHA proliferative response in patients with and without Omenn syndrome. The association of PHA proliferative response in Omenn syndrome (OS) and non-Omenn (nOS) patients measured by (A) radioactive and (B) flow cytometry was assessed using Mann-Whitney test for non-parametric rank comparison. The median of each dataset is depicted in the graph. (C) Distribution of %LLN proliferative response measured by radioactivity and flow-based assays relative to the CD3+ T cell count in Omenn Syndrome patients, and (D) non-Omenn patients. The rectangle represents patients with CD3+ T cell counts ≤300 cells/μL. There are 15 patients in the OS group and 192 patients in the nOS group evaluated by 3H-T. In the group evaluated by flow cytometry, there are 5 patients in the OS group and 95 patients in the nOS group.
Fig. 6.
Fig. 6.
Comparison of PHA proliferation for CD45+ lymphocytes or CD3+ T cells using the flow cytometry method. Data for PHA proliferation using either CD45+ lymphocytes or CD3+ T cells categorized by baseline CD3+ T cell count. (A) %LLN proliferation using either CD45+ lymphocyte (n = 58) or CD3+ T cell (n = 62) data for CD3+ T cell count ≤50 cells/μL; (B) Fisher exact test comparison of the frequency (%) of patients with either <10% LLN or > 10% LLN for CD45+ lymphocyte or CD3+ T cell data (p = 0.02); (C) %LLN proliferation using either CD45+ lymphocyte (n = 27) or CD3+ T cell (n = 29) data for CD3+ T cell count 51–300 cells/μL; (D) %LLN proliferation using either CD45+ lymphocyte (n = 8) or CD3+ T cell (n = 9) data for CD3+ T cell count >300 cells/μL.

References

    1. Chilson OP, Boylston AW, Crumpton MJ, Phaseolus vulgaris phytohaemagglutinin (PHA) binds to the human T lymphocyte antigen receptor, EMBO J 3 (1984) 3239–3245. - PMC - PubMed
    1. Abraham RS, Assessment of functional immune responses in lymphocytes, in: Rich RR, Fleisher TA, Schroeder HW Jr., Weyand CM, Corry DB, Puck JM (Eds.), Clinical Immunology: Principles and Practice, 6th ed., Elsevier, 2022.
    1. Deenick EK, Gett AV, Hodgkin PD, Stochastic model of T cell proliferation: a calculus revealing IL-2 regulation of precursor frequencies, cell cycle time, and survival, J. Immunol 170 (2003) 4963–4972. - PubMed
    1. Bussel JB, Cunningham-Rundles S, LaGamma EF, Shellabarger M, Analysis of lymphocyte proliferative response subpopulations in very low birth weight infants and during the first 8 weeks of life, Pediatr. Res 23 (1988) 457–462. - PubMed
    1. Jans J, Unger WW, Raeven EAM, Simonetti ER, Eleveld MJ, de Groot R, et al. Lack of cell cycle inhibitor p21 and low CD4(+) T cell suppression in newborns after exposure to IFN-beta, Front. Immunol 12 (2021) 652965. - PMC - PubMed

Publication types