. 2024 Jul;43(7):1074-1086.
doi: 10.1016/j.healun.2024.02.007. Epub 2024 Feb 15.

Macrophage and CD8 T cell discordance are associated with acute lung allograft dysfunction progression

Affiliations

Macrophage and CD8 T cell discordance are associated with acute lung allograft dysfunction progression

Daniel R Calabrese et al. J Heart Lung Transplant. 2024 Jul.

Abstract

Background: Acute lung allograft dysfunction (ALAD) is an imprecise syndrome denoting concern for the onset of chronic lung allograft dysfunction (CLAD). Mechanistic biomarkers are needed that stratify risk of ALAD progression to CLAD. We hypothesized that single cell investigation of bronchoalveolar lavage (BAL) cells at the time of ALAD would identify immune cells linked to progressive graft dysfunction.

Methods: We prospectively collected BAL from consenting lung transplant recipients for single cell RNA sequencing. ALAD was defined by a ≥10% decrease in FEV1 not caused by infection or acute rejection and samples were matched to BAL from recipients with stable lung function. We examined cell compositional and transcriptional differences across control, ALAD with decline, and ALAD with recovery groups. We also assessed cell-cell communication.

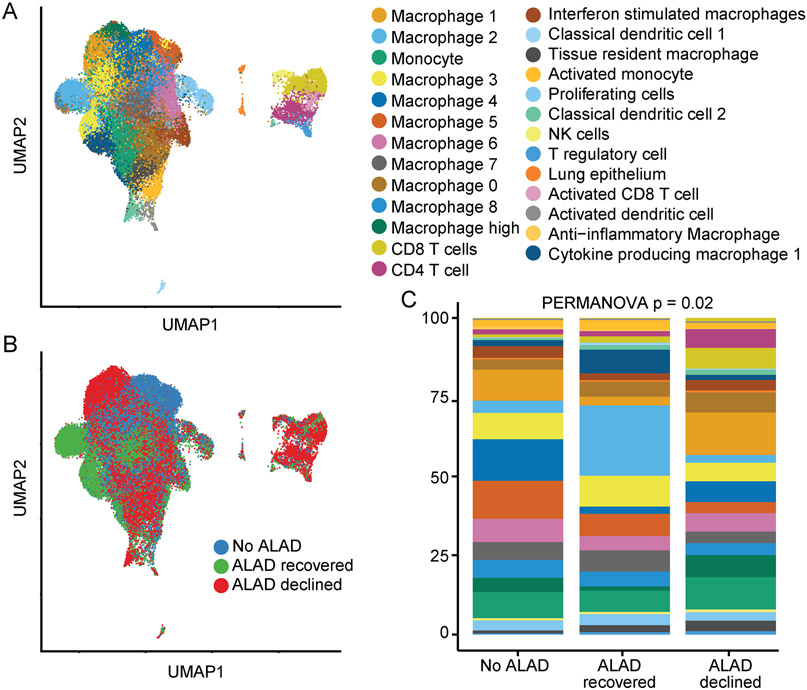
Results: BAL was assessed for 17 ALAD cases with subsequent decline (ALAD declined), 13 ALAD cases that resolved (ALAD recovered), and 15 cases with stable lung function. We observed broad differences in frequencies of the 26 unique cell populations across groups (p = 0.02). A CD8 T cell (p = 0.04) and a macrophage cluster (p = 0.01) best identified ALAD declined from the ALAD recovered and stable groups. This macrophage cluster was distinguished by an anti-inflammatory signature and the CD8 T cell cluster resembled a Tissue Resident Memory subset. Anti-inflammatory macrophages signaled to activated CD8 T cells via class I HLA, fibronectin, and galectin pathways (p < 0.05 for each). Recipients with discordance between these cells had a nearly 5-fold increased risk of severe graft dysfunction or death (HR 4.6, 95% CI 1.1-19.2, adjusted p = 0.03). We validated these key findings in 2 public lung transplant genomic datasets.

Conclusions: BAL anti-inflammatory macrophages may protect against CLAD by suppressing CD8 T cells. These populations merit functional and longitudinal assessment in additional cohorts.

Keywords: CD8 T cell; acute lung allograft dysfunction; bronchoalveolar lavage; chronic lung allograft dysfunction; lung transplant; single cell RNA sequencing.


Conflict of interest statement

Conflict of interest The authors declare no relevant conflicts of interest.

Figures

Figure 1.
Figure 1.. Participant recruitment and clinical outcomes.
(A) Lung transplant recipients were included who underwent bronchoscopy at a single institution and had sufficient sample available. Acute lung allograft dysfunction (ALAD) was defined as a 10% decrease in participants without pre-existing Chronic Lung Allograft Dysfunction (CLAD) and in the absence of infection or acute rejection. Participants with ALAD were matched 2:1 on age and time after transplant with no-ALAD control participants. (B) Stratification of study participants by FEV1 at the time of enrollment and at 1 year follow-up. (C) Alluvial diagram demonstrating outcomes for each of the participants’ samples. Note that 2 ALAD participants had “control” samples available from a period of stability preceding their ALAD events.
Figure 2.
Figure 2.. Cell populations in the bronchoalveolar lavage.
We performed dimensionality reduction using Uniform Manifold Approximation and Projection (UMAP) and semi-supervised clustering of BAL scRNAseq. (A) UMAP of the 26 distinct cell clusters in the BAL across groups. (B) UMAP shaded by ALAD status. (C) Bar plots of frequencies of individual clusters across the 3 ALAD groupings. Comparisons of proportions of cell frequency differences across ALAD groups were made using PERMANOVA.
Figure 3.
Figure 3.. Lymphocytes and macrophages identify ALAD progression.
(A) A random forest machine learning model was generated to determine which of the 26 cell cluster frequencies predicted ALAD decline (n = 17) as compared to the no ALAD (n = 17) and ALAD recovered (n = 13) groups. (B) Relative feature importance of the individual clusters from the machine learning model with an area under the curve (AUC) fit of 0.65 (95% Confidence Interval 0.5 – 0.78). We show individual cell cluster frequencies for the top 6 populations by feature importance: (C) T regulatory cells, (D) Activated CD8 T cells, (E) Anti-inflammatory macrophages, (F) CD8 T cells, (G) NK cells, and (H) Macrophage 6. Box and whisker plots display individual data points bound by boxes at 25th and 75th percentiles and medians depicted with bisecting lines. Differences were assessed using the Mann-Whitney U test with p<0.05 considered significant.
Figure 4.
Figure 4.. Anti-inflammatory macrophage and activated CD8 T cell profiling.
We sought to identify the functional profiles of these 2 cell clusters (A). The top 15 differentially expressed genes in anti-inflammatory macrophages. (B) Results from the pathway analysis of these transcripts. (C). The top 15 differentially expressed genes defining the activated CD8 T cell cluster. (D) Results from the pathway analysis of these CD8 T cell genes. (E) The top 15 surface markers in the activated CD8 T cell cluster. (F) Activated CD8 T cells show transcriptional and surface expression of markers consistent with a tissue resident effector memory (TREM) phenotype. The top differentially transcribed genes and surface markers were defined by false discovery rate (FDR) p-values < 0.05 and stratified by relative fold change.
Figure 5.
Figure 5.. Cell communication across cluster landscape.
We modeled the interaction strength between the cell clusters across the cohort based on predicted receptor and ligand pairings. (A) There was significant cell communication across cell clusters. (B) Anti-inflammatory macrophages and CD8 T cell cluster signal direction and interaction strength. Anti-inflammatory macrophages had out-going signals with significant transduction to CD8 and Activated CD8 T cells. The CD8 T cells had in-coming signals from all other populations. (C) Predicted ligand-receptor interactions between anti-inflammatory macrophages and CD8 T cells.
Figure 6.
Figure 6.. Discordance in anti-inflammatory macrophages and activated CD8 T cells predicts allograft failure.
(A) Scatter plot of activated CD8 T cells and anti-inflammatory macrophages colored by ALAD status with lines fit via linear regression. (B) Ratio of counts of activated CD8 T cells to anti-inflammatory macrophages in ALAD groups. (C) Kaplan Meier plot recipients with high activated CD8 T cells (> median) and low anti-inflammatory macrophages (<median, n = 10) compared to recipients without this cellular discordance (n = 35). P-values determined by (A) linear regression, (B) Mann-Whitney U Test, and (C) Cox Proportional Hazards. Box and whisker plot displays individual data points bound by boxes at 25th and 75th percentiles and medians depicted with bisecting lines.
Figure 7.
Figure 7.. Validation of findings in two separate lung transplant cohorts.
Within an existing BAL sequencing cohort of no CLAD participants (n = 8) and participants with incipient CLAD (n = 9), we constructed metagene scores for anti-inflammatory macrophages (AIM) and activated CD8 T cells (aCD8). (A) A heatmap showing the relative expression of the gene score components by cell cluster type. (B) Anti-inflammatory macrophage gene score was decreased in CLAD BAL. (C) Activated CD8 T cell gene score was numerically increased in CLAD BAL. Separately, in a tissue gene expression cohort of CLAD tissue (n = 3) and no CLAD tissue (n = 1), we measured the same gene expression in these 2 cell clusters (D). Around CLAD airways, anti-inflammatory macrophage genes were decreased (E) and activated CD8 T cells were increased as compared to no CLAD airways. Box and whisker plot displays individual data points bound by boxes at 25th and 75th percentiles and medians depicted with bisecting lines. Comparisons in gene scores across CLAD conditions were made using Mann-Whitney U tests in the BAL cohort and linear regression modeling sample as a random effect.

Comment in

References

    1. Chambers DC, Perch M, Zuckermann A, et al.: The International Thoracic Organ Transplant Registry of the International Society for Heart and Lung Transplantation: Thirty-eighth adult lung transplantation report - 2021; Focus on recipient characteristics. J Heart Lung Transplant 2021;40:1060–72. - PMC - PubMed
    1. Graham CN, Watson C, Barlev A, Stevenson M, Dharnidharka VR: Mean lifetime survival estimates following solid organ transplantation in the US and UK. J Med Econ 2022;25:230–7. - PubMed
    1. Venado A, Kukreja J, Greenland JR: Chronic Lung Allograft Dysfunction. Thorac Surg Clin 2022;32:231–42. - PubMed
    1. Verleden GM, Glanville AR, Lease ED, et al.: Chronic lung allograft dysfunction: Definition, diagnostic criteria, and approaches to treatment-A consensus report from the Pulmonary Council of the ISHLT. J Heart Lung Transplant 2019;38:493–503. - PubMed
    1. Tissot A, Danger R, Claustre J, Magnan A, Brouard S: Early Identification of Chronic Lung Allograft Dysfunction: The Need of Biomarkers. Front Immunol 2019;10:1681. - PMC - PubMed

Publication types