. 2024 Feb 17;15(1):1471.
doi: 10.1038/s41467-024-45719-9.

Time-integrated BMP signaling determines fate in a stem cell model for early human development

Affiliations

Time-integrated BMP signaling determines fate in a stem cell model for early human development

Seth Teague et al. Nat Commun. .

Abstract

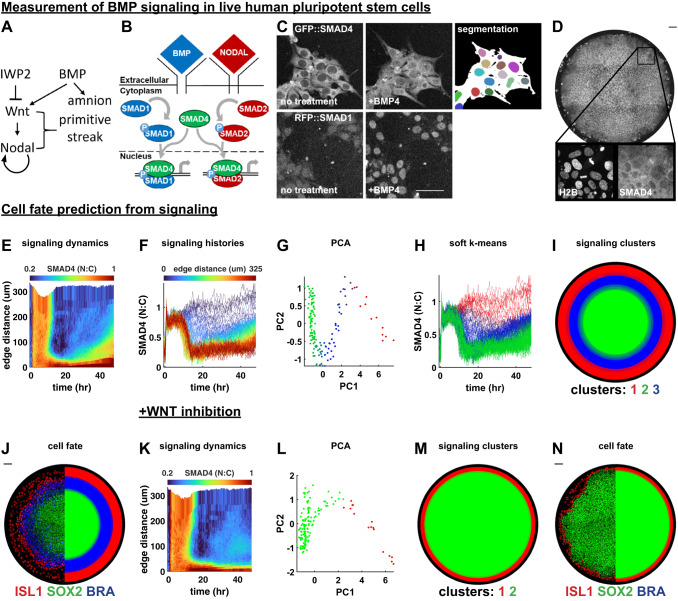
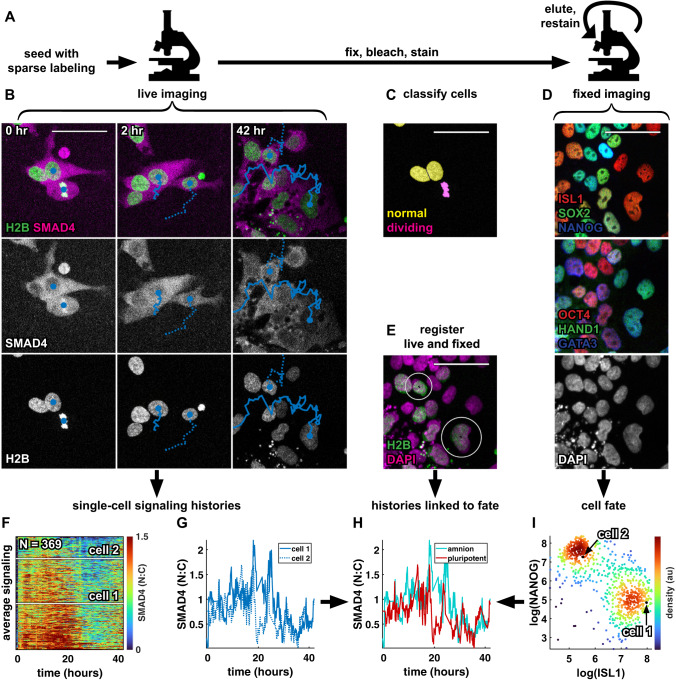
How paracrine signals are interpreted to yield multiple cell fate decisions in a dynamic context during human development in vivo and in vitro remains poorly understood. Here we report an automated tracking method to follow signaling histories linked to cell fate in large numbers of human pluripotent stem cells (hPSCs). Using an unbiased statistical approach, we discover that measured BMP signaling history correlates strongly with fate in individual cells. We find that BMP response in hPSCs varies more strongly in the duration of signaling than the level. However, both the level and duration of signaling activity control cell fate choices only by changing the time integral. Therefore, signaling duration and level are interchangeable in this context. In a stem cell model for patterning of the human embryo, we show that signaling histories predict the fate pattern and that the integral model correctly predicts changes in cell fate domains when signaling is perturbed. Our data suggest that mechanistically, BMP signaling is integrated by SOX2.


Conflict of interest statement

The authors declare no competing interests.

Figures

Fig. 1
Fig. 1. Sgnaling dynamics in a stem cell model for human gastrulation predict fate pattern.
A Schematic of the BMP, Wnt, and Nodal signaling hierarchy and cell types induced by these signals. B SMAD1 translocates to the nucleus in response to BMP while SMAD4 translocates to the nucleus in response to both BMP and Nodal. C Nuclear translocation of fluorescently tagged SMAD4 (top) and SMAD1 (bottom) proteins in response to BMP4 treatment, and segmentation of nuclei (color) and cell bodies (white) in cells expressing GFP::SMAD4. D Micropatterned colony of RUES2 cells expressing GFP::SMAD4 at t = 30 hours after treatment with BMP4. E A heatmap of average spatiotemporal SMAD4 signaling dynamics (kymograph) in N = 5 micropatterned colonies treated with BMP4. F Plot of radially averaged signaling histories colored for distance from the colony edge. G Scatterplot of the first two principal components (PCs) of radially averaged signaling histories, colored for soft k means cluster assignment. H Plot of radially averaged signaling histories colored for cluster assignment. I Signaling clusters; each radial bin is assigned a color according to the dominant cluster of signaling histories within that bin, over N = 5 replicate colonies. J Immunofluorescence image of ISL1, SOX2, and BRA in a BMP4-treated colony (left) and the discretized fate map, averaged over replicate colonies (right). Each radial bin is colored for the dominant cell fate within that bin. K SMAD4 kymograph averaged over N = 5 replicate colonies treated with BMP4 and WNTi. L Scatterplot of the first two PCs of radially averaged signaling histories, colored for cluster assignment split 1 in Supplementary Fig. 1S (see methods). M Signaling clusters, created as in I. N IF image of a colony (left) and average fate map (right). Scale bars 50um. Source data are provided in a Source Data file.
Fig. 2
Fig. 2. A pipeline relating single-cell signaling history to fate.
A Schematic of the experimental procedure to collect data on signaling histories and cell fate. B Example images showing two tracked cells 0, 2, and 42 hours after treatment with BMP4 + WNTi in the SMAD4 and H2B channels. Nuclear centroids are marked with a solid blue circle, tracks are indicated by a solid and dashed line. C Nuclei with overlaid classification of cells as non-dividing (yellow) or dividing (magenta). D Iterative immunofluorescence (IF) data showing an initial stain for ISL1, SOX2, and NANOG (top), followed by a restain for OCT4, HAND1, and GATA3 (middle), in the same field of view as the live data in B. Bottom panel shows the DAPI image from the first round of fixed imaging. E Two-color overlay of the live (sparsely labeled) H2B image at 42 hours in B (green) and the DAPI image in D (magenta). The two cells for which tracks are shown in B are circled in white. F Heatmap of all single-cell signaling histories collected in a single experiment (N = 369 histories), sorted by mean signaling level. Signaling histories of the two cells tracked in B are marked by white lines. G Signaling histories of the two cells tracked in B. H Signaling histories of the two cells tracked in B, colored for fate after matching nuclei from the live imaging time lapse to nuclei in the fixed IF data. I Scatterplot of log-transformed ISL1 and NANOG intensity in single cells, colored for local density, showing a bimodal distribution of ISL1+ amnion-like cells and NANOG+ pluripotent cells. Scale bar 50um. Source data are provided in a Source Data file.
Fig. 3
Fig. 3. The time-integral and duration of BMP signaling correlate with cell fate at the single-cell level.
A Plot of 50 out of 369 signaling histories, population mean overlaid as a bold black line. B Separation of signaling histories along the first three principal components (PCs). Average of histories one standard deviation above or below the mean along each component are shown in red and blue, respectively. C Example signaling history with a sigmoidal fit to determine signaling features. D Scatterplot of duration vs. PC1 with and without denoising using MAGIC. E Signaling histories from A after denoising. F Correlation between signaling features and PCs across cells. G Correlation of fate marker expression across cells. H Mean signaling histories for amnion-like and pluripotent cells. I Heatmap of signaling histories sorted by log(ISL1 / NANOG). J Scatterplot of log(ISL1 / NANOG) against signaling integral for single cells, with and without denoising. P value calculated with the t-statistic in the MATLAB function corrcoef. K antibody stains for ISL1 and NANOG at different cell densities and BMP4 concentrations. L Mean signaling for amnion and pluripotent fate for each condition in K. M Heatmap of signaling histories sorted by log(ISL1 / NANOG). N Scatterplot of log(ISL1 / NANOG) against signaling integral for single cells, with and without denoising. Color is by condition, indicated with color borders around images in K. P value is as in J. O Heatmap of kernel density estimate after denoising of conditional distributions of log(ISL1 / NANOG) with respect to duration and signaling integral overlaid with a scatterplots of data points before (circles) and after denoising (dots). Dashed lines show separation of cells into amnion-like and pluripotent based on log(ISL1 / NANOG) or on signaling features. The percentage of cells in each quadrant is indicated, with correct assignments in the top right and bottom left quadrant of each heatmap. P Confusion matrix showing the performance of a neural network (NN) and a support vector machine (SVM) in classifying cells as amnion-like or pluripotent using the full signaling history. Source data are provided in a Source Data file.
Fig. 4
Fig. 4. The time-integral of BMP signaling controls differentiation.
A Diagram of relevant signaling history features. B–C Hypothetical set of signaling histories for which a combined level and duration threshold model makes a different prediction of cell fate than an integral threshold model. D Schematic of the experimental procedure used to control the level and duration of signaling. E (left) Mean signaling for different durations without initial BMPRi. (right) Mean signaling for different duration with an initial BMPRi treatment of 10 nM. F Duration and SMAD4 signaling integral thresholds based on logistic sigmoid fit for two signaling levels. Data in F, H, J are presented as mean +/− standard deviation (SD) over N = 4, 3, and 3 images, respectively. Thresholds in any signaling feature are defined by 50% differentiation. G Mean signaling for 8 doses of BMP inhibition with LDN193189 for durations of 42 hr (left) or 32 hr (right). H SMAD4 signaling level and integral thresholds for both signaling durations. I Mean signaling for single pulse controls (left) compared to mean signaling for multiple pulses of BMP signaling (right). J Differentiation vs. integrated signaling for one vs. multiple pulses. K Kymograph of average BMP signaling for N = 3 colonies treated with 200 ng/mL BMP4 in the presence of WNT inhibitor, treated with BMP inhibitor at 30 hours. L IF data showing amnion differentiation for each signaling duration (scale bar 50um). M Percent differentiation against mean signaling level before shutdown for each duration (left) and against signaling integral (right). Each point represents a radial bin (a fixed distance from the colony edge). Error bars are standard deviation over N = 3 colonies per condition. Source data are provided in a Source Data file.
Fig. 5
Fig. 5. BMP signaling may be integrated by SOX2.
A Normalized expression of SOX2, GATA3, and ISL1 over time for different signaling levels, measured with time-series IF. Data presented as mean +/− standard deviation (SD) across N = 6 images. A box outlined in black shows the data points corresponding to image data in D. B Average nuclear SMAD4 signaling level for each treatment condition in A, determined using SMAD4 dynamics measured in the same conditions and shown in Supplementary Fig. 5B. C Cross section of A showing SOX2 and GATA3 expression at 12 hours, plotted against SMAD4 signaling integral. D Example IF image data for SOX2 in each treatment condition at 36 hours, corresponding to the points boxed in A. Scale bar 50um. E Heatmap of time-series bulk RNA seq data (normalized counts per million) with genes on the y-axis ordered by hierarchical clustering. The cluster dendrogram is shown to the left, with lines colored for discrete cluster assignment, and white lines are drawn on the heatmap to separate clusters. The location in the heatmap of genes also measured with IF is indicated to the right. F Example bulk RNA seq dose-response data is shown for SOX2 with a linear least squares fit of SOX2 with respect to SMAD4 signaling level. The slope of the least squares fit and the correlation coefficient between SOX2 and SMAD4 signaling level are indicated. G Scatterplot of the slope of each gene with respect to SMAD4 signaling and that gene’s correlation with SMAD4 signaling in the dose-response bulk RNA seq data, as determined in F. Locations in the scatterplot of genes for which we also have IF data are indicated. Transcription factors are marked in blue, other transcripts in gray. Source data are provided in a Source Data file.
Fig. 6
Fig. 6. SOX2 perturbation reduces amnion-like differentiation in agreement with a mathematical model.
A Plot of the change in each GFP::SOX2 curve in Supplementary Fig. 5H over the first 16 hours of differentiation against SMAD4 signaling integral in that time. SMAD4 integral is determined in each condition based on data in Fig. 4. A dashed line indicates a linear fit of the data. B Measured (thick, solid lines) and simulated (thin, semi-transparent lines) GFP::SOX2 dynamics over the course of 42 hours of differentiation with indicated treatments applied for 42 (left) or 32 (right) hours. C Measured (left) and simulated (right) ISL1 level as a function of SMAD4 integral for the conditions in B. Data presented as mean +/- SD across N = 4 images. D Equations used to model the regulation of SOX2 and ISL1 by BMP-SMAD4 signaling, and their mutual inhibition. E–H Example IF data (E) and quantification showing ISL1 (F), SOX2 (G), and NANOG (H) expression after 42 hours of differentiation in standard culture with 50 ng/mL BMP4 + WNTi, +/- doxycycline from 12 to 24 hours. Violin plots show expression distributions over n = 2867 cells (-DOX) and n = 3081 cells (+DOX) in one of two independent experiments. The box plot within the violin shows the 25%, 50% (median), and 75% quartiles, with whiskers to the maximum and minimum values in the data. I–K Example IF data (I) and radial expression profiles (J, K) in micropatterned colonies after 42 h of differentiation with 50 ng/mL BMP4 + WNTi, without (J) or with (K) the addition of doxycycline from 12 to 24 hours. Scale bars 50um. Source data are provided in a Source Data file.

Update of

Similar articles

Cited by

References

    1. Nusse R, Clevers H. Wnt/β-Catenin Signaling, Disease, and Emerging Therapeutic Modalities. Cell. 2017;169:985–999. doi: 10.1016/j.cell.2017.05.016. - DOI - PubMed
    1. David CJ, Massagué J. Contextual determinants of TGFβ action in development, immunity and cancer. Nat. Rev. Mol. Cell Biol. 2018;19:419–435. doi: 10.1038/s41580-018-0007-0. - DOI - PMC - PubMed
    1. Ornitz DM, Itoh N. The Fibroblast Growth Factor signaling pathway. Wiley Interdiscip. Rev. Dev. Biol. 2015;4:215–266. doi: 10.1002/wdev.176. - DOI - PMC - PubMed
    1. Arnold SJ, Robertson EJ. Making a commitment: cell lineage allocation and axis patterning in the early mouse embryo. Nat. Rev. Mol. Cell Biol. 2009;10:91–103. doi: 10.1038/nrm2618. - DOI - PubMed
    1. Katagiri T, Watabe T. Bone Morphogenetic Proteins. Cold Spring Harb. Perspect. Biol. 2016;8:a021899. doi: 10.1101/cshperspect.a021899. - DOI - PMC - PubMed