. 2024 Feb 17;22(1):133.
doi: 10.1186/s12964-024-01514-z.

Identification of myoferlin as a mitochondria-associated membranes component required for calcium signaling in PDAC cell lines

Affiliations

Identification of myoferlin as a mitochondria-associated membranes component required for calcium signaling in PDAC cell lines

Sandy Anania et al. Cell Commun Signal. .

Abstract

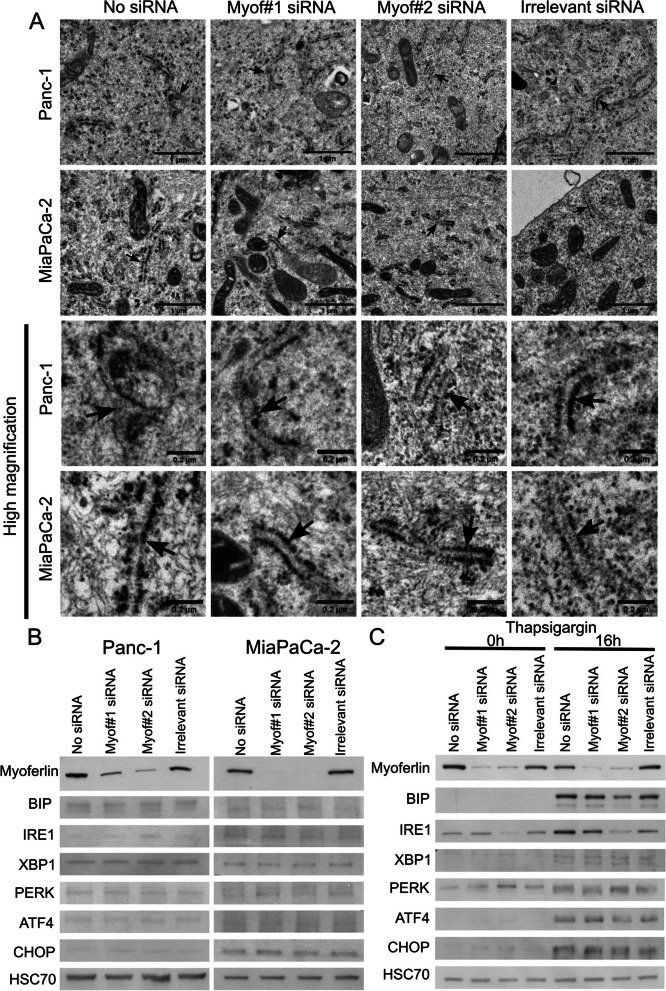
Background: Pancreatic ductal adenocarcinoma is an aggressive cancer type with one of the lowest survival rates due to late diagnosis and the absence of effective treatments. A better understanding of PDAC biology will help researchers to discover the Achilles' heel of cancer cells. In that regard, our research team investigated the function of an emerging oncoprotein known as myoferlin. Myoferlin is overexpressed in PDAC and its silencing/targeting has been shown to affect cancer cell proliferation, migration, mitochondrial dynamics and metabolism. Nevertheless, our comprehension of myoferlin functions in cells remains limited. In this study, we aimed to understand the molecular mechanism linking myoferlin silencing to mitochondrial dynamics.

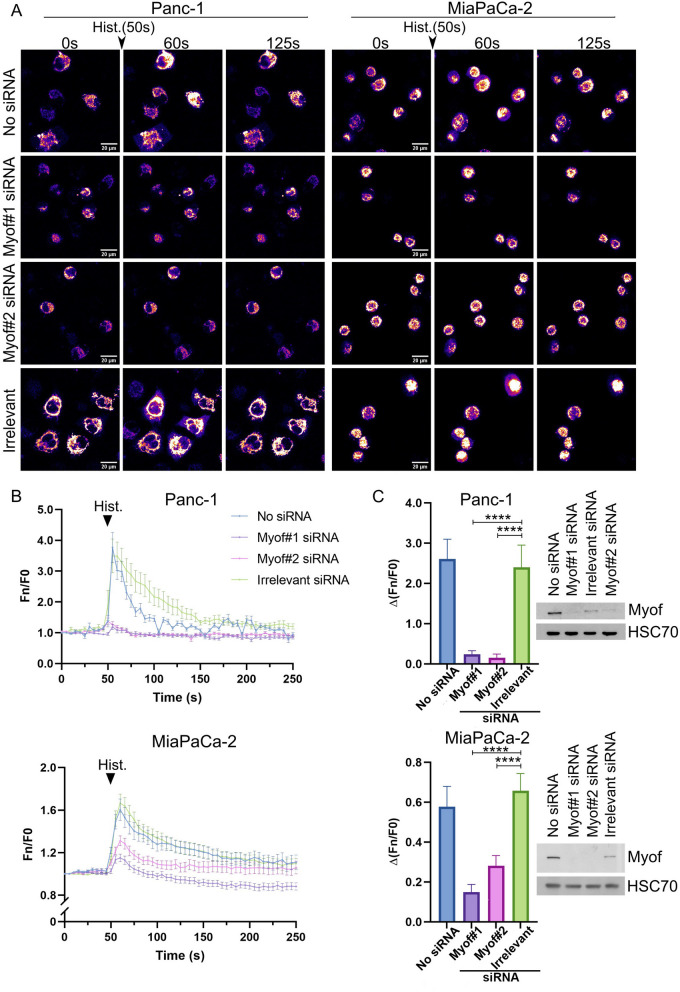
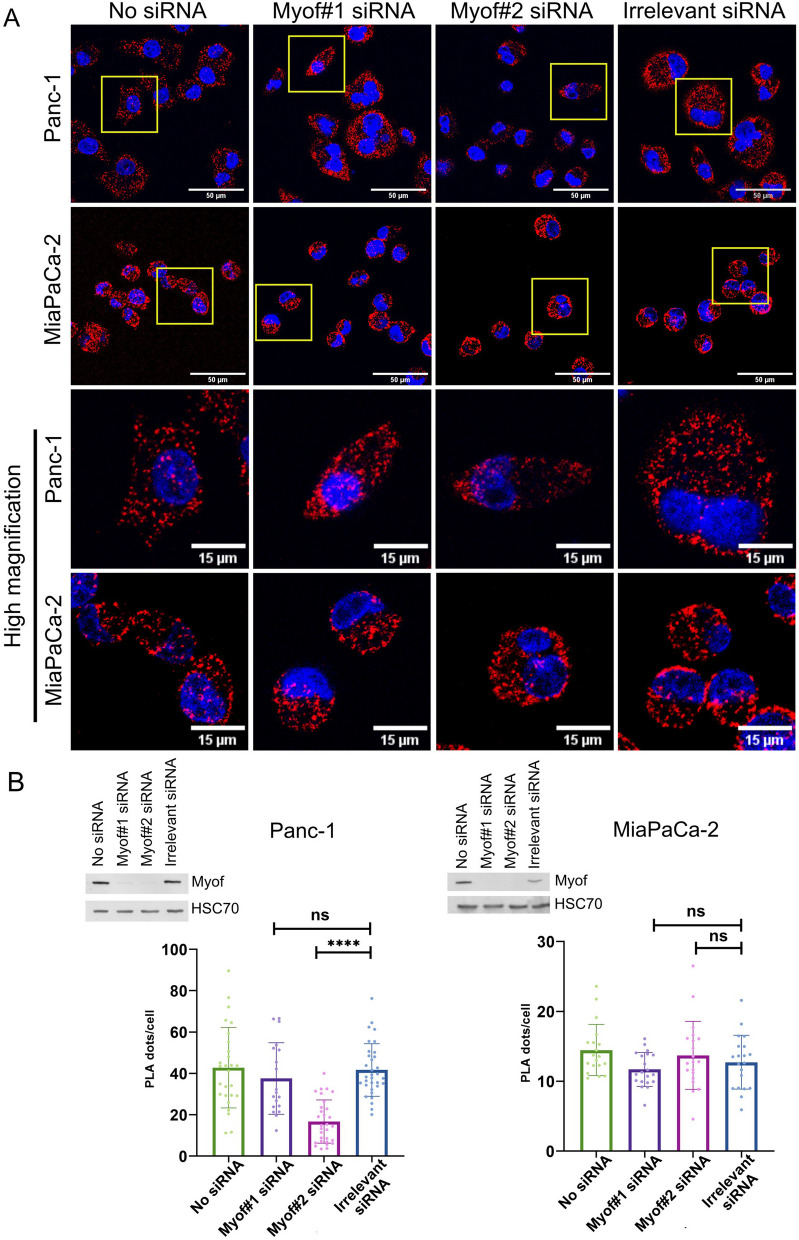
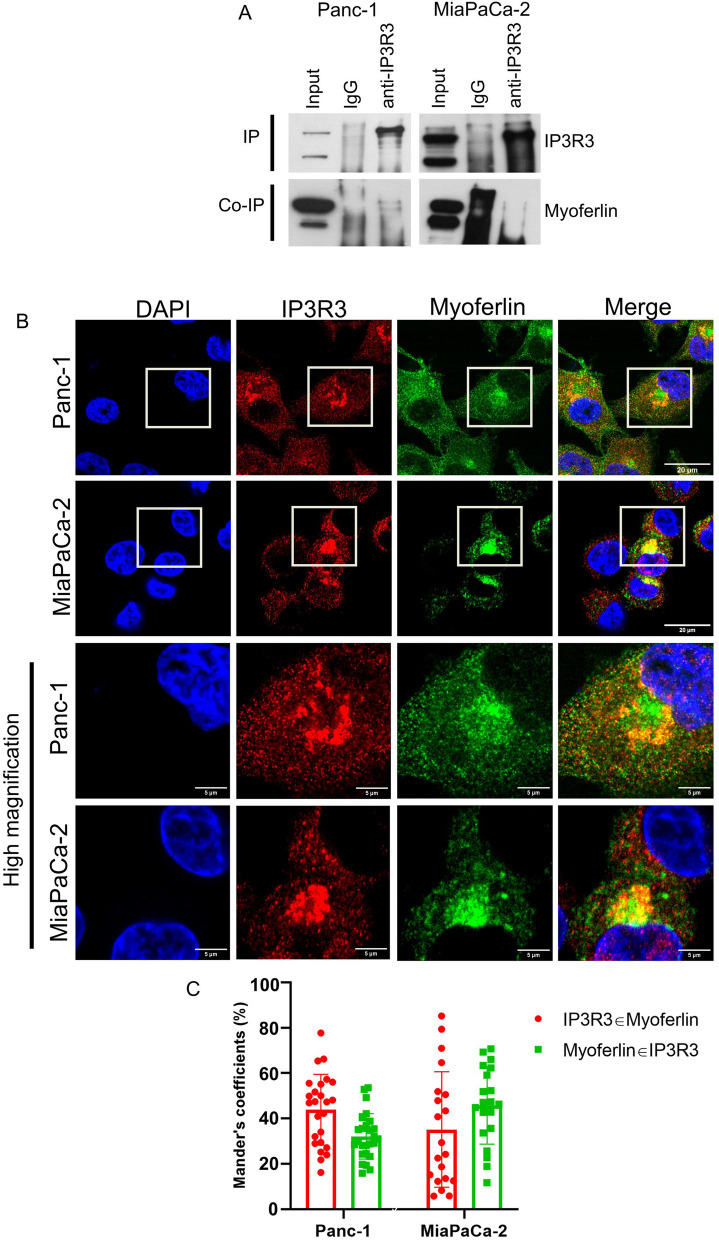
Methods: Experiments were performed on two pancreas cancer cell lines, Panc-1 and MiaPaCa-2. Myoferlin localization on mitochondria was evaluated by immunofluorescence, proximity ligation assay, and cell fractionation. The presence of myoferlin in mitochondria-associated membranes was assessed by cell fractionation and its function in mitochondrial calcium transfer was evaluated using calcium flow experiments, proximity ligation assays, co-immunoprecipitation, and timelapse fluorescence microscopy in living cells.

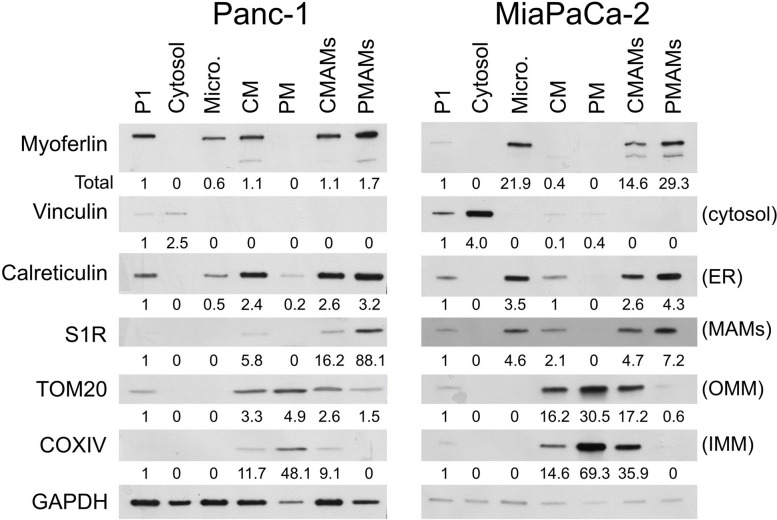
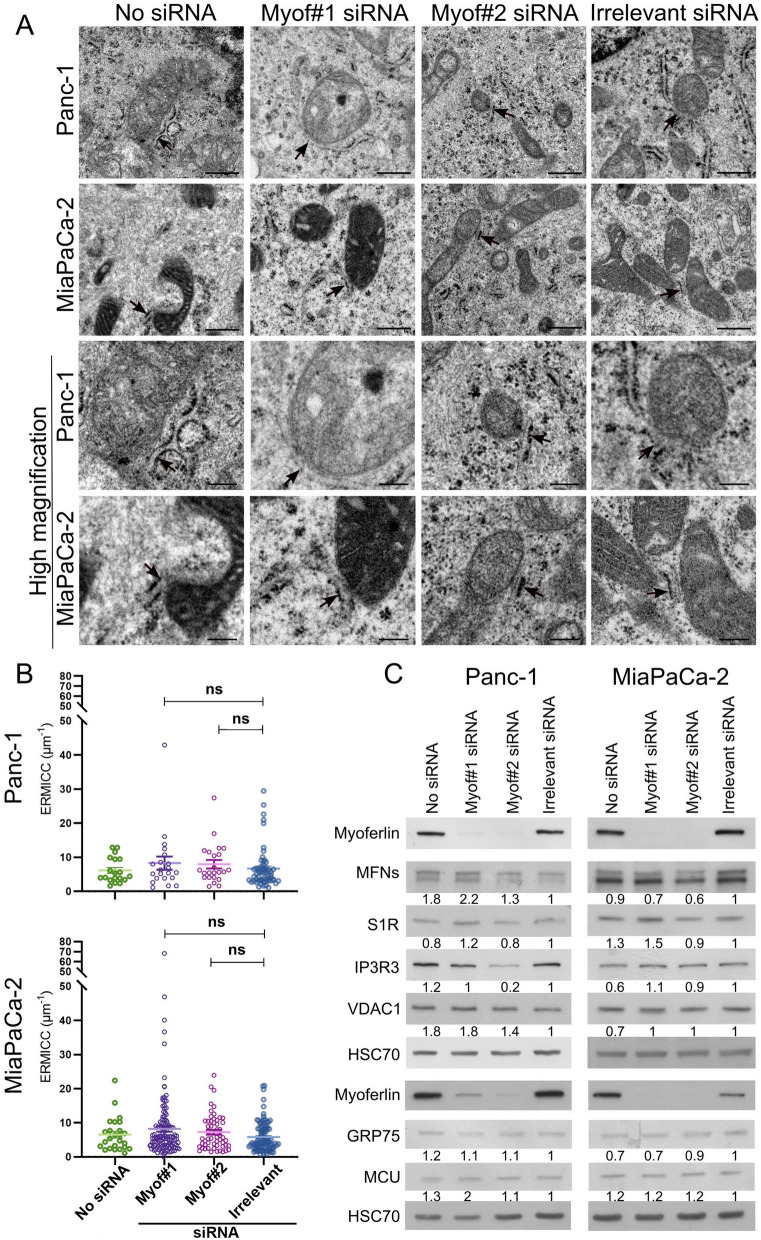
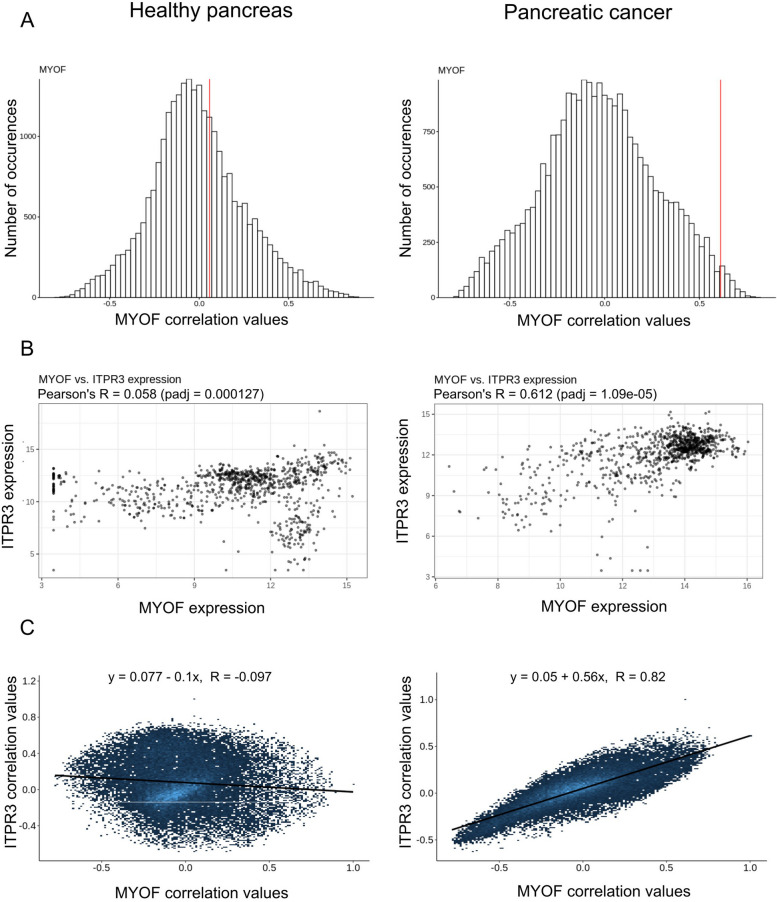
Results: Myoferlin localization on mitochondria was investigated. Our results suggest that myoferlin is unlikely to be located on mitochondria. Instead, we identified myoferlin as a new component of mitochondria-associated membranes. Its silencing significantly reduces the mitochondrial calcium level upon stimulation, probably through myoferlin interaction with the inositol 1,4,5-triphosphate receptors 3.

Conclusions: For the first time, myoferlin was specifically demonstrated to be located in mitochondria-associated membranes where it participates to calcium flow. We hypothesized that this function explains our previous results on mitochondrial dynamics. This study improves our comprehension of myoferlin localization and function in cancer biology.

Keywords: Calcium signaling; ER-mitochondria contact sites; IP3R3; Mitochondria; Mitochondria-associated membranes; Myoferlin; Pancreatic cancer.


Conflict of interest statement

The authors declare no competing interests.

Figures

Fig. 1
Fig. 1
Myoferlin and TOM20 poorly colocalize. A-C Indirect immunofluorescence performed on Panc-1 and MiaPaCa-2 cell lines, using TOM20 rabbit monoclonal and myoferlin (D-11) mouse monoclonal antibodies (A) High magnification showing myoferlin proximity (white arrows) with TOM20 in Panc-1 and MiaPaCa-2 cell lines. Colocalized pixels are pointed with yellow arrows. Scale bars represent 5 μm. B Low magnification showing myoferlin and TOM20 localization within Panc-1 and MiaPaCa-2 cells. White arrows pointed at region with high TOM20 staining while myoferlin staining was low. Scale bar represents 8.89 μm in Panc-1 and 5 μm in MiaPaCa-2 cell lines. The confocal pictures were acquired with a high resolution LSM 880 microscope. C Quantification of colocalization between TOM20 and myoferlin using Manders’ method. M1 represents the proportion of TOM20 colocalizing with myoferlin, while M2 represents the proportion of myoferlin colocalizing with TOM20. For the positive control, two secondary antibodies carrying distinct fluorochromes (Alexa Fluor 488 and 546), recognized the same myoferlin rabbit polyclonal primary antibody (HPA). The experiment was performed as three biological replicates. Each dot represents one individual cell. The non-parametric test of Kruskal-Wallis was performed for statistical analyses. Results are presented as mean ± SD, ns: non-significant. D Western blot showing myoferlin abundance in mitochondrial fractions. Calreticulin was used as an ER marker, while TOM20 was used as a mitochondrial marker. GAPDH was used as a loading control. These western blots are representative of three biological replicates
Fig. 2
Fig. 2
Myoferlin is detected in MAM fractions. Panc-1 and MiaPaCa-2 cells were fractionated in seven fractions: whole cell lysate (P1), cytosol, microsomes (Micro), crude mitochondria (CM), pure mitochondria (PM), crude MAMs (CMAMs), pure MAMs (PMAMs). Vinculin was used as a cytosolic marker, calreticulin as an ER marker, S1R as a MAM marker, TOM20 as an OMM maker and COXIV as an IMM marker. GAPDH was used as a loading control
Fig. 3
Fig. 3
Myoferlin silencing impacts mitochondrial Ca2+ level upon histamine stimulation. A Panc-1 and MiaPaCa-2 cell lines transfected with CMV-Mito-R-GECO-1 plasmid upon histamine stimulation in a Ca2+-free medium at different time points (0, 60, 125 s). Histamine injection was done at time point 50 s. Images were acquired with a Nikon A1R microscope. B Quantification of Ca2+ level upon histamine stimulation. Fluorescence was monitored over time. Histamine was injected (arrow) at 50 s. Fluorescence was monitored for each individual cell over time (Fn) and normalized to the fluorescence of the first frame of the time lapse (F0). C The peak amplitude was the difference between the normalized fluorescence at 60 and 45 s for the Panc-1 cell line and 65 and 45 s for the MiaPaCa-2 cell line. The total number of cells for each condition was n = 38 (no siRNA), n = 25 (Myof#1 siRNA), n = 33 (Myof#2 siRNA) and n = 41 (Irrelevant siRNA) for the Panc-1 cell line and n = 43 (no siRNA), n = 79 (Myof#1 siRNA), n = 60 (Myof#2 siRNA) and n = 107 (irrelevant siRNA) for the MiaPaCa-2 cell line. Results are presented as mean ± SEM. Tukey’s test was used for statistical analysis. **** p-value < 0.0001. D Western blot validating myoferlin silencing. HSC70 was used as a loading control
Fig. 4
Fig. 4
Myoferlin silencing does not alter ER morphology or induce ER stress. A TEM images of Panc-1 and MiaPaCa-2 cell lines. The ER is highlighted by black arrows. Scale bars = 1 μm, except for high magnification pictures where scale bars = 0.2 μm. B Western blot showing UPR markers upon myoferlin silencing in Panc-1 and MiaPaCa-2 cell lines. HSC70 was used as a loading control. Western blots are representative of three biological replicates. C Western blot showing UPR markers in Panc-1 cells silenced for myoferlin and treated with 1 µM thapsigargin
Fig. 5
Fig. 5
Myoferlin silencing does not impact abundance of MAMs-related proteins upon myoferlin silencing and the contacts between ER and mitochondria. A TEM pictures representing MAMs in Panc-1 and MiaPaCa-2 cell lines. MAMs, highlighted by black arrows on the upper panels, are shown at high magnification on the lower panel. Scale bars = 5 μm, except for high magnification, where scale bars = 0.2 μm. B Graphs showing the ERMICC values from controls and myoferlin-silenced cells in Panc-1 and MiaPaCa-2 cell lines. The non-parametric Kruskal-Wallis test was used for statistical analysis. For the Panc-1 cell line, the number of mitochondria in each condition was n = 298 (16 pictures, irrelevant), n = 138 (7 pictures, Myof#1 siRNA), n = 122 (5 pictures, Myof#5 siRNA) and n = 93 (6 pictures, no siRNA). Regarding the MiaPaCa-2 cell line, the number of mitochondria was n = 210 (10 pictures, irrelevant), n = 224 (9 pictures, Myof#1 siRNA), n = 174 (11 pictures, Myof#5 siRNA) and n = 189 (9 pictures, no siRNA). ns = non-significant; *: p-value < 0.05; **: p-value < 0.01. Results were presented as mean ± SEM. C Myoferlin, MFNs, S1R, IP3R3, VDAC1, GRP75 and MCU from whole cell lysates were assessed by western blot. The quantifications were performed with ImageJ software [24]. The irrelevant siRNA condition was used as reference for the quantifications. HSC70 was used as a loading control. The same batch of transfected Panc-1 cells was used in Fig. 6. Western blots are representative of three biological replicates
Fig. 6
Fig. 6
PLA between VDAC1 and IP3R3. A Representative pictures for PLA between VDAC1 and IP3R3 in PDAC cell lines silenced for myoferlin. The pictures were acquired with a confocal Nikon A1R microscope. B Quantification of PLA dots per cells in Panc-1 and MiaPaCa-2 cell lines. The number of pictures, from three independent experiments, analyzed for the PLA in the Panc-1 cell line was n = 33 (irrelevant), n = 19 (Myof#1 siRNA), n = 30 (Myof#2 siRNA), n = 27 (no siRNA). The number of pictures, from three independent experiments, for the PLA in the MiaPaCa-2 cell line was n = 20 (irrelevant), n = 20 (Myof#1 siRNA), n = 20 (Myof#2 siRNA) and n = 19 (no siRNA). Results were presented as mean ± SD. The non-parametric Kruskal-Wallis test was used for statistical analysis. **** p-value < 0.0001. ns: non-significant. Western blot inserts validate myoferlin silencing. HSC70 was used as a loading control. The same batch of transfected Panc-1 cells was used in Fig. 5C
Fig. 7
Fig. 7
PLA between myoferlin and key proteins described in Ca2+ signaling at MAMs (IP3R3, GRP75 and VDAC1). Representative pictures for the PLA between myoferlin and IP3R3, GRP75 or VDAC1. Yellow squares are presented as high magnification in the lower panels. Pictures were acquired with Nikon A1R confocal microscope. Scale bars on the upper panel represents 50 μm, while on the lower panel it represents 15 μm. The pictures are representative of three independent experiments
Fig. 8
Fig. 8
Myoferlin interacts with IP3R3. A IP3R3 was immunoprecipitated from Panc-1 and MiaPaCa-2 cell lines. Myoferlin co-immunoprecipitation was assessed by western blot. The IP3R3-myoferlin co-immunoprecipitation is representative of three independent experiments. B Myoferlin and IP3R3 immunofluorescence in Panc-1 and MiaPaCa-2 cell lines. Scale bars = 20 μm or 5 μm in high magnification. Confocal pictures were acquired with a high resolution LSM 880 microscope. C Colocalization analyses using Manders’ method on both Panc-1 and MiaPaCa-2 cell lines. “IP3R3 ϵ Myoferlin” represents the proportion of above-threshold pixels in IP3R3 channel colocalizing with above-threshold pixels in myoferlin channel and vice versa for “Myoferlin ϵ IP3R3”. Results are presented as mean ± SD. The number of analyzed cells was 27 for Panc-1 cells, and 20 for MiaPaCa-2. The pictures are representative of at least two independent experiments
Fig. 9
Fig. 9
Correlation of MYOF expression with ITPR3 expression in normal and cancer pancreas. A Distribution of correlation coefficient between every gene of the genome and MYOF in normal and cancer pancreas. The red vertical lines represented are the correlation values between ITPR3 and MYOF. B Scatterplots of the expressions of MYOF and ITPR3 genes are represented. C Correlation of gene expression with ITPR3 expression according to its correlation with MYOF gene expression

References

    1. Zhu W, Zhou B, Zhao C, Ba Z, Xu H, Yan X, et al. Myoferlin, a multifunctional protein in normal cells, has novel and key roles in various cancers. J Cell Mol Med. 2019;23(11):7180–9. doi: 10.1111/jcmm.14648. - DOI - PMC - PubMed
    1. Larsson SC, Wolk A. Red and processed meat consumption and risk of pancreatic cancer: meta-analysis of prospective studies. Br J Cancer. 2012;106(3):603–7. doi: 10.1038/bjc.2011.585. - DOI - PMC - PubMed
    1. Gajria D, Chandarlapaty S. HER2-amplified breast cancer: mechanisms of trastuzumab resistance and novel targeted therapies. Expert Rev Anticancer Ther. 2011;11(2):263–75. doi: 10.1586/era.10.226. - DOI - PMC - PubMed
    1. Andersen HB, Ialchina R, Pedersen SF, Czaplinska D. Metabolic reprogramming by driver mutation-tumor microenvironment interplay in pancreatic cancer: new therapeutic targets. Cancer Metastasis Rev. 2021;40(4):1093–114. doi: 10.1007/s10555-021-10004-4. - DOI - PubMed
    1. Li JT, Wang YP, Yin M, Lei QY. Metabolism remodeling in pancreatic ductal adenocarcinoma. Cell Stress. 2019;3(12):361–8. doi: 10.15698/cst2019.12.205. - DOI - PMC - PubMed

Publication types