. 2024 Feb 17;15(1):1475.
doi: 10.1038/s41467-024-45204-3.

COVID-19 immune signatures in Uganda persist in HIV co-infection and diverge by pandemic phase

Collaborators, Affiliations

COVID-19 immune signatures in Uganda persist in HIV co-infection and diverge by pandemic phase

Matthew J Cummings et al. Nat Commun. .

Abstract

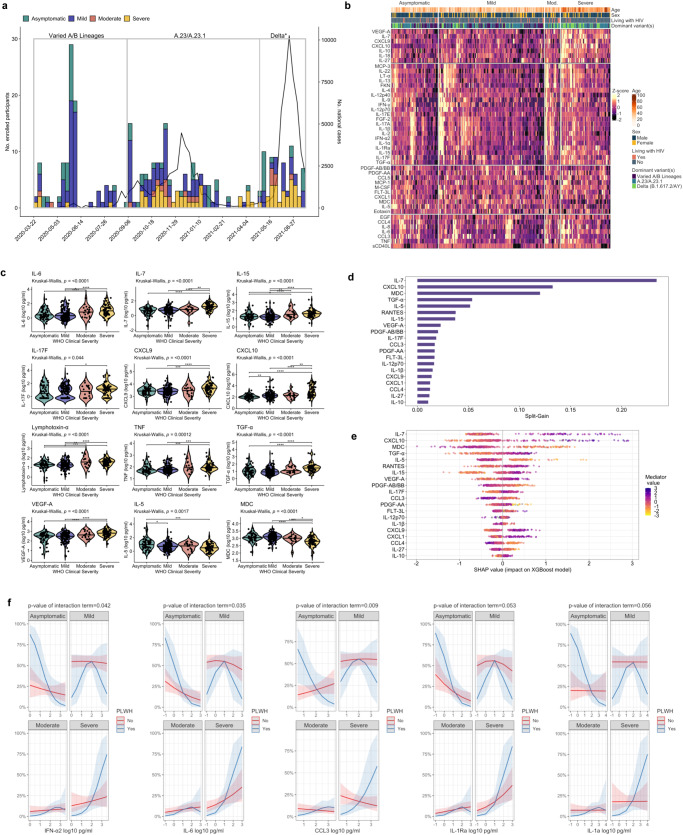
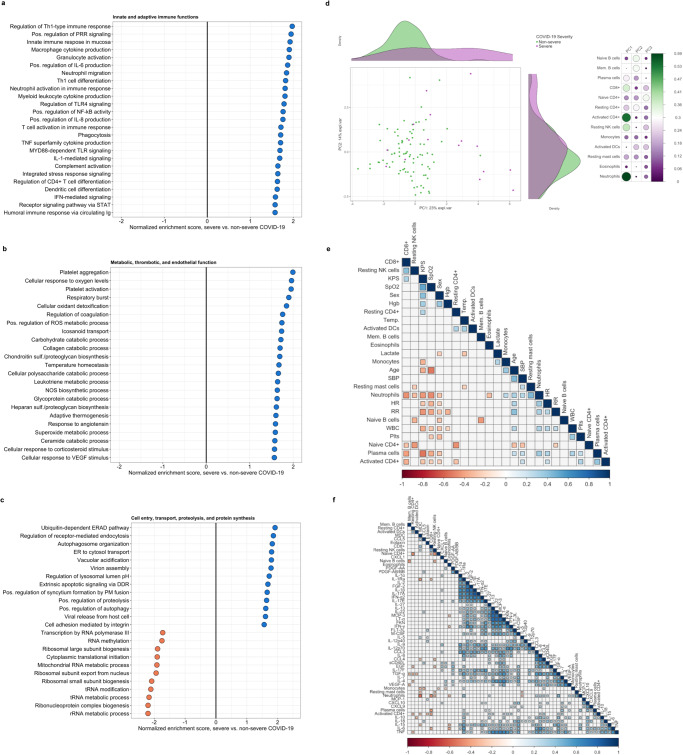
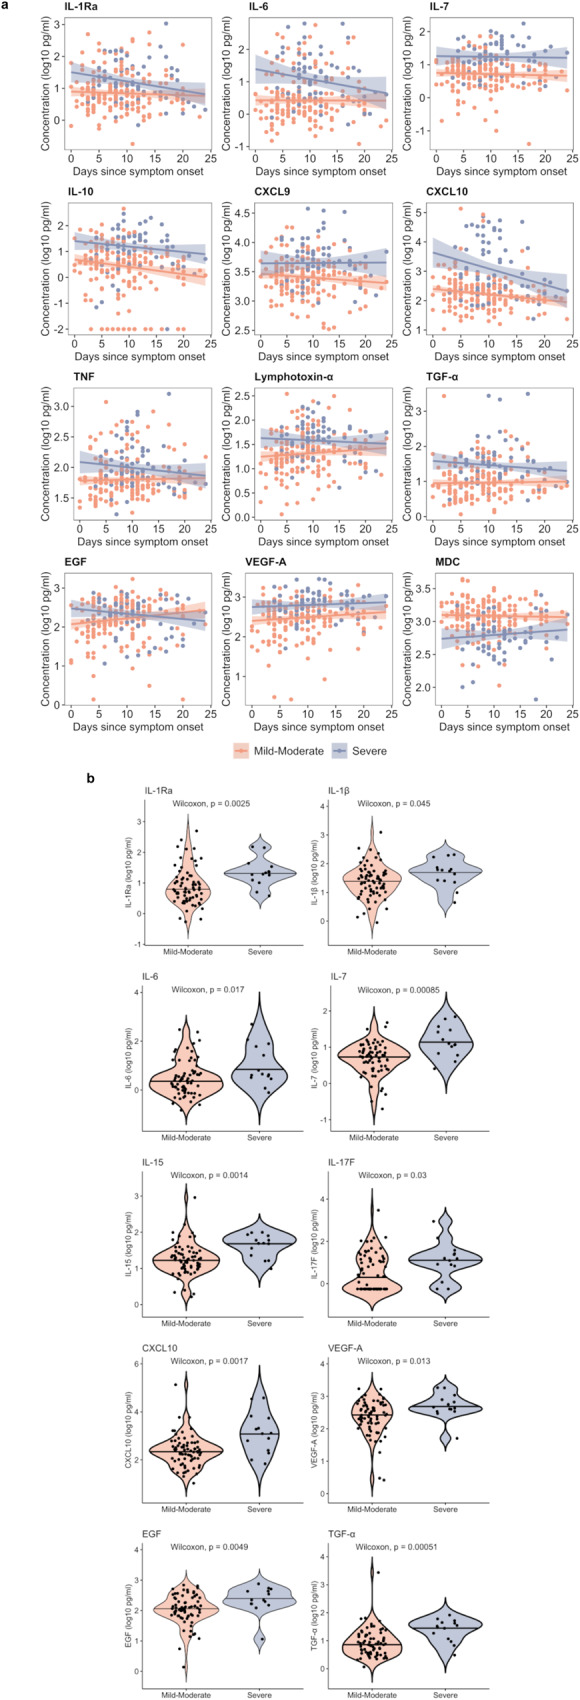
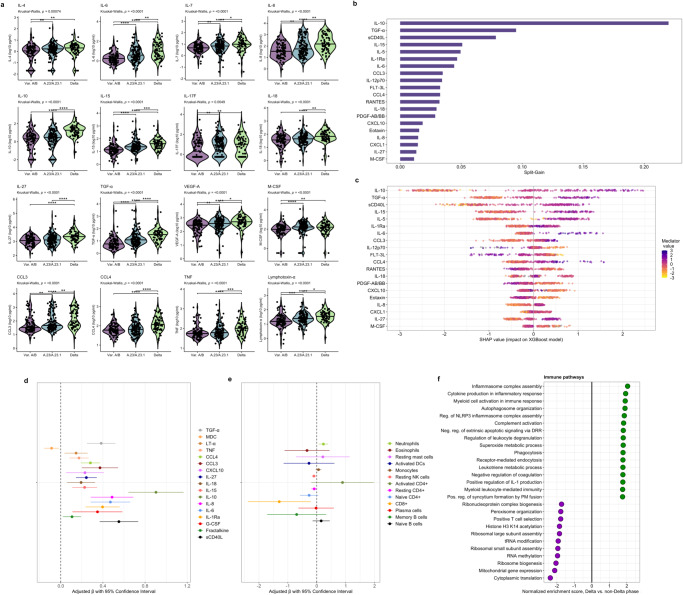
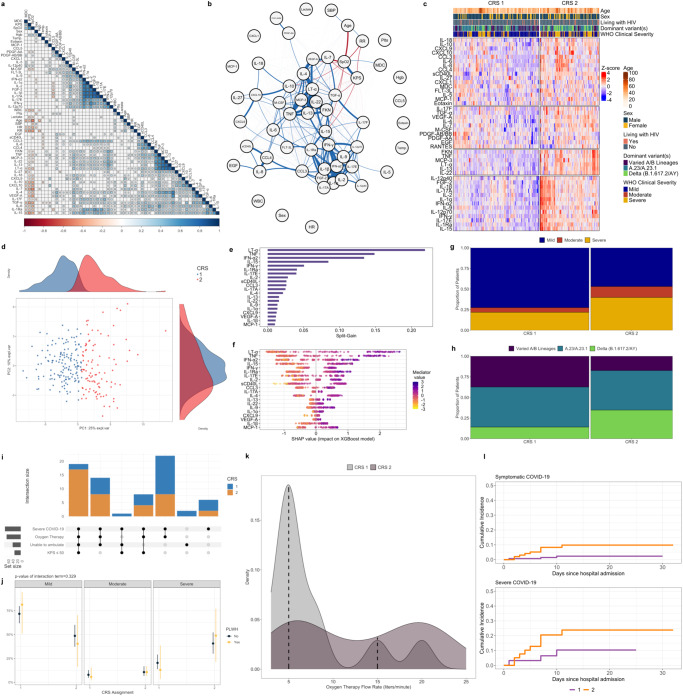
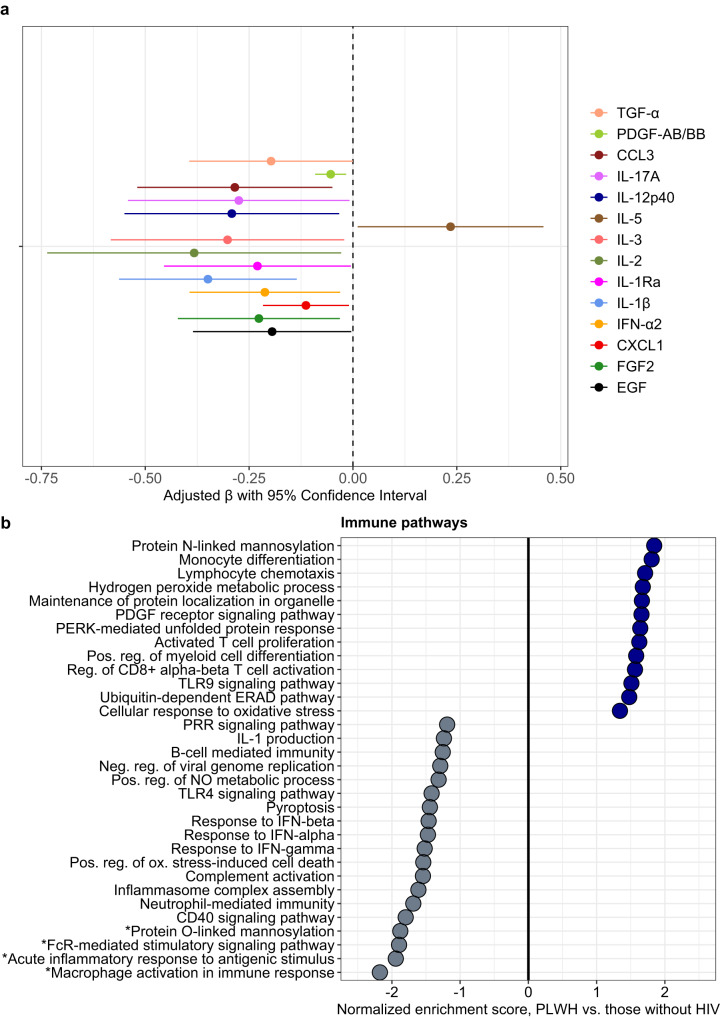
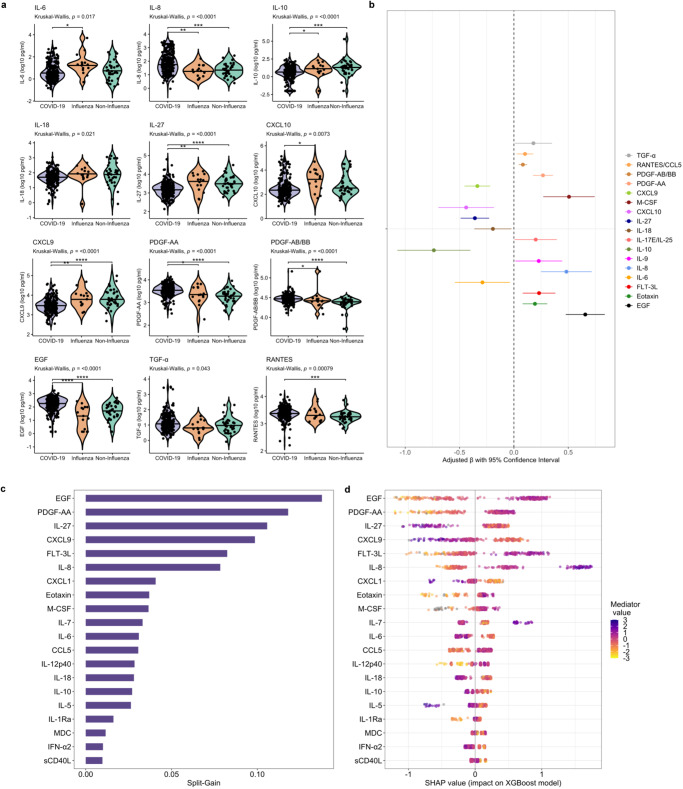
Little is known about the pathobiology of SARS-CoV-2 infection in sub-Saharan Africa, where severe COVID-19 fatality rates are among the highest in the world and the immunological landscape is unique. In a prospective cohort study of 306 adults encompassing the entire clinical spectrum of SARS-CoV-2 infection in Uganda, we profile the peripheral blood proteome and transcriptome to characterize the immunopathology of COVID-19 across multiple phases of the pandemic. Beyond the prognostic importance of myeloid cell-driven immune activation and lymphopenia, we show that multifaceted impairment of host protein synthesis and redox imbalance define core biological signatures of severe COVID-19, with central roles for IL-7, IL-15, and lymphotoxin-α in COVID-19 respiratory failure. While prognostic signatures are generally consistent in SARS-CoV-2/HIV-coinfection, type I interferon responses uniquely scale with COVID-19 severity in persons living with HIV. Throughout the pandemic, COVID-19 severity peaked during phases dominated by A.23/A.23.1 and Delta B.1.617.2/AY variants. Independent of clinical severity, Delta phase COVID-19 is distinguished by exaggerated pro-inflammatory myeloid cell and inflammasome activation, NK and CD8+ T cell depletion, and impaired host protein synthesis. Combining these analyses with a contemporary Ugandan cohort of adults hospitalized with influenza and other severe acute respiratory infections, we show that activation of epidermal and platelet-derived growth factor pathways are distinct features of COVID-19, deepening translational understanding of mechanisms potentially underlying SARS-CoV-2-associated pulmonary fibrosis. Collectively, our findings provide biological rationale for use of broad and targeted immunotherapies for severe COVID-19 in sub-Saharan Africa, illustrate the relevance of local viral and host factors to SARS-CoV-2 immunopathology, and highlight underemphasized yet therapeutically exploitable immune pathways driving COVID-19 severity.


Conflict of interest statement

M.J.C. and M.R.O’D. were investigators for clinical trials evaluating the efficacy and safety of remdesivir, convalescent plasma, and anti-SARS-CoV-2 hyperimmune globulin in hospitalized patients with COVID-19, sponsored by Gilead Sciences, Amazon, and the National Institutes of Health, respectively. Compensation for this work was paid to Columbia University. The remaining authors declare no competing interests.

Figures

Fig. 1
Fig. 1. COVID-19 pandemic phases and relationships between soluble immune mediators and COVID-19 severity.
a Epidemic curve of study enrollment period; enrolled patients (N = 306) assigned to epidemic weeks based on date of hospitalization and colored according to World Health Organization (WHO) clinical severity classification. Right-sided y-axis reflects national SARS-CoV-2 case counts as per the WHO COVID-19 Uganda dashboard. Pandemic phases were defined based on dominant circulation of different variants and trends in national SARS-CoV-2 case counts (Varied A/B lineage phase, N = 97; A.23/A.23.1 phase, N = 141; Delta phase, N = 68). *Delta variant includes B.1.617.2 and AY.1, AY.4, AY.33, AY.39, AY.46, AY.46.4 sublineages. b Heatmap of 45 soluble immune mediator concentrations (values log10-transformed, centered, and scaled) stratified by WHO clinical severity classification with rows split by k-means clustering (N = 306). Individual patient columns are ordered based on differences in mean z-score and annotated with age, self-reported sex, HIV status, and dominant SARS-CoV-2 variant at time of hospitalization. IL-3, GM-CSF, and G-CSF omitted from heatmap given large proportion of values below the lower limit of quantification. c Soluble mediator concentrations stratified by WHO clinical severity classification (N = 306). Concentrations across groups compared using Kruskal-Wallis H test followed by Dunn’s test for multiple comparisons with p values adjusted using Benjamini-Hochberg method; *p < 0.05, **p < 0.01, ***p < 0.001, ****p < 0.0001. d Importance of immune mediators in gradient-boosted machine classifier for prediction of severe (N = 70) vs. non-severe (asymptomatic, mild, or moderate, N = 236) COVID-19 as per model split-gain values; top 20 variables presented in descending order of importance. e Shapley additive explanations (SHAP) values derived from gradient-boosted machine model for prediction of severe (N = 70) vs. non-severe (N = 236) COVID-19; SHAP values > 0 indicate positive impact on prediction while values < 0 indicates negative impact (e.g., high concentrations of IL-7 have a strong positive contribution to prediction of severe COVID-19). f Probabilities of COVID-19 severity stratified by HIV status (N = 302; 4 patients without definitive assessment of HIV status excluded); shading indicates 95% confidence intervals; probabilities derived from multivariable proportional odds model including WHO clinical severity as ordinal dependent variable and age, self-reported sex, and interaction term between HIV status and log10-mediator concentration as independent variables; p values reflect two-sided Wald test of interaction term; PLWH persons living with HIV. Source data are provided in the Source Data file.
Fig. 2
Fig. 2. Biological pathway enrichment and immune cell profiles associated with COVID-19 severity.
ac Differential enrichment of key biological pathways among patients with severe vs. non-severe COVID-19 at false-discovery-rate (FDR) q value ≤ 0.10 (N = 100); pathway enrichment determined using Gene Set Enrichment Analysis applied to differentially expressed gene sets generated in a DESeq2 model of whole-blood RNAseq data adjusted for age, self-reported sex, HIV co-infection, and SARS-CoV-2 variant phase (2 patients not known to be living with HIV but with missing rapid diagnostic tests analyzed as HIV negative); PRR pathogen recognition receptor, ROS reactive oxygen species, NOS nitric oxide synthetase, ERAD Endoplasmic-reticulum-associated protein degradation, ER endoplasmic reticulum, DDR death domain receptor. d Principal components analysis of immune cell populations in individual patients stratified by COVID-19 severity (N = 100); absolute abundance of immune cell populations (naïve and memory B cells, plasma cells, CD8+ T cells, naïve, resting, and activated memory CD4+ T cells, resting natural killer cells, monocytes, activated dendritic cells, resting mast cells, eosinophils, and neutrophils) inferred from whole-blood RNAseq data using LM22 signature matrix in CIBERSORTx platform; side panel displays squared factor loadings for each immune cell type across the first two principal components; higher loading value indicates greater importance for each cell type in explaining variance across each principal component. ef Hierarchical correlation matrices showing relationships between immune cell abundance, demographics, clinical variables, and immune mediators in patients with symptomatic COVID-19 (N = 84); shaded squares reflect Spearman correlation coefficients with a two-sided Benjamini-Hochberg adjusted p value ≤ 0.05; NK natural killer, KPS Karnofsky Performance Status, SpO2 peripheral oxygen saturation, Hgb hemoglobin, Temp temperature, DC dendritic cells, Mem Memory, SBP systolic blood pressure, HR heart rate, RR respiratory rate, WBC white blood cell count, Plts platelet count. Source data are provided in the Source Data file.
Fig. 3
Fig. 3. Immune mediator concentrations over the course of symptomatic COVID-19.
a Immune mediator concentrations over the course of COVID-19 symptoms, with robust regression lines and shaded 95% confidence intervals, stratified by COVID-19 severity (N = 237; 3 symptomatic patients with extreme outliers in reported illness duration excluded). As an example, an individual data point corresponding to day 0 represents the mediator concentration for a patient whose sample was collected on the day of illness onset, while that corresponding to day 5 represents a patient whose sample was collected on day 5 of illness. b Violin plots showing immune mediator concentrations among patients enrolled within 7 days of illness onset stratified by COVID-19 severity (N = 85). P values reflect two-sided Wilcoxon rank sum tests unadjusted for multiple comparisons; Benjamini-Hochberg-adjusted P values are included in Supplementary Table 6. Source data are provided in the Source Data file.
Fig. 4
Fig. 4. Relationships between immune mediators, cell populations, biological pathways, and COVID-19 pandemic phases.
a Violin plots showing immune mediator concentrations stratified by SARS-CoV-2 variant-driven pandemic phases (variable A/B lineage, A.23/A.23.1, Delta) at time of hospitalization (N = 306). Concentrations across groups compared using Kruskal-Wallis H test followed by Dunn’s test for multiple comparisons with p values adjusted using Benjamini-Hochberg method; *p < 0.05, **p < 0.01, ***p < 0.001, ****p < 0.0001. b Importance of immune mediators in gradient-boosted machine classifier for prediction of Delta (N = 68) vs. non-Delta phase (N = 238; includes variable A/B lineage and A.23/A.23.1 phases) COVID-19 as per model split-gain values; top 20 variables presented in descending order of importance. c Shapley additive explanations (SHAP) values derived from gradient-boosted machine model for prediction of Delta (N = 68) vs. non-Delta phase (N = 238; includes variable A/B lineage and A.23/A.23.1 phases) COVID-19; SHAP values > 0 indicate positive impact on prediction while values < 0 indicates negative impact (e.g., high concentrations of IL-10 have a strong positive contribution to prediction of Delta phase COVID-19). d, e Associations between Delta phase COVID-19 and log10-immune mediator concentrations (N = 306) and log10-immune cell abundance (N = 100); coefficients with 95% confidence interval bars generated in multivariable logistic regression models including hospitalization during Delta phase as a binary dependent variable (vs. hospitalization during variable A/B lineage and A.23/A.23.1 phases) and age (continuous), self-reported sex (binary), HIV co-infection (binary; 4 patients not known to be living with HIV but with missing rapid diagnostic tests analyzed as HIV negative), exposure to corticosteroids (binary), and WHO clinical severity classification (categorical) as independent variables; NK natural killer, DC dendritic cells. f Differential enrichment of key biological pathways among patients with Delta vs. non-Delta phase COVID-19 at false-discovery-rate (FDR) q value ≤ 0.10 (N = 100); pathway enrichment determined using Gene Set Enrichment Analysis applied to differentially expressed gene sets generated in a DESeq2 model of whole-blood RNAseq data adjusted for age (continuous), self-reported sex (binary), HIV co-infection (binary; 2 patients not known to be living with HIV but with missing rapid diagnostic tests analyzed as HIV negative), exposure to corticosteroids (binary), and WHO clinical severity classification (categorical) as independent variables. Source data are provided in the Source Data file.
Fig. 5
Fig. 5. Clinicomolecular profiling of COVID-19 and cluster-derived COVID-19 Response Signatures.
a Hierarchical correlation matrix showing relationships between demographics, clinical variables, and immune mediators in patients with symptomatic COVID-19 (N = 240); shaded squares reflect Spearman correlation coefficients filtered by a Benjamini-Hochberg adjusted two-sided p value ≤ 0.05. KPS Karnofsky Performance Status, SpO2 peripheral oxygen saturation, Hgb hemoglobin, Temp temperature, SBP systolic blood pressure, HR heart rate, RR respiratory rate, WBC white blood cell count, Plts platelet count. b Force-directed weighted correlation network showing relationships between immune mediators and clinical variables in patients with symptomatic COVID-19 (N = 240); network structured on weighted correlations with each variable set as a network node and between-variable correlations significant at a false discovery rate-adjusted two-sided p value ≤ 0.05 indicated by weighted edges (blue edges indicate positive correlation, red edges indicate negative correlation, edge width indicates the strength of correlation based on Spearman coefficient). KPS Karnofsky Performance Status, SpO2 peripheral oxygen saturation, Hgb hemoglobin, Temp temperature, SBP systolic blood pressure, HR heart rate, RR respiratory rate, WBC white blood cell count, Plts platelet count. c Heatmap of 45 soluble immune mediator concentrations (values log10-transformed, centered, and scaled) stratified by consensus cluster-derived COVID-19 Response Signatures (CRS; CRS-1, N = 142; CRS-2, N = 98) in patients with symptomatic COVID-19 (N = 240); rows split by k-means clustering. Individual patient columns ordered based on differences in mean z-score and annotated with age, self-reported sex, HIV co-infection, World Health Organization (WHO) clinical severity classification, and dominant SARS-CoV-2 variant at time of hospitalization. IL-3, GM-CSF, and G-CSF omitted from cluster derivation analysis and heatmap given large proportion of values below the lower limit of quantification. d Principal components analysis of immune mediator concentrations in individual patients stratified by cluster-derived COVID-19 Response Signature (CRS). e Importance of immune mediators in gradient-boosted machine classifier for prediction of COVID-19 Response Signature 2 (N = 98) vs. 1 (N = 142) as per model split-gain values; top 20 variables presented in descending order of importance. f Shapley additive explanations (SHAP) values derived from gradient-boosted machine model for prediction of COVID-19 Response Signature 2 (N = 98) vs. 1 (N = 142); SHAP values > 0 indicate positive impact on prediction while values < 0 indicates negative impact (e.g., high concentrations of lymphotoxin-α have a strong positive contribution to prediction of COVID-19 Response Signature 2). g, h Mosaic plots showing distribution of COVID-19 severity and pandemic phases among patients assigned to COVID-19 Response Signature (CRS) 1 (N = 142) or 2 (N = 98); column width reflects frequencies of patient assignments to each signature. i Upset plot showing frequency of severe COVID-19, receipt of oxygen therapy, severely impaired functional status (Karnofsky Performance Status [KPS] ≤ 50), and inability to ambulate among patients assigned to COVID-19 Response Signature (CRS) 1 (N = 142) and 2 (N = 98). j Predicted probabilities of COVID-19 severity classifications stratified by HIV co-infection (N = 236; 4 patients without definitive assessment of HIV co-infection excluded); probabilities with 95% confidence interval bars derived from multivariable proportional odds model including WHO clinical severity as ordinal dependent variable and interaction term between COVID-19 Response Signature assignment and HIV co-infection status as independent variable; p value reflects two-sided Wald test of interaction term. k Density plot of peak oxygen flow-rates received by patients assigned to COVID-19 Response Signature 1 and 2; dashed lines indicate median oxygen flow-rate for each group (N = 34; patients without documented peak oxygen therapy flow-rate excluded). l Cumulative incidence of poor hospital outcomes (death or transfer considering discharge alive as a competing risk) for patients with symptomatic (N = 240) and severe (N = 70) COVID-19 stratified by COVID-19 Response Signature. Source data are provided in the Source Data file.
Fig. 6
Fig. 6. Immune mediators and biological pathway enrichment in SARS-CoV-2/HIV co-infection.
a Associations between HIV co-infection and log10-immune mediator concentrations in patients with SARS-CoV-2 infection (N = 302; persons living with HIV, N = 33; patients living without HIV, N = 269; 4 patients without definitive assessment of HIV co-infection excluded); coefficients with 95% confidence interval bars generated in multivariable linear regression models including log10-transformed mediator concentration as dependent variable and HIV co-infection (binary), age (continuous), self-reported sex (binary), and WHO clinical severity classification (categorical) as independent variables. b Differential enrichment of key biological pathways among patients living with HIV (N = 16) vs. those without HIV (N = 82; 2 patients without definitive assessment of HIV co-infection excluded); pathway enrichment determined using Gene Set Enrichment Analysis applied to differentially expressed gene sets generated in a DESeq2 model of whole-blood RNAseq data adjusted for age (continuous), self-reported sex (binary), and WHO clinical severity classification (categorical). *Differentially enriched pathways at FDR q value ≤ 0.10; remainder of pathways associated with FDR q value > 0.10. PRR pathogen recognition receptor, NO nitric oxide, ERAD Endoplasmic-reticulum-associated protein degradation. Source data are provided in the Source Data file.
Fig. 7
Fig. 7. Relationships between immune mediators and severe acute respiratory infection etiology.
a Violin plots showing immune mediator concentrations stratified by severe acute respiratory infection (SARI) etiology (N = 292; 66 patients with asymptomatic SARS-CoV-2 infection excluded). Concentrations across groups compared using Kruskal-Wallis H test followed by Dunn’s test for multiple comparisons with p values adjusted using Benjamini-Hochberg method; *p < 0.05, **p < 0.01, ***p < 0.001, ****p < 0.0001. b Associations between COVID-19 and immune mediator concentrations (N = 292; 66 patients with asymptomatic SARS-CoV-2 infection excluded); coefficients with 95% confidence interval bars generated in multivariable linear regression models including log10-transformed mediator concentration as dependent variable and SARI etiology (binary; COVID-19 vs. influenza/non-influenza SARI), age (continuous), self-reported sex (binary), HIV co-infection (binary; 4 patients not known to be living with HIV but with missing rapid diagnostic tests analyzed as HIV negative) and WHO clinical severity classification (categorical) as independent variables. c Importance of immune mediators in gradient-boosted machine classifier for prediction of COVID-19 (N = 240) vs non-COVID-19 (N = 52) SARI as per model split-gain values; top 20 variables presented in descending order of importance. d Shapley additive explanations (SHAP) values derived from gradient-boosted machine model for prediction of COVID-19 (N = 240) vs non-COVID-19 (N = 52) SARI; SHAP values > 0 indicate positive impact on prediction while values < 0 indicates negative impact (e.g., high concentrations of EGF have a strong positive contribution to prediction of COVID-19). Source data are provided in the Source Data file.

References

    1. Msemburi W, et al. The WHO estimates of excess mortality associated with the COVID-19 pandemic. Nature. 2023;613:130–137. doi: 10.1038/s41586-022-05522-2. - DOI - PMC - PubMed
    1. Yeates EO, et al. Improved outcomes over time for adult COVID-19 patients with acute respiratory distress syndrome or acute respiratory failure. PLoS One. 2021;16:e0253767. doi: 10.1371/journal.pone.0253767. - DOI - PMC - PubMed
    1. Gray WK, Navaratnam AV, Day J, Wendon J, Briggs TWR. COVID-19 hospital activity and in-hospital mortality during the first and second waves of the pandemic in England: an observational study. Thorax. 2022;77:1113–1120. doi: 10.1136/thoraxjnl-2021-218025. - DOI - PubMed
    1. US Centers for Disease Control and Prevention. COVID-19 Data Review: update on COVID-19–related mortality. https://www.cdc.gov/coronavirus/2019-ncov/science/data-review/index.html. (2023).
    1. Sterne JAC, et al. Association between administration of systemic corticosteroids and mortality among critically ill patients with COVID-19: a meta-analysis. JAMA. 2020;324:1330–1341. doi: 10.1001/jama.2020.17023. - DOI - PMC - PubMed

Supplementary concepts