. 2024 Feb 17;15(1):1470.
doi: 10.1038/s41467-024-45855-2.

Mucosal host-microbe interactions associate with clinical phenotypes in inflammatory bowel disease

Affiliations

Mucosal host-microbe interactions associate with clinical phenotypes in inflammatory bowel disease

Shixian Hu et al. Nat Commun. .

Abstract

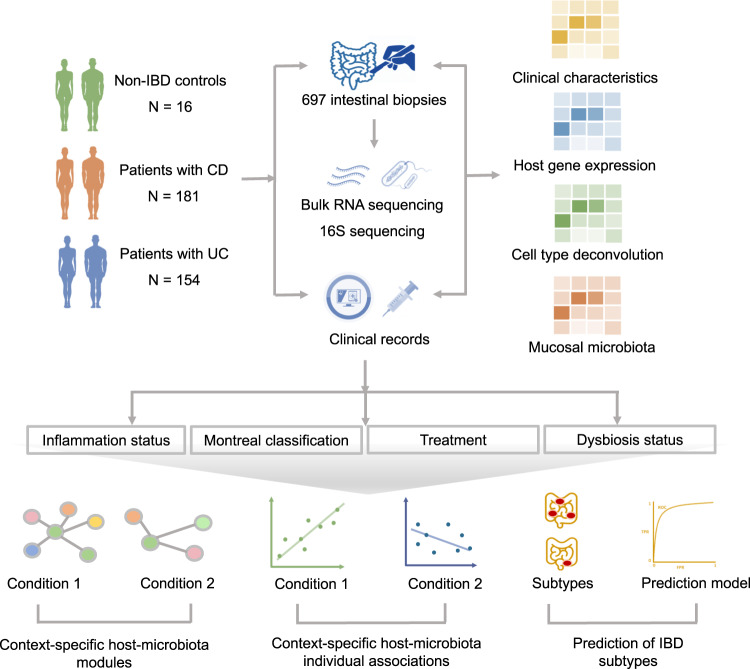
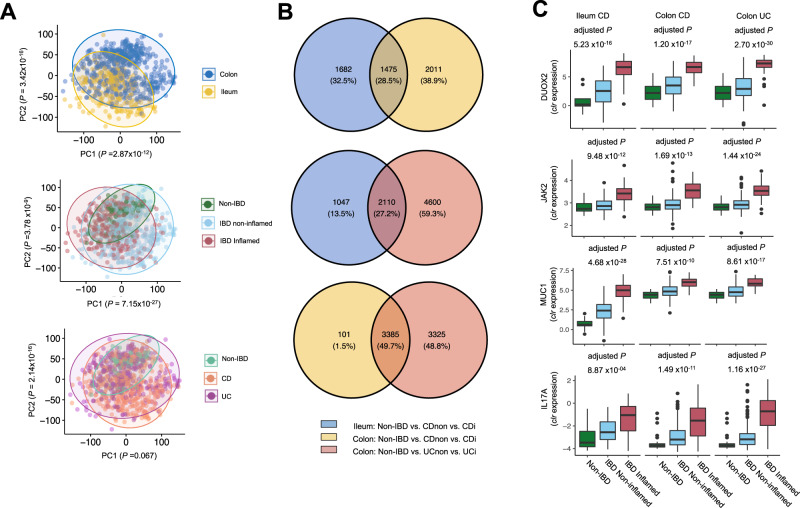
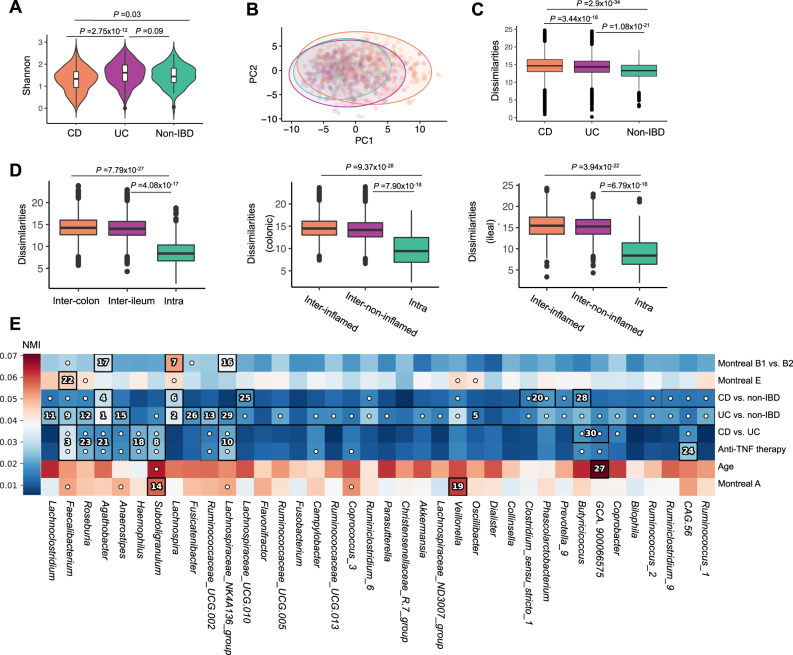
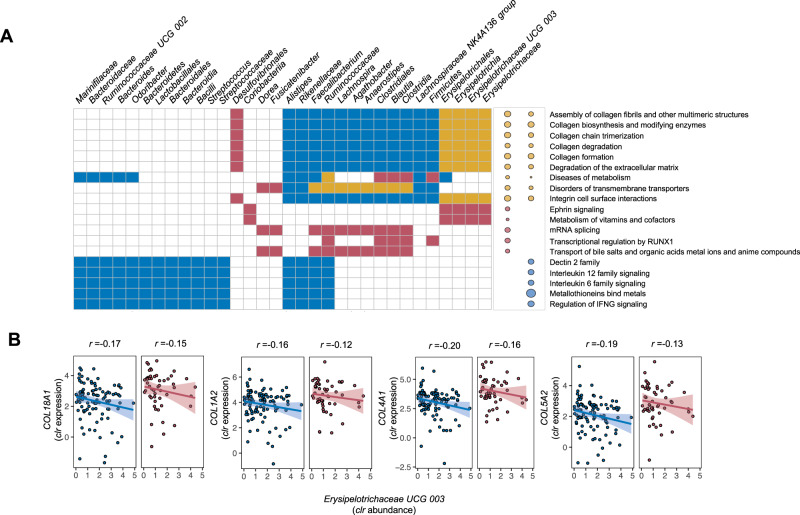
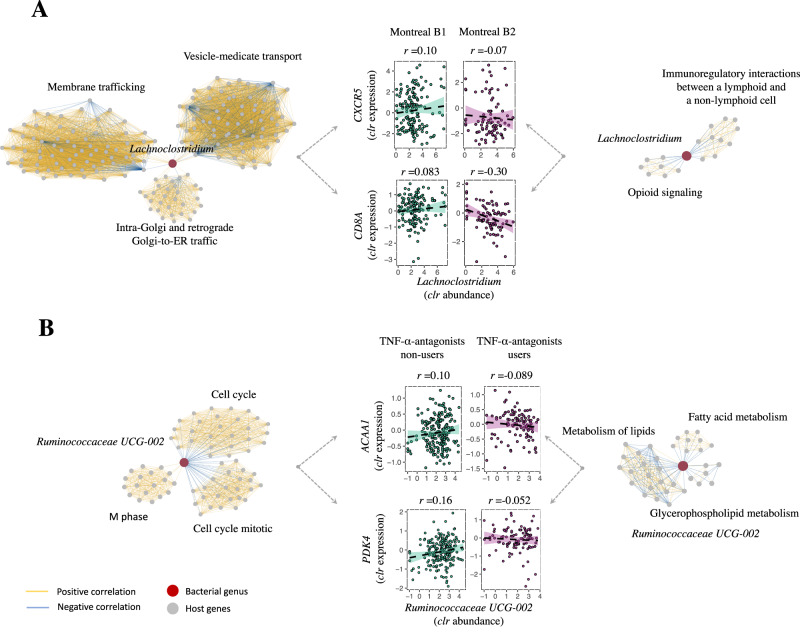
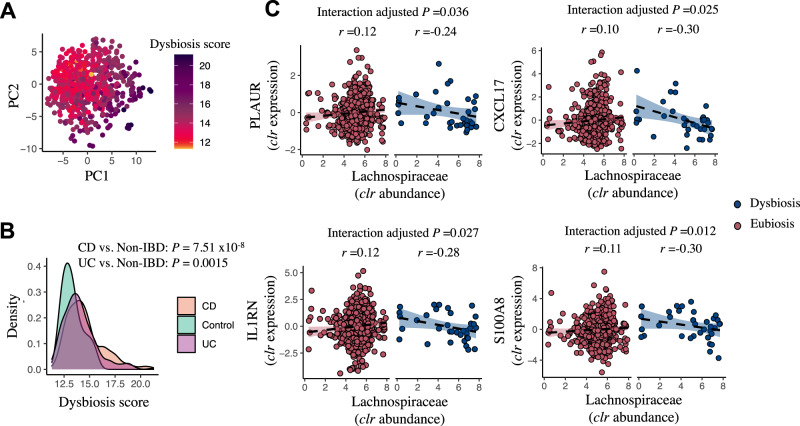
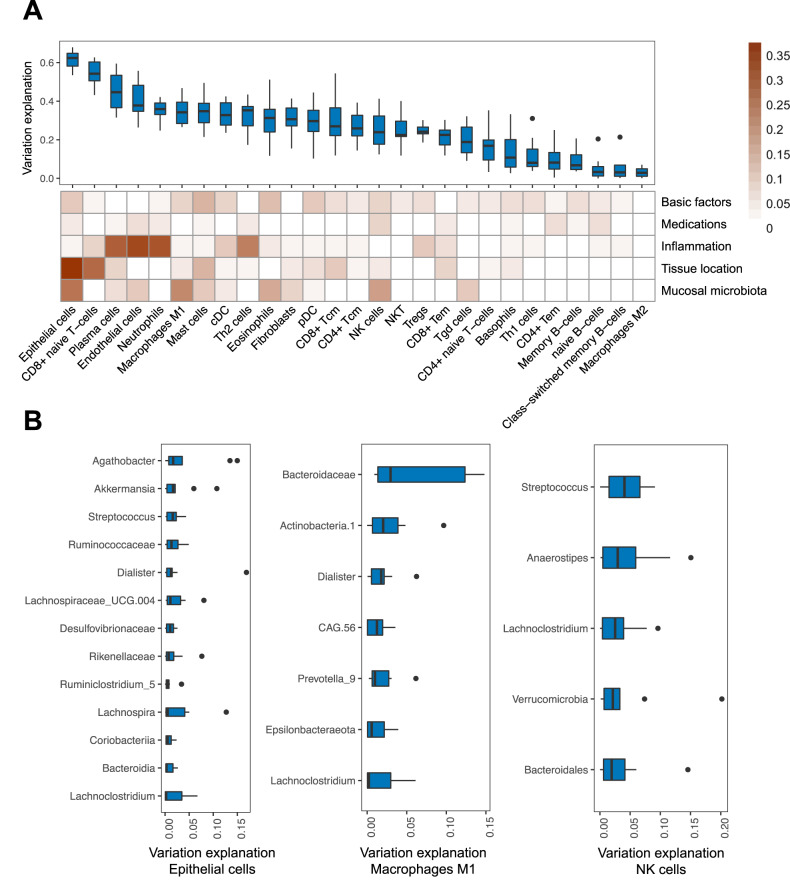
Disrupted host-microbe interactions at the mucosal level are key to the pathophysiology of IBD. This study aimed to comprehensively examine crosstalk between mucosal gene expression and microbiota in patients with IBD. To study tissue-specific interactions, we perform transcriptomic (RNA-seq) and microbial (16S-rRNA-seq) profiling of 697 intestinal biopsies (645 derived from 335 patients with IBD and 52 from 16 non-IBD controls). Mucosal gene expression patterns in IBD are mainly determined by tissue location and inflammation, whereas the mucosal microbiota composition shows a high degree of individual specificity. Analysis of transcript-bacteria interactions identifies six distinct groups of inflammation-related pathways that are associated with intestinal microbiota (adjusted P < 0.05). An increased abundance of Bifidobacterium is associated with higher expression of genes involved in fatty acid metabolism, while Bacteroides correlates with increased metallothionein signaling. In patients with fibrostenosis, a transcriptional network dominated by immunoregulatory genes is associated with Lachnoclostridium bacteria in non-stenotic tissue (adjusted P < 0.05), while being absent in CD without fibrostenosis. In patients using TNF-α-antagonists, a transcriptional network dominated by fatty acid metabolism genes is linked to Ruminococcaceae (adjusted P < 0.05). Mucosal microbiota composition correlates with enrichment of intestinal epithelial cells, macrophages, and NK-cells. Overall, these data demonstrate the presence of context-specific mucosal host-microbe interactions in IBD, revealing significantly altered inflammation-associated gene-taxa modules, particularly in patients with fibrostenotic CD and patients using TNF-α-antagonists. This study provides compelling insights into host-microbe interactions that may guide microbiota-directed precision medicine and fuels the rationale for microbiota-targeted therapeutics as a strategy to alter disease course in IBD.


Conflict of interest statement

RKW acted as a consultant for Takeda, received unrestricted research grants from Takeda, Johnson & Johnson, Tramedico and Ferring and received speaker fees from MSD, Abbvie, and Janssen Pharmaceuticals. GD received an unrestricted research grant from Takeda and speaker fees from Pfizer and Janssen Pharmaceuticals. All other authors declare no competing interests.

Figures

Fig. 1
Fig. 1. Methodological workflow of the study.
The study cohort consisted of 335 patients with IBD (CD: n = 181, UC: n = 154) and 16 non-IBD controls, from whom 697 intestinal biopsies were collected (IBD: n = 645, controls: n = 52) and processed to perform bulk mucosal RNA-sequencing and 16S gene rRNA sequencing. Detailed phenotypic data were extracted from clinical records for all study participants. In total, 245 ileal biopsies (CD: n = 179, UC: n = 57, controls: n = 9) and 452 colonic biopsies (CD: n = 177, UC: n = 232, controls: n = 43) were included: 211 biopsies derived from inflamed regions and 434 from non-inflamed regions. Ileal biopsies from patients with UC were not included in downstream statistical analyses. Mucosal gene expression and bacterial abundances were systematically analyzed in relation to different (clinical) phenotypes: presence of tissue inflammation, Montreal disease classification, medication use (e.g. TNF-α-antagonists) and dysbiotic status. Module-based clustering, network analysis (Sparse-CCA and centrLCC analysis) and individual pairwise gene–taxa associations were investigated to identify host–microbiota interactions in different contexts. Machine learning methods were used to predict IBD subtypes. We then analyzed the degree to which mucosal microbiota could explain the variation in intestinal cell type–enrichment (estimated by deconvolution of bulk RNA-seq data). To confirm our main findings, we used publicly available mucosal 16S and RNA-seq datasets for external validation.
Fig. 2
Fig. 2. Mucosal host gene expression patterns in intestinal tissue from patients with IBD and controls.
A Principal component analysis, labeled by tissue location (ileum/colon), inflammatory status (non-inflamed/inflamed) and disease diagnosis (control/CD/UC), shows that variation in host gene expression can be significantly explained by tissue location and inflammatory status (Wilcoxon signed-rank test). B Venn diagram showing the number of tissue inflammation-associated genes for all three comparisons and how many of them were shared among these comparisons: blue, ileal tissue from controls vs. non-inflamed tissue from patients with CD vs. inflamed tissue from patients with CD (n = 3157), yellow, colonic tissue from controls vs. non-inflamed tissue from patients with CD vs. inflamed tissue from patients with CD (n = 3486) and red, colonic tissue from controls vs. non-inflamed tissue from patients with UC vs. inflamed tissue from patients with UC (n = 6710) (adjusted P < 0.05 considering multiple comparisons). C Relevant examples of four inflammation-associated genes, DUOX2, JAK2, MUC1 and IL17A, illustrating the presence of tissue inflammation (linear regression, t-test, adjusted P < 0.05). The sample sizes from left to right are 9, 115, 65, 43, 126, 50, 43, 137 and 96. CDi, inflamed tissue from patients with Crohn’s disease. CD-non, non-inflamed tissue from patients with Crohn’s disease. PC, principal component. UCi, inflamed tissue from patients with ulcerative colitis. UC-non, non-inflamed tissue from patients with ulcerative colitis. Box plots show medians and the first and third quartiles (the 25th and 75th percentiles), respectively. The upper and lower whiskers extend the largest and smallest value no further than 1.5 × IQR. Source data are provided as a Source Data file.
Fig. 3
Fig. 3. Overall characterization of mucosa-attached microbiota in patients with IBD and controls.
A Microbial alpha-diversity (Shannon index) was lowest in samples from patients with CD (n = 356) compared to patients with UC (n = 289) and non-IBD controls (n = 52) (Wilcoxon signed-rank test). B PCA plot based on Aitchison’s distances demonstrates the microbial dissimilarity of the mucosa-attached microbiota (colors as in A). C The degree of microbial dissimilarity (as measured by Aitchison’s distances) is significantly higher in biopsies from patients with CD (n = 356), followed by patients with UC (n = 289) and non-IBD controls (n = 52) (Wilcoxon signed-rank test). D, Microbial dissimilarity is higher in samples from different individuals (inter-individual) when compared to paired samples from the same individual (intra-individual), which includes paired inflamed–non-inflamed tissue from ileum and colon (left panel, inter-colon: n = 11,430, inter-ileum: n = 7377, intra: n = 203), paired colonic tissue samples from inflamed and non-inflamed areas (middle panel, inter-inflamed: n = 7372, inter-non-inflamed: n = 8369, intra: n = 166) and paired ileal tissue samples from inflamed and non-inflamed areas (right panel, inter-inflamed: n = 1590, inter-non-inflamed: n = 1592, intra: n = 73) (Wilcoxon signed-rank test). E Hierarchical analysis performed using an end-to-end statistical algorithm (HAllA) at genus level indicates the main phenotypic factors that correlate with intestinal mucosal microbiota composition. Significantly associated phenotypic factors were plotted after BH-approach correction. Heatmap color palette indicates the relative pairwise normalized mutual information (NMI). Numbers in cells identify significant pairs of features (phenotypic factors vs. bacterial taxa) during hierarchical analysis, where the numbers represent the descending order of statistically significant block associations based on P values in each block. White dots in cells indicate the marginal significance of a particular pair of features. CD Crohn’s disease. PCA principal component analysis. UC ulcerative colitis. Box plots show medians and the first and third quartiles (the 25th and 75th percentiles), respectively. The upper and lower whiskers extend the largest and smallest value no further than 1.5 × IQR. Source data are provided as a Source Data file.
Fig. 4
Fig. 4. Mucosal host–microbe interaction modules in the context of IBD.
Sparse canonical correlation analysis (sparse-CCA) was performed across inflamed and non-inflamed biopsies to identify distinct correlation modules of mucosal gene expression vs. mucosal microbiota. Using 1441 inflammation-related genes and 131 microbial taxa as input, we identified seven distinct pairs of significantly correlated gene-microbe components in non-inflamed tissue and six distinct pairs in inflamed tissue (adjusted P < 0.05). A Heatmap showing significant component pairs from sparse-CCA analysis consisting of microbial taxa (horizontal axis) and host pathways (vertical axis) to which the involved genes were annotated (Spearman correlation, adjusted P < 0.05). Yellow boxes and dots indicate shared significant component pairs between inflamed and non-inflamed tissues, red colors indicate significant component pairs only in inflamed tissues, blue colors indicate significant component pairs only in non-inflamed tissues, and white colors indicate the absence of significant correlations. Dot sizes represent the degree of statistical significance of correlated component pairs. B Examples of inverse correlations existing between key genes involved in collagen and ECM biosynthesis (COL18A1, COL1A2, COL4A1, and COL5A2) and the mucosal abundance of Erysipelotrichaceae UCG 003 taxon, representing the significant component pairs observed in both inflamed and non-inflamed tissues as visualized in the right upper corner of panel A. The shaded areas represent the 95% confidence intervals for predictions from a linear model. Source data are provided as a Source Data file.
Fig. 5
Fig. 5. Fibrostenotic CD and TNF-α-antagonist usage significantly alter mucosal host–microbe interactions in the context of IBD.
CentrLCC-network analyses were performed to characterize altered mucosal host–microbe interactions between different patient phenotypes. Overall, fibrostenotic CD (Montreal B2 vs. non-stricturing, non-penetrating CD, i.e. Montreal B1) and use of TNF-α-antagonists (vs. non-users) demonstrated altered interaction networks. A Network graphs showing an example of Lachnoclostridium-associated gene clusters in patients with non-stricturing, non-penetrating CD (Montreal B1) (left) and patients with fibrostenotic CD (Montreal B2) (right). Lachnoclostridium was the top bacteria involved (covering 65% of total associations in non-stricturing, non-penetrating CD and decreasing to 27% in fibrostenotic CD). Red dots indicate mucosal microbiota. Gray dots indicate the genes annotated by Reactome pathways. Yellow lines indicate positive associations between gene expression and bacterial abundances. Blue lines indicate negative associations. Middle panel shows key examples that significantly altered in the two patient groups, including genes involved in immunoregulatory interactions between lymphoid and non-lymphoid cells and tyrosine kinase signaling (CD8A and CXCR5). Correlations were prioritized on statistical significance. B Network graphs showing the example of microbiota–gene interaction networks in patients not using TNF-α-antagonists (left) vs. patients using TNF-α-antagonists (right). Ruminococcaceae UCG_002 was altered in interactions with host genes in patients using TNF-α-antagonists. Middle panel shows key examples of Ruminococcaceae UCG_002–gene interactions. These genes were involved in general biological processes such as the cell cycle but also included genes involved in fatty acid metabolism (PDK4 and ACAA1). Correlations were prioritized on statistical significance. The shaded areas represent the 95% confidence intervals for predictions from a linear model. Source data are provided as a Source Data file.
Fig. 6
Fig. 6. Mucosal host–microbe interactions depend on individual dysbiotic status.
A PCA of mucosal 16 S rRNA sequencing data shows that degree of mucosal dysbiosis scores. B Dysbiosis scores were generally higher among patients with CD and UC compared to non-IBD controls (Spearman correlation test). C Key examples of individual gene–bacteria interactions that demonstrate a directional shift upon dysbiotic samples (higher dysbiosis 90–100%) as compared to patients with eubiotic samples (lower dysbiosis scores 0–90%) in IBD (linear regression model, t test, adjusted P < 0.05). Mucosal Lachnospiraceae bacteria positively associate with the expression of the PLAUR, CXCL17, IL1RN and S100A8 genes. CD, Crohn’s disease. PC, principal component. UC, ulcerative colitis. r, Spearman correlation coefficient. The shaded areas represent the 95% confidence intervals for predictions from a linear model. The Source data are provided as a Source Data file.
Fig. 7
Fig. 7. Mucosal microbiota associate with distinct intestinal mucosal cell types.
A Boxplots show the amount of variation in intestinal cell type–enrichment that could be explained by a combination of factors. Heatmap below shows the relative contribution of different factors in explaining this intestinal cell type–enrichment, including ‘basic factors’ (age, sex and BMI), medication use, tissue inflammatory status, tissue location and microbiota. Mucosal microbiota contributed most to the variation in the enrichment of intestinal epithelial cells, M1-macrophages, NK cells and eosinophils. B Boxplots showing the contribution of the main bacterial taxa that explain the variation in mucosal enrichment of intestinal epithelial cells, M1-macrophages and NK cells—the cell types that interacted most strongly with the mucosal microbiota. Box plots show medians and the first and third quartiles (the 25th and 75th percentiles), respectively. The upper and lower whiskers extend the largest and smallest value no further than 1.5 × IQR. Source data are provided as a Source Data file.

References

    1. Chang JT. Pathophysiology of inflammatory bowel diseases. N. Engl. J. Med. 2020;383:2652–2664. doi: 10.1056/NEJMra2002697. - DOI - PubMed
    1. de Lange KM, et al. Genome-wide association study implicates immune activation of multiple integrin genes in inflammatory bowel disease. Nat. Genet. 2017;49:256–261. doi: 10.1038/ng.3760. - DOI - PMC - PubMed
    1. Franzosa EA, et al. Gut microbiome structure and metabolic activity in inflammatory bowel disease. Nat. Microbiol. 2019;4:293–305. doi: 10.1038/s41564-018-0306-4. - DOI - PMC - PubMed
    1. Vich Vila A, et al. Gut microbiota composition and functional changes in inflammatory bowel disease and irritable bowel syndrome. Sci. Transl. Med. 2018;10:eaap8914. doi: 10.1126/scitranslmed.aap8914. - DOI - PubMed
    1. Hu S, et al. Whole exome sequencing analyses reveal gene-microbiota interactions in the context of IBD. Gut. 2021;70:285–296. doi: 10.1136/gutjnl-2019-319706. - DOI - PMC - PubMed