. 2024 Feb 17;17(1):10.
doi: 10.1186/s13041-024-01082-w.

A simple and reliable method for claustrum localization across age in mice

Affiliations

A simple and reliable method for claustrum localization across age in mice

Tarek Shaker et al. Mol Brain. .

Erratum in

Abstract

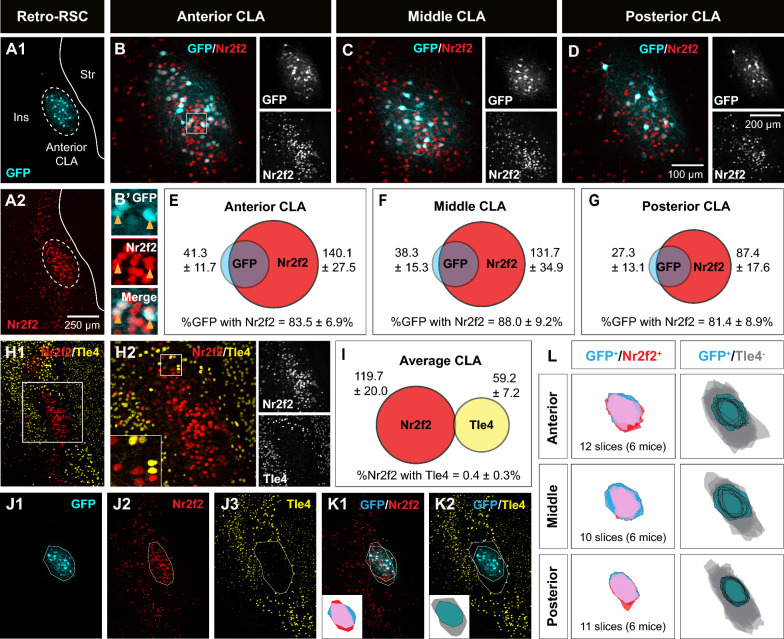
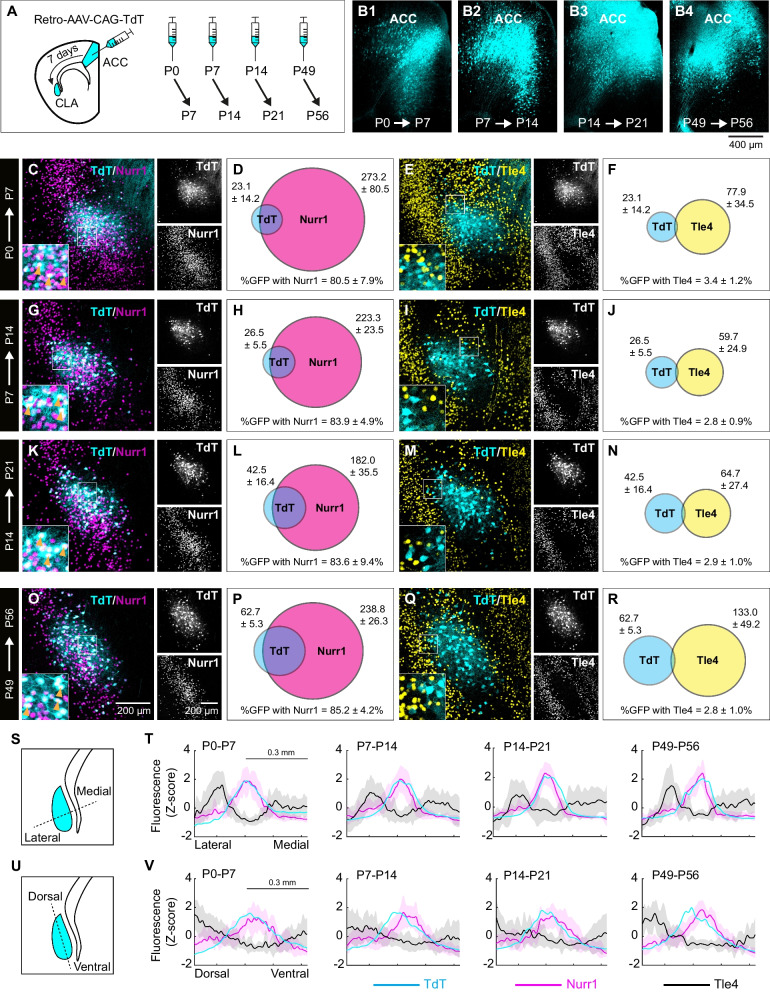
The anatomical organization of the rodent claustrum remains obscure due to lack of clear borders that distinguish it from neighboring forebrain structures. Defining what constitutes the claustrum is imperative for elucidating its functions. Methods based on gene/protein expression or transgenic mice have been used to spatially outline the claustrum but often report incomplete labeling and/or lack of specificity during certain neurodevelopmental timepoints. To reliably identify claustrum projection cells in mice, we propose a simple immunolabelling method that juxtaposes the expression pattern of claustrum-enriched and cortical-enriched markers. We determined that claustrum cells immunoreactive for the claustrum-enriched markers Nurr1 and Nr2f2 are devoid of the cortical marker Tle4, which allowed us to differentiate the claustrum from adjoining cortical cells. Using retrograde tracing, we verified that nearly all claustrum projection neurons lack Tle4 but expressed Nurr1/Nr2f2 markers to different degrees. At neonatal stages between 7 and 21 days, claustrum projection neurons were identified by their Nurr1-postive/Tle4-negative expression profile, a time-period when other immunolabelling techniques used to localize the claustrum in adult mice are ineffective. Finally, exposure to environmental novelty enhanced the expression of the neuronal activation marker c-Fos in the claustrum region. Notably, c-Fos labeling was mainly restricted to Nurr1-positive cells and nearly absent from Tle4-positive cells, thus corroborating previous work reporting novelty-induced claustrum activation. Taken together, this method will aid in studying the claustrum during postnatal development and may improve histological and functional studies where other approaches are not amenable.

Keywords: Anterior cingulate cortex; Claustrum; Clautrocortical; Nr2f2; Nurr1; Open field; Retrosplenial cortex; Tle4; c-Fos.


Conflict of interest statement

The authors declare no competing interests.

Figures

Fig. 1
Fig. 1
The expression pattern of Nurr1 and Tle4 in the claustrum region distinguishes claustrum projection neurons from their cortical counterparts in layer 5 and 6. A Retrograde AAV-CAG-GFP was injected into the retrosplenial cortex (RSC), followed by tissue collection 14 days post injection. B An example tracer injection site in the retrosplenial cortex. C, E representative images of retrograde GFP labeling in the anterior claustrum (D, F), and representative images showing Nurr1 (D) and Tle4 (F) expression relative to GFP labeling. CD are from the same slice, and E, F are from an adjacent slice of the same mouse. Dashed ellipses in (CF) highlight GFP expression in the claustrum (CLA) without labeling the surrounding insula cortex (Ins) or striatum (str). G, H Representative images showing the degree of colocalization with Nurr1 (G) or Tle4 labelled cells (H). Single channel images are shown on the right of each panel. G’, H’ 3.5 × fold magnifications of areas in white boxes in (G, H), respectively, with single channel (left, middle) and merged (right) images. Orange arrowheads indicate examples of cell colocalization. I Venn diagrams showing the mean cell counts for Nurr+/GFP+ and Tle4+/GFP+ cells in the anterior CLA. Values throughout indicate mean ± standard deviation (n = 6 mice, 3 male and 3 female). J-L: The same as G-I but for the middle CLA. MO The same as (GI) for the posterior CLA. P Nurr1 and Tle4 colocalization in the CLA region was compared to layer 6b (Ctx L6b) of the primary motor cortex (MOp) and the somatosensory cortex (SSC). QS Representative images showing Nurr1 and Tle4 expression in the CLA region (Q), the MOp (R) and the SSC (S) (left, merged imaging channels; right, single channel images). Insets are 2.5 × fold magnifications of areas in white boxes. Red arrowheads indicate examples of cell colocalization. TV Venn diagrams representing the mean number of cells expressing Nurr1 (magenta) and Tle4 (yellow), and colocalization between Nurr1 with Tle4 (n = 4 mice, 2 male and 2 female). The data in T are averaged across anterior, middle, and posterior CLA. Values in I, L, O, T, U, V represent mean ± standard deviation. Panels P–V: See Additional file 2: Table S1 for details on mouse sex
Fig. 2
Fig. 2
Spatial pattern of Nr2f2 and Tle4 expression enables localization of claustrum projection neurons. A1A2 Representative images of the anterior claustrum showing retrograde GFP labeling (A1) and Nr2f2 expression (A2) following AAV injection into the retrosplenial cortex (Retro-RSC). Dashed ellipses highlight GFP expression in the claustrum (CLA) without labeling the surrounding insula cortex (Ins) or striatum (str). BD Representative images showing colocalization of GFP labeling with Nr2f2 in the anterior (B), middle (C) and posterior (D) CLA (left, merged imaging channels; right, single channel images). (B’) 2.3 × fold magnifications of area in the white boxes in (B) with single channel (top, middle) and merged (bottom) images. Orange arrowheads indicate examples of cell colocalization. EG Venn diagrams representing the mean number of cells expressing Nr2f2 (red) and GFP (cyan), and colocalization of GFP with Nr2f2 in the anterior (E), middle (F), and posterior (G) CLA. Values indicate mean ± standard deviation from n = 6 mice (3 male and 3 female). H1, H2 Two representative images of the same coronal plane showing lack of colocalization between Nr2f2 and Tle4 in the CLA. H2 is a magnified image of the dashed box in (H1). For H2, merged imaging channels are on the left and single channel images are on the right. Inset (bottom-left) is 2.5 × fold magnifications of area in the white box. I Venn diagram representing the mean number of cells expressing Nr2f2 (red) and Tle4 (yellow), and the colocalization of Nr2f2 with Tle4, averaged across anterior, middle and posterior CLA (n = 6 mice, 3 male and 3 female). J1J3 Example images of the CLA region showing polygons outlining the boundaries of GFP cells and neuropil (cyan, J1), Nr2f2 concentric expression (red, J2), and absence of Tle4 expression (grey, J3). K1, K2 Overlay of polygons from (J1J3). Bottom-left insets show spatial registration of GFP outline with Nr2f2 outline (K1), and GFP outline with Tle4 outline (K2) (see Materials and Methods for details). Pink represents the topographic overlap of GFP/Nr2f2 expression, grey represents the region of low Tle4 expression. L Cumulative spatial overlap of GFP+/Nr2f2+ labeling (left), and the spatial location of GFP labeling within the region of relative Tle4 absence (GFP+/Tle4, right), in the anterior (top), middle (middle) and posterior (bottom) CLA across 6 mice. Values in E, F, G, I represent mean ± standard deviation
Fig. 3
Fig. 3
Claustrum neurons projecting to different cortical regions exhibit colocalization with Nurr1 and Nr2f2, but not with Tle4. A Injection of retrograde AAV-CAG-GFP into the anterior cingulate cortex (ACC). Claustrum tissue was processed 14 days post injection. B Example of an AAV injection site in the ACC. C1C4 Representative images from coronal sections of the anterior claustrum (CLA) relative to the insula (Ins) and the striatum (Str) showing retrograde GFP labeling following AAV injection the ACC (C1), along with the expression of Nurr1 (C2), Nr2f2 (C3), Tle4 (C4), and merged Tle4/GFP (C5). All panels are from the same slice, except Nurr1 which is from an adjacent slice. Dashed ellipses highlight the region of low Tle4 expression. DF: Representative images (left) and Venn diagrams (right) showing colocalization of GFP labeling with Nurr1 (D), Nr2f2 (E) and Tle4 (F) in the anterior CLA. Panels E and F are the same slice. Venn diagrams in each panel show the mean number of cells expressing GFP with Nurr1 (D), Nr2f2 (E), and Tle4 (F) (n = 5 mice, all male). Values shown are the average cell counts across anterior, middle, and posterior planes of the CLA. Insets in left panels of D, E, F are 2.5 × fold magnifications of areas in white boxes. Orange arrowheads indicate examples of cell colocalization. GL Same as AF but for experiments with retrograde AAV-CAG-GFP injected into the primary motor cortex (MOp) (n = 4 mice, all male). MR Same as A–F, but for retrograde AAV-CAG-GFP injected into the lateral entorhinal cortex (LEC) (n = 4 mice, all male). Values in right panels of D, E, F, J, K, L, P, Q, R represent mean ± standard deviation
Fig. 4
Fig. 4
Claustrum neurons projecting to the retrosplenial cortex express Nurr1 and Nr2f2 more extensively than other claustrocortical pathways. AC Bar plots showing the mean percentage of GFP-expressing cells colocalized with Nurr1 (Nurr1+GFP+) in neurons projecting to the retrosplenial cortex (RSC), anterior cingulate cortex (ACC), primary motor cortex (MOp) and lateral entorhinal cortex (LEC) in the anterior (A), middle (B) and posterior (C) claustrum (CLA). DF Same as A-C, but for GFP-expressing cells colocalized with Nr2f2 (Nr2f2+GFP+). GI Same as A–C, but for GFP-expressing cells colocalized with Tle4 (Tle4+GFP+). Error bars represent mean ± SEM; *p < 0.05, **p < 0.01, ***p < 0.001, ****p < 0.0001; one-way ANOVA followed by Bonferroni test (see Additional file 2: Table S2 for detailed statistical analysis). RSC (n = 6 mice, 3 male and 3 female), ACC (n = 5 mice, all male), MOp (n = 4 mice, all male), LEC (n = 4 mice, all male)
Fig. 5
Fig. 5
Claustrum cells in neonatal mice display the same Nurr1/Tle4 expression pattern as adult mice. A Injection of retrograde AAV-CAG-TdT into the anterior cingulate cortex (ACC) at different postnatal days, followed by tissue collection 7 days post injection. B1B4 Examples of AAV injection sites in the ACC at P7 (B1), P14 (B2), P21 (B3) and P56 (B4) following injection at P1, P7, P14 and P49, respectively. CF Representative images C, E showing the colocalization of TdTomato (TdT) labeling with Nurr1 (C) and Tle4 (E) in the anterior claustrum (CLA) at P7 (left, merged imaging channels; right, single channel images). Venn diagrams D, F representing the mean number of cells at P7 expressing Nurr1 and TdT (D), or Tle4 and TdT (F) (n = 5 mice). Values shown are the average cell counts from the anterior, middle and posterior coronal planes of the CLA. GJ Same as C–F, but for mice injected at P7 and perfused at P14 (n = 6 mice). KN Same as C–F but for mice injected at P14 and perfused at P21 (n = 7 mice). OR Same as C–F, but for mice injected at P49 and perfused at P56 (n = 5 mice). S Quantification of fluorescence intensity in the CLA region (cyan) in the medial–lateral axis (dashed line). T Measurement of fluorescence intensity (z-score) for TdT (cyan), Nurr1 (magenta) and Tle4 (black) labeling across the mediolateral axis of the CLA region at P7, P14, P21 and P56 (from left to right). Solid lines for each color represent the mean and light shaded areas of the same color represent standard deviation. U, V: Same as S–T, but for the dorsoventral axis. Insets in left panels of C, E, G, I, K, M, O, Q (bottom-left) are 2.5 × fold magnifications of areas in white boxes. Orange arrowheads indicate examples of cell colocalization. Values in D, F, H, J, L, N, P, R represent mean ± standard deviation (see Additional file 2: Table S3 for details on mouse sex)
Fig. 6
Fig. 6
Exposure to a novel environment induces substantial activation of Nurr1-expressing cells and minimal activation of Tle4-expressing cells in the claustrum region. The marker for neuronal activation cFos was induced in the claustrum (CLA) by exposing mice to a novel open field (OF) for 10 min, followed by perfusion after 60–90 min. AC Representative images of the anterior CLA relative to the insula (Ins) and the striatum (Str) in naive control mice showing the expression of cFos (A), Nurr1 (B) and Tle4 (C). Dashed ellipses highlight absence of Tle4 expression in the CLA. D, E Representative images showing colocalization of cFos with Nurr1 (D) and Tle4 (E) in the anterior CLA. FH Same as A–C but for mice exposed to OF. I, J Same as D, E but for mice exposed to OF. KM Bar plots comparing naive and OF-exposed mice with respect to (K) the mean number of cFos-expressing cells, L the percentage of cFos-expressing cells colocalized with Nurr1 (cFos+Nurr1+) relative to the total number of Nurr1-expressing (Nurr1+) cells, and M the percentage of cFos-expressing cells colocalized with Tle4 (cFos+Tle4+) relative to the total number of Tle4-expressing (Tle4+) surrounding the CLA region. N, O Venn diagrams representing the mean number of cells expressing cFos (cyan, N, O), Nurr1 (magenta, N) and Tle4 (yellow, O), along with the colocalization of cFos with Nurr1 (N), and cFos with Tle4 (O) relative to the total number of cFos-expressing cells in the OF group. Values shown are the average cell counts across the anterior, middle and posterior planes of the CLA. Insets in D, E, I, J (bottom-left) are 2 × fold magnifications of areas in white boxes. Orange arrowheads indicate examples of cell colocalization. Error bars in K–M represent mean ± SEM; **p < 0.01, ****p < 0.0001; unpaired t-test: (K) t(13) = 7.53, p = 4.3 × 106, (L): t(13) = 7.29, p = 6.1 × 106, (M) t(13) = 3.68, p = 0.003. Values in N, O represent mean ± standard deviation. Naive group (n = 5 mice), OF group (n = 10 mice) (see Additional file 2: Table S4 for details on mouse sex)
Fig. 7
Fig. 7
Schematic representation of mapping the claustrum using the claustrum-enriched markers Nurr1 and Nr2f2 in combination with the claustrum-devoid cortical marker Tle4. Nurr1-expressing (Nurr1+) and Nr2f2-expressing (Nr2f2+) cells are enriched in the claustrum, but they are also found in surrounding structures. While the dense patch of Nurr1+ cells is found in different claustrum zones, the dense patch of Nr2f2+ cells maps the central zone of the claustrum. Tle4-expressing (Tle4+) cells are devoid from the claustrum with the exception of very few cells in the dorsal and ventral zones, and they are enriched in structures surrounding the claustrum. Juxtaposition of Nurr1+/Nr2f2+ cells with Tle4+ cells delineates claustrum borders. CLA claustrum, Ctx cortex, DEn dorsal endopiriform nucleus, Ins insula, Str striatum

References

    1. Edelstein LR, Denaro FJ. The claustrum: a historical review of its anatomy, physiology, cytochemistry and functional significance. Cell Mol Biol. 2004;50(6):675–702. - PubMed
    1. Goll Y, Atlan G, Citri A. Attention: the claustrum. Trends Neurosci. 2015;38(8):486–95. - PubMed
    1. Wang Q, Ng L, Harris JA, Feng D, Li Y, Royall JJ, et al. Organization of the connections between claustrum and cortex in the mouse. J Comp Neurol. 2017;525(6):1317–46. - PMC - PubMed
    1. Bruguier H, Suarez R, Manger P, Hoerder-Suabedissen A, Shelton AM, Oliver DK, et al. In search of common developmental and evolutionary origin of the claustrum and subplate. J Comp Neurol. 2020;528(17):2956–77. - PubMed
    1. Jackson J, Smith JB, Lee AK. The anatomy and physiology of claustrum-cortex interactions. Annu Rev Neurosci. 2020;8(43):231–47. - PubMed

Grants and funding

LinkOut - more resources