. 2024 Feb 17;10(1):85.
doi: 10.1038/s41420-024-01857-z.

Role of PATJ in stroke prognosis by modulating endothelial to mesenchymal transition through the Hippo/Notch/PI3K axis

Affiliations

Role of PATJ in stroke prognosis by modulating endothelial to mesenchymal transition through the Hippo/Notch/PI3K axis

Aina Medina-Dols et al. Cell Death Discov. .

Abstract

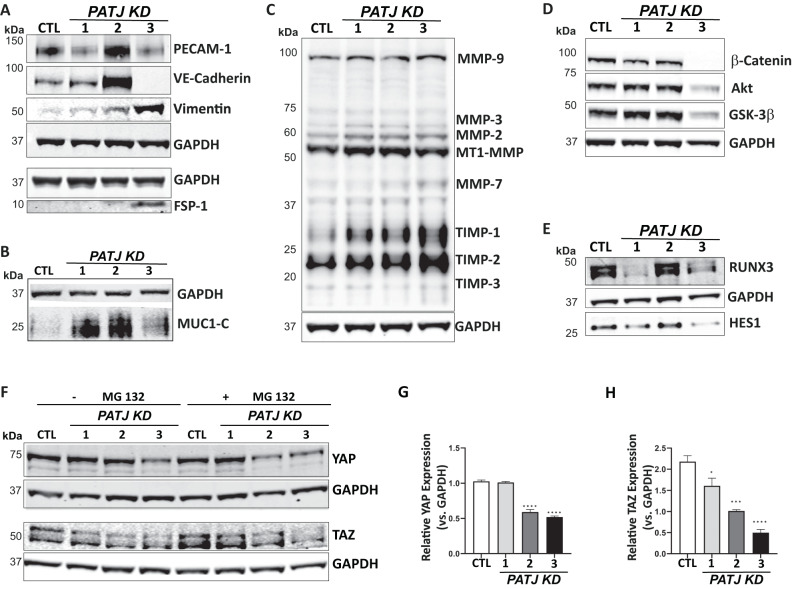
Through GWAS studies we identified PATJ associated with functional outcome after ischemic stroke (IS). The aim of this study was to determine PATJ role in brain endothelial cells (ECs) in the context of stroke outcome. PATJ expression analyses in patient's blood revealed that: (i) the risk allele of rs76221407 induces higher expression of PATJ, (ii) PATJ is downregulated 24 h after IS, and (iii) its expression is significantly lower in those patients with functional independence, measured at 3 months with the modified Rankin scale ((mRS) ≤2), compared to those patients with marked disability (mRS = 4-5). In mice brains, PATJ was also downregulated in the injured hemisphere at 48 h after ischemia. Oxygen-glucose deprivation and hypoxia-dependent of Hypoxia Inducible Factor-1α also caused PATJ depletion in ECs. To study the effects of PATJ downregulation, we generated PATJ-knockdown human microvascular ECs. Their transcriptomic profile evidenced a complex cell reprogramming involving Notch, TGF-ß, PI3K/Akt, and Hippo signaling that translates in morphological and functional changes compatible with endothelial to mesenchymal transition (EndMT). PATJ depletion caused loss of cell-cell adhesion, upregulation of metalloproteases, actin cytoskeleton remodeling, cytoplasmic accumulation of the signal transducer C-terminal transmembrane Mucin 1 (MUC1-C) and downregulation of Notch and Hippo signaling. The EndMT phenotype of PATJ-depleted cells was associated with the nuclear recruitment of MUC1-C, YAP/TAZ, β-catenin, and ZEB1. Our results suggest that PATJ downregulation 24 h after IS promotes EndMT, an initial step prior to secondary activation of a pro-angiogenic program. This effect is associated with functional independence suggesting that activation of EndMT shortly after stroke onset is beneficial for stroke recovery.


Conflict of interest statement

The authors declare no competing interests.

Figures

Fig. 1
Fig. 1. PATJ downregulation after IS associates with favorable functional outcome at 3 months.
PATJ mRNA expression determined by RT-PCR (A, C, D) and by array-based gene expression (B). A Lower PATJ mRNA expression in peripheral blood extracted 24 h after IS in patients with functional independence (mRS < 3, n = 25) compared with patients with marked disability (mRS > 3, n = 25). *p < 0.05 as compared to mRS > 3 (Student’s t-test). B The G risk allele of rs76221407 SNP of PATJ gene confers higher expression in peripheral blood. *p < 0.05 as compared to the AA genotype (Student’s t-test). C Patj expression significantly decay in the ischemic region of mice brain subjected to 1 h transient middle cerebral artery occlusion. Patj mRNA levels were compared between the ipsilateral ischemic region (IL) and the contralateral CTL region (CL) of cortical brain homogenates, measured at 48 h after reperfusion. **p < 0.01 as compared to CL region (Paired t-test). D Oxygen-glucose deprivation (OGD) for 5 and 10 h induces PATJ downregulation in hCMEC/D3 ECs. **p < 0.01; *p < 0.05 as compared to normoxia (Student’s t-test). E PATJ steady-state levels significantly decrease in ECs subjected to HIF-1α-dependent chemical hypoxia. Depletion of the 80 kDa specie of PATJ observed after 4 h incubation with cobalt chloride (CoCl2). Prolonged incubation for 24 and 48 h accounted for depletion of the 230 and 200 kDa species. GAPDH was used as loading control. F Relative quantification of the integrated band intensities of three different WBs. Bars represent mean intensity ± SD. *p < 0.05; **p < 0.01 as compared to CTL cells (ANOVA followed by Bonferroni’s test).
Fig. 2
Fig. 2. PATJ depletion in human brain microvascular endothelial cells (hCMEC/D3) causes the loss of tight junctions and confers a dramatic morphological change.
A WB showing PATJ expression in three clones. Five main species were identified (230, 200, 135, 80, and 60 kDa). GAPDH was used as loading control. B Relative quantification of the integrated band intensities of three different WBs for PATJ species. Bars represent mean intensity ± SD. *p < 0.05; **p < 0.01; ***p < 0.005 and ****p < 0.0001 as compared to CTL cells (ANOVA followed by Bonferroni’s test). C PATJ KD3 cells lost their cell-cell interactions, as evidenced by immunofluorescence against the TJs protein zonula occludens 1 (ZO-1). D Differential expression of TJs proteins in the three PATJ KD cells. WB analyses showed that the loss of TJs in PATJ KD3 was due to the depletion of its constituent proteins ZO-1, occludin, and claudin-11. The two intermediate PATJ KD clones (KD1 and KD2) had different immunoreactive bands for occludin and ZO-1 than CTLs. E Transwell permeabilization assay evidenced a complete loss of permeability of the PATJ KD3 cells. *p < 0.05 as compared to CTLs (Student’s t-test).
Fig. 3
Fig. 3. PATJ KD causes a massive transcriptomic reprogramming.
A Hierarchical cluster showing the 74 most differentially expressed genes between PATJ KD and CTLs in the normalized (Log2 fold change (FC)) heatmap. PATJ KD1, 2, 3, and 4 were used. Level of expression was represented by color scale from green (low) to red (high), as indicated by the scale bar at the top. B Gene ontology (GO) analysis among the significantly modulated genes with an FDR cut-off of 0.05 revealed enrichment of biological processes such as Endothelial to Mesenchymal Transition (EndMT), Unfolded Protein Response (UPR) and Actin Cytoskeleton Organization. The results are visualized as a dot plot with an X-axis representing the gene ratio and the Y axis representing the FDR p-value. C Gene Set Enrichment Analysis (GSEA) for Gene Ontology (GO) and Kyoto Encyclopedia of Genes and Genomes (KEGG) enrichment between PATJ KD and CTL cells identified Notch, BMP and G-protein coupled receptor signaling as significant signaling pathways. D EnhancedVolcano plot of −log10 (p-values) vs. log2 FC. The −log10 (p-values) represents the level of significance of each gene while log2 FC represents the difference between the levels of expression for each gene between PATJ KD and CTL cells. E Gene-concept network (Cnetplot) showing the links between genes and the most significant cell signaling pathways, obtained with an FDR cut-off of 0.05, by using GSEA WikiPathways. The size of the concept nodes depends on the gene count involved in that pathway, while the color of the gene nodes depends on their expression level according to the displayed color gradient representing the log2 FC. Each number represents a significant pathway: NOTCH (1); BMP (2); TFG- β (3); PI3K/Akt (4) and VEGFA-VEGFR (5).
Fig. 4
Fig. 4. PATJ knockdown induces EndMT and downregulates the Notch, PI3K/Akt, and the Hippo pathways.
WB analysis of: A EndMT markers PECAM-1/CD31, VE-Cadherin, Vimentin, and FSP-1/S100A4; B C-terminal subunit of mucin 1 (MUC1-C); C Matrix Metalloproteases (MMPs) and Tissue inhibitors of MMPs (TIMPs). D Notch signaling transcriptional modulators HES1 and RUNX3; E PI3K/Akt proteins Akt, GSK3-β, and β-catenin; F Hippo co-activators YAP/TAZ. GAPDH was used as loading control in all blots. G, H Relative quantification of the integrated band intensities of three independent WB for YAP (G) and TAZ (H). Bars represent mean intensity ± SD of three independent experiments. *p < 0.05; ***p < 0.005; ****p < 0.0001 as compared to CTL cells (ANOVA followed by Bonferroni’s test).
Fig. 5
Fig. 5. PATJ depletion causes nuclear translocation of YAP/TAZ, MUC1-C, β-catenin, and ZEB1 and actin cytoskeleton remodeling.
A Cytosolic (Cyt) and Nuclear (Nucl) localization of ZEB1, β-catenin, YAP/TAZ, and MUC1-C. Voltage-dependent anion channel (VDAC) and LIM Kinase (LIMK) were used as cytosolic markers and Histone 3 (H3) as nuclear marker. BF Quantifications of nuclear/cytosolic ratios for YAP (B), TAZ (C), MUC1-C (D), β-catenin (E) and ZEB1 (F). G Immunofluorescence using phalloidin to label F-actin (red) and YAP-antibody (green). H, I PATJ KD decreased the F/G actin ratio. H Representative immunoblot of F-actin and G-actin. I Relative quantification of the F/G actin ratio. Bars represent mean intensity ± SD of three independent experiments. ***p < 0.005 as compared to CTL cells (ANOVA followed by Bonferroni’s test). J WB analysis showing depletion of the actin cytoskeleton markers myosin light chain (MLC) and ARHGAP6 in PATJ KD3 cells.
Fig. 6
Fig. 6. PATJ depletion induces a pro-inflammatory phenotype characterized by increased expression of cell adhesion molecules and production of IL-6 and IL-8.
A Differential expression of the cell adhesion molecules ICAM-1 and CD44, as well as TRAF6 in PATJ KD cells, revealed by WB analysis. B, C Basal secretion of IL-6 (B) and IL-8 (C). PATJ KD3 cells produce significantly higher amounts of IL6. D, E Secretion of IL-6 (D) and IL-8 (E) after LPS incubation. Bars represent the mean of media cytokine detection (pg/ml) ± SD of three independent experiments. Counts were performed after 24 h of cell culture (B, C) or after 2, 4, or 8 h incubation with LPS (D, E). *p < 0.05, as compared to CTL cells (ANOVA followed by Bonferroni’s test).
Fig. 7
Fig. 7. The EndMA state of intermediate PATJ KD cells favors cell migration and tubular network formation.
A, B Wound healing assay showed that intermediate PATJ KD clones migrate significantly faster after 4 and 8 h post-scratch. C, D Intermediate PATJ KD clones retain the ability for tubulogenesis, meanwhile the PATJ KD3 with mesenchymal phenotype could not perform angiogenesis in vitro, as shown with the tubular network formation assay of cells grown on Matrigel (10 mg/ml). D Total tube length quantification of three independent experiments, measured with the customized computer analysis “Angiogenesis Analyzer” for the Image J Program. *p < 0.05; **p < 0.01 and ****p < 0.001 as compared to CTL cells (ANOVA followed by Bonferroni’s test).

References

    1. Rajsic S, Gothe H, Borba HH, Sroczynski G, Vujicic J, Toell T, et al. Economic burden of stroke: a systematic review on post-stroke care. Eur J Health Econ. 2019;20:107–34. doi: 10.1007/s10198-018-0984-0. - DOI - PubMed
    1. Mola-Caminal M, Carrera C, Soriano-Tarraga C, Giralt-Steinhauer E, Diaz-Navarro RM, Tur S, et al. PATJ low frequency variants are associated with worse ischemic stroke functional outcome. Circ Res. 2019;124:114–20. doi: 10.1161/CIRCRESAHA.118.313533. - DOI - PMC - PubMed
    1. Martin E, Girardello R, Dittmar G, Ludwig A. New insights into the organization and regulation of the apical polarity network in mammalian epithelial cells. FEBS J. 2021;288:7073–95. doi: 10.1111/febs.15710. - DOI - PubMed
    1. Tan B, Yatim S, Peng S, Gunaratne J, Hunziker W, Ludwig A. The mammalian crumbs complex defines a distinct polarity domain apical of epithelial tight junctions. Curr Biol. 2020;30:2791–804.e2796. doi: 10.1016/j.cub.2020.05.032. - DOI - PubMed
    1. Michel D, Arsanto JP, Massey-Harroche D, Beclin C, Wijnholds J, Le Bivic A. PATJ connects and stabilizes apical and lateral components of tight junctions in human intestinal cells. J Cell Sci. 2005;118:4049–57. doi: 10.1242/jcs.02528. - DOI - PubMed

Grants and funding