. 2024 Feb 17;15(1):1460.
doi: 10.1038/s41467-024-45863-2.

ALLO-1- and IKKE-1-dependent positive feedback mechanism promotes the initiation of paternal mitochondrial autophagy

Affiliations

ALLO-1- and IKKE-1-dependent positive feedback mechanism promotes the initiation of paternal mitochondrial autophagy

Taeko Sasaki et al. Nat Commun. .

Abstract

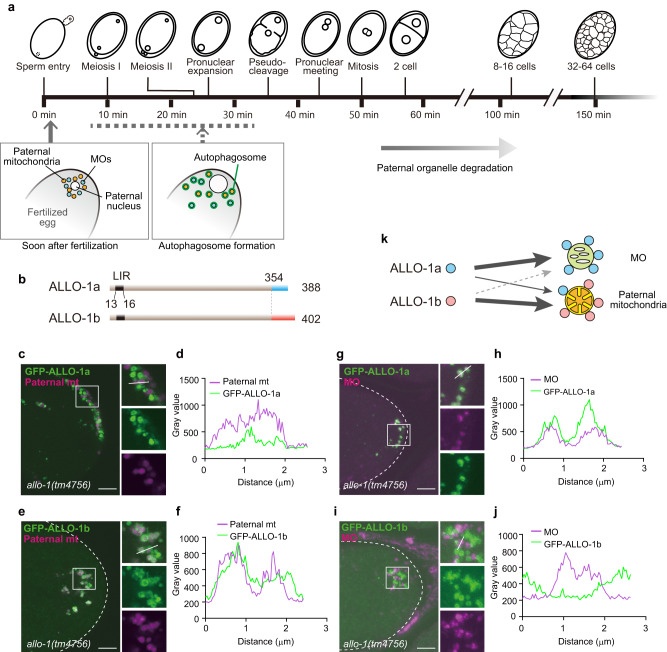
Allophagy is responsible for the selective removal of paternally inherited organelles, including mitochondria, in Caenorhabditis elegans embryos, thereby facilitating the maternal inheritance of mitochondrial DNA. We previously identified two key factors in allophagy: an autophagy adaptor allophagy-1 (ALLO-1) and TBK1/IKKε family kinase IKKE-1. However, the precise mechanisms by which ALLO-1 and IKKE-1 regulate local autophagosome formation remain unclear. In this study, we identify two ALLO-1 isoforms with different substrate preferences during allophagy. Live imaging reveals a stepwise mechanism of ALLO-1 localization with rapid cargo recognition, followed by ALLO-1 accumulation around the cargo. In the ikke-1 mutant, the accumulation of ALLO-1, and not the recognition of cargo, is impaired, resulting in the failure of isolation membrane formation. Our results also suggest a feedback mechanism for ALLO-1 accumulation via EPG-7/ATG-11, a worm homolog of FIP200, which is a candidate for IKKE-1-dependent phosphorylation. This feedback mechanism may underlie the ALLO-1-dependent initiation and progression of autophagosome formation around paternal organelles.


Conflict of interest statement

The authors declare no competing interests.

Figures

Fig. 1
Fig. 1. Localization of allophagy-1 (ALLO-1) isoforms during allophagy.
a Time course of allophagy and embryogenesis previously reported. The general time course of early embryogenesis at 20 °C is shown in the frame. The exact time of autophagosome formation was not clear (dotted line). b Structure of ALLO-1a (top) compared with that of ALLO-1b (bottom). The color of areas with different sequences is indicated by cyan or orange bars. The positions of LC3-interacting region motifs (LIRs) are shown (dark gray bars). cf Localization of ALLO-1 isoforms around paternal mitochondria in the allo-1 mutant background. Fertilized eggs at 1-cell stage (hereafter referred to as zygotes) dissected from adult hermaphrodites expressing green fluorescent protein (GFP)-ALLO-1a or b (green) under the oocyte-specific pie-1 promoter and HSP-6-mCherry under the sperm-specific spe-11 promoter (paternal mitochondria (mt); magenta). Plot profiles of white lines in the upper right panels of c and e are shown in d and f, respectively. gj Localization of ALLO-1 isoforms around the membranous organelles (MOs) in the allo-1 mutant background. Zygotes dissected from adult hermaphrodites expressing GFP-ALLO-1a or b (green) were stained with a monoclonal antibody, 1CB4, which recognizes MOs (magenta). Plot profiles of white lines in the upper right panels of g and i are shown in h and j, respectively. In total, 67 (c, d), 69 (e, f), 37 (g, h), and 32 (i, j) zygotes were observed, with similar patterns observed in all zygotes. All zygotes were observed between meiosis II and pseudo-cleavage stage. Outline of the zygote is indicated by dotted white line. Scale bars, 5 μm. k Schematic representation of localization pattern of ALLO-1 isoforms.
Fig. 2
Fig. 2. Distinct cargo preference of ALLO-1 isoforms during allophagy.
a, c Rescue experiment of the degradation of paternal mitochondria (mt) (a) or membranous organelles (MOs) (c). 32–64-cell stage embryos from the wild type (WT), the allo-1 mutant without a transgene or the allo-1 mutant expressing GFP-ALLO-1a or b were observed for paternal mitochondria (HSP-6-mCherry) and MOs (immunostaining with the antibody 1CB4). b Paternal mitochondria (HSP-6-mCherry) remaining in the 32–64-cell stage embryos were quantified as the area showing a fluorescent signal per embryo. n = 13 (no transgene), n = 17 (GFP-ALLO-1a), n = 16 (GFP-ALLO-1b), n = 12 (GFP-ALLO-1a+b), and n = 14 (WT) embryos. d MOs remaining in the 32–64-cell stage embryos were quantified as the area showing a fluorescent signal per embryo. n = 16 (no transgene), n = 23 (GFP-ALLO-1a), n = 30 (GFP-ALLO-1b), n = 18 (GFP-ALLO-1a+b), and n = 23 (WT) embryos. Error bars represent the mean ± standard deviation (SD). Source data are provided as a Source Data file. Kruskal–Wallis with Steel-Dwass pairwise comparison test was performed for p values. p values are provided in the figures and source data file. To define the embryonic stage, differential interference contrast (DIC) images are also shown in a and c. Eggshells are indicated by dotted white lines. Scale bars, 5 μm.
Fig. 3
Fig. 3. Time-lapse imaging of allophagy factors.
ae Time-lapse images of GFP-LGG-1 (a), GFP-ALLO-1a (b), GFP-ALLO-1b (c), GFP-IKKE-1 (d), and EPG-7-GFP (e) (green) along with HSP-6-mCherry (paternal mitochondria (mt); magenta) in zygotes. GFP-ALLO-1a or b was observed in the allo-1 mutant background. The timing of sperm–oocyte contact was set to 0 s. Paternal mitochondria are surrounded by dotted white lines. Arrows indicate GFP localized to the paternal mitochondria. The maximum intensity projection images are shown. In b, the structures outside the paternal mitochondria, which were estimated as membranous organelles (MOs), are indicated by arrowheads. Asterisks indicate gut granules on the outside of the egg. Scale bars, 2 μm. See Supplementary Movie 1.
Fig. 4
Fig. 4. IKKE-1 is essential for ALLO-1b accumulation.
a, b Accumulation of GFP-ALLO-1b was impaired in ikke-1 deletion or kinase-dead (K49M) mutants. Zygotes (pseudo-cleavage stage) dissected from adult hermaphrodites expressing GFP-ALLO-1b (green) and HSP-6-mCherry (paternal mitochondria (mt); magenta) in the wild type (WT) or ikke-1 mutant background were observed (a). Intensity of GFP-ALLO-1b was quantified and normalized using fluorescent HSP-6-mCherry (paternal mitochondria) to correct for GFP attenuation because of the distance from the objective (b). n = 150 (wild type, WT), n = 151 (ikke-1(gk1264)), and n = 96 (ikke-1K49M(syb2844)) paternal mitochondria or their clusters from 10 zygotes (pseudo-cleavage stage) for each strain were analyzed in b. Error bars represent the mean ± standard deviation (SD). Source data are provided as a Source Data file. Kruskal–Wallis with Steel-Dwass pairwise comparison test was performed for p values, which are provided in the figures and source data file. Scale bar, 5 μm. c Time-lapse images of GFP-ALLO-1b in the wild type and ikke-1 deletion mutant zygotes. The timing of sperm–oocyte contact was set to 0 s. Scale bar, 2 μm. See Supplementary Movie 2. d Schematic representation of the relationship between IKKE-1 and ALLO-1b.
Fig. 5
Fig. 5. IKKE-1 kinase activity is essential for autophagosome formation and EPG-7 accumulation around paternal mitochondria.
a EPG-7-GFP (green) and HSP-6-mCherry (paternal mitochondria (mt); magenta) were observed in the wild-type (WT) or ikke-1 mutant zygotes (meiosis II stage). Scale bar, 5 μm. b Intensity of EPG-7-GFP was quantified and normalized using fluorescent HSP-6-mCherry. n = 177 (WT), n = 181 (ikke-1(gk1264)), n = 137 (ikke-1K49M(syb2844)), and n = 198 (allo-1(tm4756)) paternal mitochondria or their clusters from 10 zygotes (meiosis II) for each genotype. c GFP-LGG-1 (green) and HSP-6-mCherry (magenta) were observed in the pseudo-cleavage stage zygotes in the WT, ikke-1 or allo-1 mutant background. Scale bar, 5 μm. d The shape of GFP-LGG-1 surrounding paternal mitochondrion was observed in the zygotes (between the pronuclear expansion to the pseudo-cleavage stage) and classified into three types: not at all surrounded (gray), partially surrounded (purple), and almost completely surrounded (green). Representative images (single plane) of each shape are shown in the upper panel (scale bar, 500 nm). n = 216 (WT), n = 179 (ikke-1(gk1264)), n = 164 (ikke-1K49M(syb2844)), n = 188 (ikke-1(tm4102)), and n = 203 (allo-1(tm4756)) paternal mitochondria from 15 zygotes for each genotype. e Normalized intensity of GFP-LGG-1 around paternal mitochondria. n = 71 (WT), n = 58 (ikke-1(gk1264)), n = 63 (ikke-1K49M(syb2844)), and n = 90 (allo-1(tm4756)) paternal mitochondria or their clusters from 10, 10, 10, or 11 zygotes (between the pronuclear expansion to the pseudo-cleavage stage), respectively. Scale bars, 5 μm. f Super-resolution images of GFP-LGG-1 (green) and paternal mitochondria (magenta) in the WT or ikke-1(gk1264) zygotes at the pronuclear expansion stage. The fluorescent images (z-projection) and differential interference contrast (DIC) images (single plane) are shown. Scale bars, 5 μm for confocal images and 1 μm for super-resolution images. See Supplementary Movie 3. White dotted lines indicate outline of the zygotes. Error bars represent the mean ± standard deviation (SD). Source data are provided as a Source Data file. Kruskal–Wallis with Steel-Dwass pairwise comparison test was performed for p values, which are provided in the figures and source data file.
Fig. 6
Fig. 6. IKKE-1 is essential for autophagosome formation and ALLO-1a accumulation around membranous organelles (MOs).
a IKKE-1 is necessary for ALLO-1a accumulation around MOs. Pseudo-cleavage stage zygotes were dissected from adult hermaphrodites expressing GFP-ALLO-1a in the allo-1 mutant background and stained with an anti-MO antibody (1CB4) and 4′,6-diamidino-2-phenylindole (DAPI). b Intensity of GFP-ALLO-1a was quantified and normalized based on the fluorescence of MOs. n = 274 (wild type, WT) and n = 190 (ikke-1(gk1264)) MOs or their clusters were analyzed from 10 zygotes (between the pronuclear expansion to the pseudo-cleavage stage) for each genotype. c IKKE-1 and ALLO-1 are necessary for precise autophagosome formation around paternal mitochondria. Zygotes expressing GFP-LGG-1 were dissected from wild type, allo-1(tm4756), ikke-1(gk1264), and ikke-1K49M(syb2844) and stained with an 1CB4 antibody and DAPI between the pronuclear expansion to the pseudo-cleavage stage. d IKKE-1 kinase activity is necessary for autophagosome formation around paternal mitochondria. Zygotes expressing GFP-LGG-1 were stained with an anti-MO antibody. The shape of GFP-LGG-1 surrounding MOs was observed and classified into three types: not at all surrounded (gray), partially surrounded (purple), and almost completely surrounded (green). n = 154 MOs from 10 zygotes (WT), n = 147 (ikke-1(gk1264)) MOs from 10 zygotes, and n = 92 (ikke-1K49M(syb2844)) MOs from 11 zygotes between the pronuclear expansion to the pseudo-cleavage stage. Representative images (single plane) of each shape are shown in the upper panel (scale bar, 500 nm). e Normalized intensity of GFP-LGG-1 around MOs. n = 119 (WT), n = 77 (ikke-1(gk1264)), and n = 102 (ikke-1K49M(syb2844)) MOs or their clusters from 13, 11, or 11 zygotes (between the pronuclear expansion to the pseudo-cleavage stage), respectively, were analyzed. p values were calculated using the two-tailed Mann–Whitney U test (b) or Kruskal–Wallis with Steel-Dwass pairwise comparison test (e). Error bars represent the mean ± standard deviation (SD). Source data are provided as a Source Data file. White dotted lines indicate outline of the zygotes. Scale bars, 5 μm.
Fig. 7
Fig. 7. ALLO-1 directly binds to EPG-7 via the FIP200-interacting region (FIR) motif.
a EPG-7 interacted with the ALLO-1 N-terminal region in yeast two-hybrid analysis. EPG-7 C-terminal region (1227–1338) corresponds to the Claw domain (see Supplementary Fig. 7a). b Sequence alignment analysis of the FIR or LIR motif of p62, NBR1, FAM134B, OPTN, and CCPG1 from human species and Saccharomyces cerevisiae ATG19. Highly conserved residues are marked with asterisks. c Interaction between EPG-7 and ALLO-1 depended on the FIR motif of ALLO-1 in yeast two-hybrid analysis. d FIR motif of ALLO-1 is not required for the interaction with LGG-1 according to yeast two-hybrid analysis. e In vitro binding assay confirmed the interaction between EPG-7 and ALLO-1 via the FIR motif. Unprocessed immunoblots are shown in Supplementary Fig. 7e. All experiments were independently repeated twice (a, c, d) or three times (e) with similar results.
Fig. 8
Fig. 8. EPG-7 is involved in ALLO-1b accumulation.
a, b EPG-7 is necessary for the accumulation of ALLO-1b around paternal mitochondria (mt). GFP-ALLO-1b (green) and HSP-6-mCherry (paternal mt; magenta) were observed in the wild-type (WT) or epg-7 mutant zygotes. In b, the intensity of GFP-ALLO-1b was quantified and normalized based on the fluorescence of paternal mitochondria. n = 154 (wild type, WT) and n = 108 (epg-7(tm2508)) paternal mitochondria or their clusters from 9 or 10 zygotes, respectively, were analyzed. All zygotes were imaged between the pronuclear expansion to the pseudo-cleavage stage. ce Accumulation of ALLO-1b depends on the FIP200-interacting region (FIR) motif. GFP-ALLO-1b WT or GFP-ALLO-1b D11AE12A (FIR mut) (green) and HSP-6-mCherry (paternal mt; magenta) were observed in zygotes. In d, the intensity of GFP co-localized with paternal mitochondria was quantified. n = 207 (GFP-ALLO-1b WT) and n = 140 (GFP-ALLO-1b FIR mut) paternal mitochondria or their clusters from 10 zygotes for each genotype were analyzed. In e, the intensity of cytoplasmic GFP was quantified outside the vicinity of the paternal organelles to compare GFP expression levels between transgenes (n = 12 or 18 zygotes for WT or FIRmut, respectively). All zygotes were imaged between the pronuclear expansion to the pseudo-cleavage stage. Volcano plot of tandem mass tag (TMT)-based quantitative phosphoproteomics identifying the decrease in phosphorylation of EPG-7 S949 in ikke-1 (f) and allo-1 (g) mutants. Red arrows indicate phosphorylated S949-containing peptides of EPG-7. Magenta dots in f indicate the peptides of ALLO-1 (see Supplementary Table 2). The x-axis shows the ratio of wild type to the mutants in the amount of detected peptides. p values in the volcano plots were calculated by the two-tailed Student’s t-test. h Model of ALLO-1 accumulation via a positive feedback loop by IKKE-1. P, phosphorylation. Scale bars, 5 μm. p values were calculated using the two-tailed Mann–Whitney U test (b, d, e). Error bars represent the mean ± standard deviation (SD). Source data are provided as a Source Data file.

References

    1. Mounolou JC, Jakob H, Slonimski PP. Mitochondrial DNA from yeast “petite” mutants: specific changes in buoyant density corresponding to different cytoplasmic mutations. Biochem. Biophys. Res. Commun. 1966;24:218–224. doi: 10.1016/0006-291X(66)90723-6. - DOI - PubMed
    1. Reich E, Luck DJ. Replication and inheritance of mitochondrial DNA. Proc. Natl Acad. Sci. USA. 1966;55:1600–1608. doi: 10.1073/pnas.55.6.1600. - DOI - PMC - PubMed
    1. Borst P. Mitochondrial nucleic acids. Annu. Rev. Biochem. 1972;41:333–376. doi: 10.1146/annurev.bi.41.070172.002001. - DOI - PubMed
    1. Hutchison CA, 3rd, Newbold JE, Potter SS, Edgell MH. Maternal inheritance of mammalian mitochondrial DNA. Nature. 1974;251:536–538. doi: 10.1038/251536a0. - DOI - PubMed
    1. Sato K, Sato M. Multiple ways to prevent transmission of paternal mitochondrial DNA for maternal inheritance in animals. J. Biochem. 2017;162:247–253. - PubMed

MeSH terms

Substances