. 2024 Feb 17;7(1):200.
doi: 10.1038/s42003-024-05877-4.

Common mitochondrial deletions in RNA-Seq: evaluation of bulk, single-cell, and spatial transcriptomic datasets

Affiliations

Common mitochondrial deletions in RNA-Seq: evaluation of bulk, single-cell, and spatial transcriptomic datasets

Audrey A Omidsalar et al. Commun Biol. .

Abstract

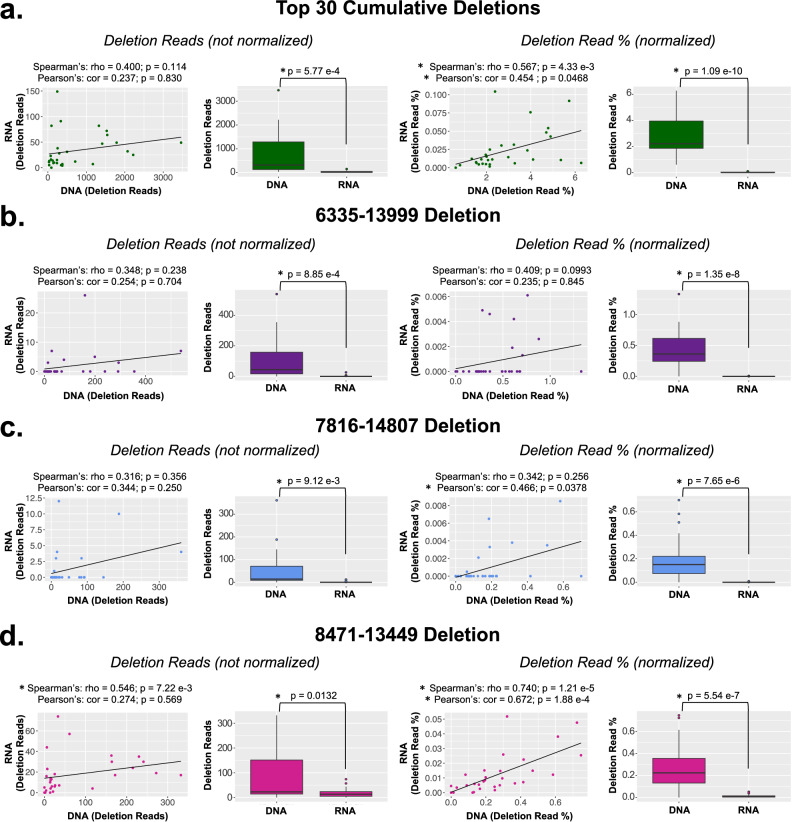
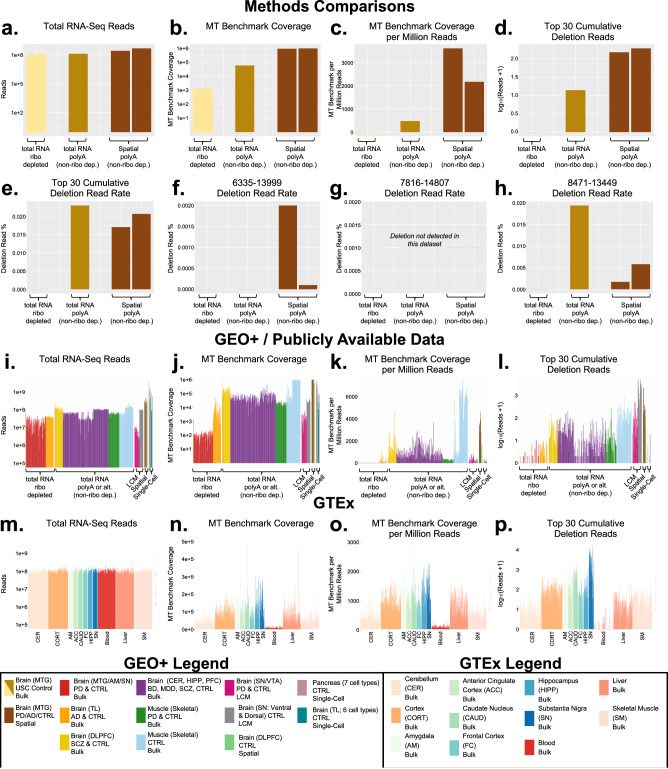
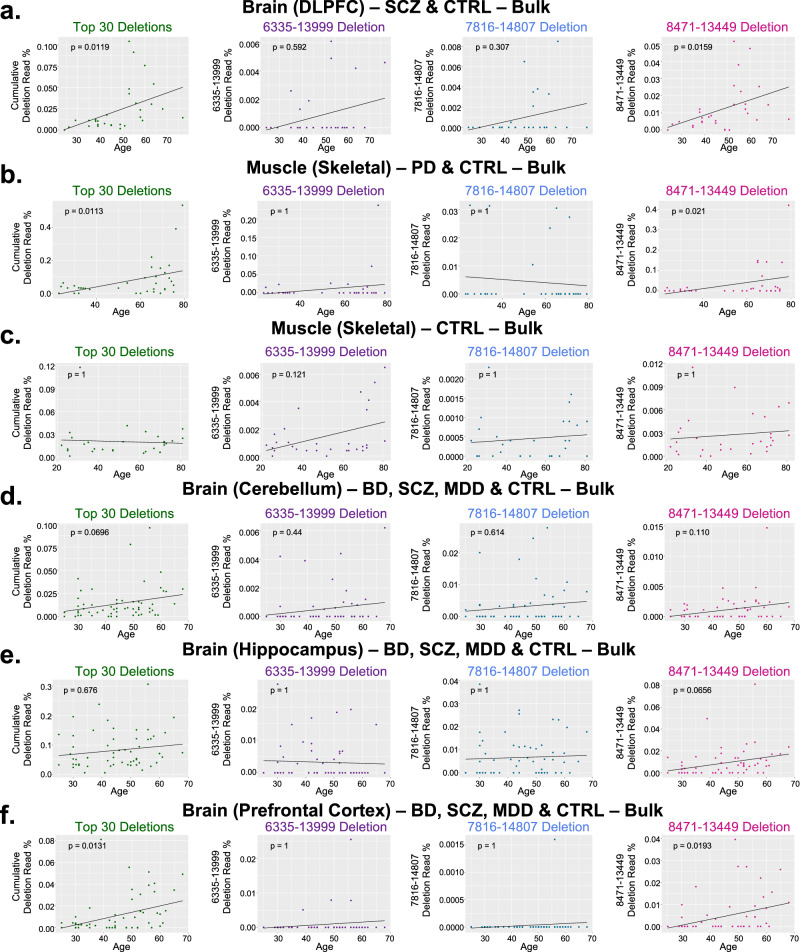
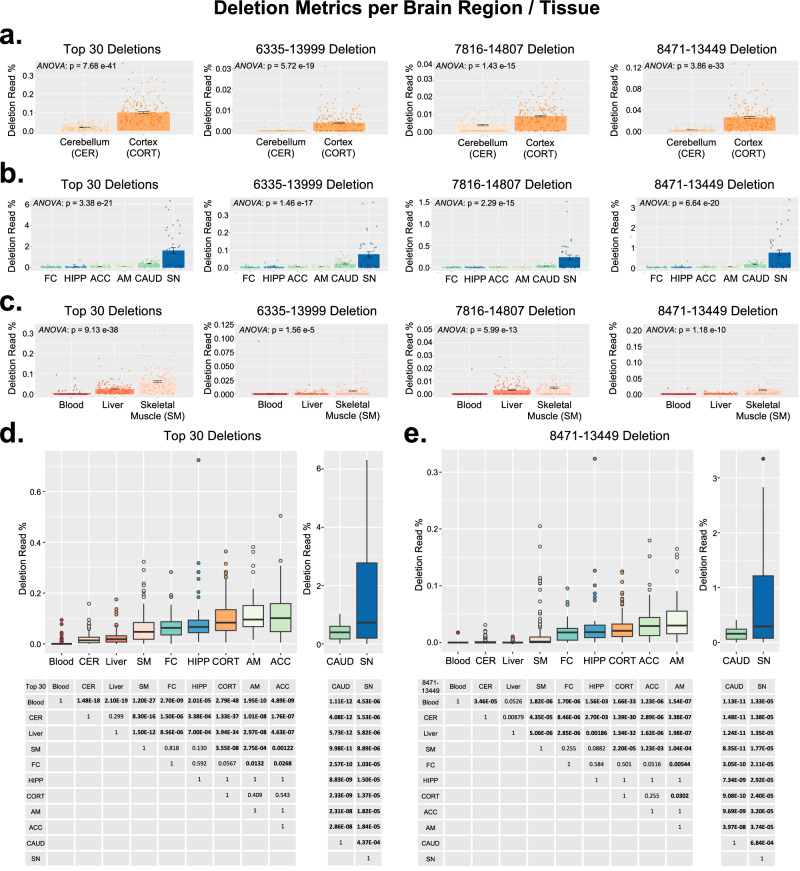
Common mitochondrial DNA (mtDNA) deletions are large structural variants in the mitochondrial genome that accumulate in metabolically active tissues with age and have been investigated in various diseases. We applied the Splice-Break2 pipeline (designed for high-throughput quantification of mtDNA deletions) to human RNA-Seq datasets and describe the methodological considerations for evaluating common deletions in bulk, single-cell, and spatial transcriptomics datasets. A robust evaluation of 1570 samples from 14 RNA-Seq studies showed: (i) the abundance of some common deletions detected in PCR-amplified mtDNA correlates with levels observed in RNA-Seq data; (ii) RNA-Seq library preparation method has a strong effect on deletion detection; (iii) deletions had a significant, positive correlation with age in brain and muscle; (iv) deletions were enriched in cortical grey matter, specifically in layers 3 and 5; and (v) brain regions with dopaminergic neurons (i.e., substantia nigra, ventral tegmental area, and caudate nucleus) had remarkable enrichment of common mtDNA deletions.


Conflict of interest statement

The authors declare no competing interests.

Figures

Fig. 1
Fig. 1. Correlations and comparisons of mtDNA deletions captured by DNA vs RNA-Seq.
RNA-Seq data from 30 brain samples was processed through the Splice-Break2 pipeline and compared to results using the traditional mtDNA-enrichment and DNA sequencing approach,. All analyses included correlations and relative abundance of deletion reads detected in each sample (not normalized) and the deletion read rate for each sample (normalized). a The sum of the Top 30 deletions. The three most common deletions: (b) 6335–13999, (c) 7816–14807, and (d) 8471–13449. Spearman and Pearson’s correlations are shown. Statistical values for box plots are from Welch’s t-tests. All p-values were corrected for multiple tests using Bonferroni. All boxplots show the median as a solid black line; the first and third quartiles are captured by the bounds of the box. Boxplot whiskers are defined as the first and third quartiles ± interquartile range times 1.5, respectively, and outliers are denoted as points.
Fig. 2
Fig. 2. MtDNA deletions captured by RNA-Seq.
a The Top 30 most frequent mtDNA deletions evaluated in this study and previously described. Multiple sequence alignment (MSA) plot of RNA-Seq reads from a dataset of 30 brain samples containing the (b) 6335–13999 deletion, (c) 7816–14807 deletion, and (d) 8471–13449 deletion.
Fig. 3
Fig. 3. Sequencing metrics of 14 RNA-Seq datasets evaluated for mtDNA deletions.
ah USC control sample sequenced by three library preparation methods: bulk RNA-Seq with ribosomal depletion, bulk RNA-Seq without ribosomal depletion (polyA), and spatial transcriptomics (10x Visium platform). il All GEO+ samples (n = 463); (m–p) all GTEx samples (n = 1107). Definitions: Total RNA-Seq Reads = FASTQ reads prior to alignment; MT Benchmark Coverage = average mitochondrial sequencing depth measured from two 250 bp segments within the RNR1 and CYB genes; Deletion Read Rate = deletion reads/MT Benchmark Coverage. MTG (middle temporal gyrus); AM (amygdala); SN (substantia nigra); TL (temporal lobe); DLPFC (dorsolateral prefrontal cortex); CER (cerebellum); HIPP (hippocampus); PFC (prefrontal cortex); VTA (ventral tegmental area); LCM (laser capture microdissection); PD (Parkinson’s Disease); CTRL (control); AD (Alzheimer’s Disease); SCZ (schizophrenia); BD (bipolar disorder); MDD (major depressive disorder). Abbreviations for GTEx tissues are shown on figure.
Fig. 4
Fig. 4. Analyses of age in GEO+ samples.
Correlations between the Top 30 cumulative deletion, 6335–13999, 7816–14807, and 8471–13449 deletion read rates with age in brain, and skeletal muscle,. a DLPFC samples (n = 30); (b) skeletal muscle samples (n = 36); (c) skeletal muscle samples (n = 30). df Stanley Neuropathology Consortium data. d cerebellum samples (n = 58); (e) hippocampus samples (n = 58); f prefrontal cortex samples (n = 58). P-values shown from linear regression models for Deletion ~ Age, and include MT benchmark coverage and sex as co-variates. P-values in (b) also included diagnosis as a co-variate. All p-values were corrected for multiple tests using Bonferroni.
Fig. 5
Fig. 5. Analyses of age in GTEx samples.
Correlations between the Top 30 cumulative deletion and 8471–13449 deletion read rates with age in 11 GTEx tissues. a The cumulative deletion read rate of the “Top 30” mtDNA deletions and (b) the 8471–13449 deletion. Tissues are from three paired datasets: 183 paired samples of cerebellum and cortex, 41 paired samples from multiple brain regions (i.e., amygdala, anterior cingulate cortex, caudate nucleus, frontal cortex, hippocampus, and substantia nigra), and 165 paired samples from non-brain regions (i.e., blood, liver, and skeletal muscle). P-values shown from linear regression models for Deletion ~ Age, and include MT benchmark coverage and sex as co-variates. All p-values were corrected for multiple tests using Bonferroni.
Fig. 6
Fig. 6. Analyses of brain region and diagnosis in GEO+ samples.
ad Comparisons between brain regions for the “Top 30” cumulative deletions, 6335–13999, 7816–14807, and 8471–13449 deletion in four studies,,,. el Comparisons of diagnosis in brain and muscle in six studies–,. Bar graphs represent mean ± SEM. Sample size per tissue/diagnosis: (a) MTG (n = 23), AM (n = 23), and SN (n = 29); (b) SN (n = 10), VTA (n = 9); (c) dorsal SN (n = 7), ventral SN (n = 7); (d) CER (n = 58), HIPP (n = 58), PFC (n = 58); (e) PD+Dementia (n = 17), CTRL (n = 12); (f) PD (n = 5), CTRL (n = 5); (g) Basal YA (n = 12), Basal OA (n = 12), Basal PD (n = 12), Post Training PD (n = 5); (h) young CTRL (n = 8), old CTRL (n = 10), AD (n = 12); (i) SCZ (n = 15), CTRL (n = 15); (j) CTRL (n = 15), BD (n = 14), MDD (n = 15), SCZ (n = 14); (k) CTRL (n = 14), BD (n = 15), MDD (n = 14), SCZ (n = 15); (l) CTRL (n = 15), BD (n = 14), MDD (n = 15), SZ (n = 14)). Statistical values for brain region tests are from Welch’s t-tests. P-values shown from linear regression models for Deletion ~ Diagnosis, and include MT benchmark coverage, age and sex as co-variates. All p-values were corrected for multiple tests using Bonferroni. MTG (middle temporal gyrus); AM (amygdala); SN (substantia nigra); VTA (ventral tegmental area); CER (cerebellum); HIPP (hippocampus); PFC (prefrontal cortex); TL (temporal lobe); DLPFC (dorsolateral prefrontal cortex); LCM (laser capture microdissection); YA (young adult); OA (older adult); PD (Parkinson’s Disease); CTRL (control); AD (Alzheimer’s Disease); SCZ (schizophrenia); BD (bipolar disorder); MDD (major depressive disorder). Symbols: (^p < 0.05); (*p < 0.01); (**p < 0.001); (***p < 0.0001).
Fig. 7
Fig. 7. Analysis of brain region and tissue in GTEx samples.
ac Comparisons between brain regions and tissues for the “Top 30” cumulative deletions, 6335–13999, 7816–14807, and 8471–13449 deletion in paired GTEx datasets. Bar graphs represent mean ± SEM. d, e Comparisons across all 11 GTEx tissues. Sample size per tissue: (a) paired samples from cerebellum and cortex (n = 183 ea.); (b) paired samples from amygdala, anterior cingulate cortex, caudate nucleus, frontal cortex, hippocampus, and substantia nigra (n = 41 ea.); (c) paired samples from blood, liver, and skeletal muscle (n = 165 ea.). d the “Top 30” cumulative deletions for all GTEx tissues and matrix of p-values for individual comparisons. e The 8471–13449 deletion for all GTEx tissues and matrix of p-values for individual comparisons. Statistical values for paired tests (ac) are from repeated measures ANOVA. Statistical values for individual tissue comparisons (d, e) are from Welch’s t-tests. All p-values were corrected for multiple tests using Bonferroni. All boxplots show the median as a solid black line; the first and third quartiles are captured by the bounds of the box. Boxplot whiskers are defined as the first and third quartiles ± interquartile range times 1.5, respectively, and outliers are denoted as points. CER (cerebellum); CORT (cortex); FC (frontal cortex); HIPP (hippocampus); ACC (anterior cingulate cortex); AM (amygdala); CAUD (caudate nucleus); SN (substantia nigra); SM (skeletal muscle).
Fig. 8
Fig. 8. Mitochondrial deletions in spatial transcriptomics and cortical layers.
a Heatmap showing proportion of spots corresponding to ground truth designations of four replicate SpatialLIBD samples (151673–151676) vs. Seurat clusters after integrated clustering of 12x sections (i.e., 4x SpatialLIBD DLPFC + 8x USC MTG). Clusters selected are outlined in white and imputed layers are labeled. b Spatial image of one SpatialLIBD sample (151673) colored by imputed cortical layers from (a). c Annotated H&E images and matching spatial images with imputed cortical from USC MTG dataset. Percentage of spots (mean ± SEM) for each imputed layer that contained (d) the 6335–13999 deletion or (e) the 8471–13449 deletion. d, e Percentages shown are from all 12x sections (4x SpatialLIBD DLPFC + 8x USC MTG). Letters above bar graphs describe significant differences between cortical layers from two-proportion Z-tests. Layers represented by different letters: p < 0.05. L1 (Layer 1); L2 & L3 (Layers 2 + 3); L3 (Layer 3); L5 (Layer 5); L6 (Layer 6); WM (White Matter).

References

    1. Holt IJ, Harding AE, Morgan-Hughes JA. Deletions of muscle mitochondrial DNA in patients with mitochondrial myopathies. Nature. 1988;331:717–719. doi: 10.1038/331717a0. - DOI - PubMed
    1. Wallace DC, et al. Mitochondrial DNA mutation associated with Leber’s hereditary optic neuropathy. Science. 1988;242:1427–1430. doi: 10.1126/science.3201231. - DOI - PubMed
    1. Wallace DC, et al. Mitochondrial DNA mutations in human degenerative diseases and aging. Biochim. Biophys. Acta. 1995;1271:141–151. doi: 10.1016/0925-4439(95)00021-U. - DOI - PubMed
    1. Wallace DC. Mitochondrial DNA in aging and disease. Sci. Am. 1997;277:40–47. doi: 10.1038/scientificamerican0897-40. - DOI - PubMed
    1. Wallace DC. Mitochondrial DNA mutations in disease and aging. Environ. Mol. Mutagen. 2010;51:440–450. doi: 10.1002/em.20586. - DOI - PubMed

Publication types

Substances