. 2024 Feb 19;12(1):29.
doi: 10.1186/s40168-024-01752-w.

Effect of a multi-strain probiotic mixture consumption on anxiety and depression symptoms induced in adult mice by postnatal maternal separation

Affiliations

Effect of a multi-strain probiotic mixture consumption on anxiety and depression symptoms induced in adult mice by postnatal maternal separation

Francesca De Santa et al. Microbiome. .

Abstract

Background: Intestinal microbial composition not only affects the health of the gut but also influences centrally mediated systems involved in mood, through the "gut-brain" axis, a bidirectional communication between gut microbiota and the brain. In this context, the modulation of intestinal microbiota and its metabolites through the administration of probiotics seems to represent a very promising approach in the treatment of the central nervous system alterations. Early postnatal life is a critical period during which the brain undergoes profound and essential modulations in terms of maturation and plasticity. Maternal separation (MS), i.e., the disruption of the mother-pup interaction, represents a pivotal paradigm in the study of stress-related mood disorders, by inducing persistent changes in the immune system, inflammatory processes, and emotional behavior in adult mammals.

Results: We conducted experiments to investigate whether sustained consumption of a multi-strain probiotic formulation by adult male mice could mitigate the effects of maternal separation. Our data demonstrated that the treatment with probiotics was able to totally reverse the anxiety- and depressive-like behavior; normalize the neuro-inflammatory state, by restoring the resting state of microglia; and finally induce a proneurogenic effect. Mice subjected to maternal separation showed changes in microbiota composition compared to the control group that resulted in permissive colonization by the administered multi-strain probiotic product. As a consequence, the probiotic treatment also significantly affected the production of SCFA and in particular the level of butyrate.

Conclusion: Gut microbiota and its metabolites mediate the therapeutic action of the probiotic mix on MS-induced brain dysfunctions. Our findings extend the knowledge on the use of probiotics as a therapeutic tool in the presence of alterations of the emotional sphere that significantly impact on gut microbiota composition. Video Abstract.

Keywords: Adult neurogenesis; Anxiety and depression; Gut-brain axis; Inflammation; Microbiota; Probiotic; Short-chain fatty acids.


Conflict of interest statement

The authors declare that they have no known competing financial interests or personal relationships that could have appeared to influence the work reported in this paper. Prof. Diego Mora sits on the Scientific Advisory Board of Actial Farmaceutica Srl, and has provided, as a part of his Institutional Activity, technical reports for this company and Beingpharma Srl.

Figures

Fig. 1
Fig. 1
Schematic timeline of experimental procedure and OttaBac® effect on anxiety depressive-like behaviors. a Between postnatal day (PD) 2 and PD 14, mice were separated from their mothers for 3 h per day (MS mice). Members of the control group were left undisturbed with their mother (nMS mice). From PD 63 until PD 78, MS and nMS mice were treated with 15-daily administration of OttaBac® or placebo. At the end of treatment, mice were subjected to behavioral tests and then sacrificed for tissue and blood collection. be Graphs showing the increase in time spent in the periphery and the reduction of time spent in the center of the arena, in the MSPLA group compared to the nMSPLA control. c OB treatment increases peripheral crossings, in the nMSOB and MSOB groups, compared to the nMSPLA and MSPLA groups. e Graph indicating the tendency of MSPLA mice towards a decrease of crossing in the center of the arena. Number of animals/group = 8. f Graph indicating that the four groups of mice spend a similar interval of time in the closed arm of elevated plus maze. g Histogram showing the decreased percentage of time spent in the open arm in the MSPLA group compared to their nMSPLA counterpart in the EPM; treatment with OB increases the time spent in the open arms in the MSOB group at physiological level. Number of animals/group = 8. h Histogram indicating the percentage of floating that increases in the MSPLA group compared to their nMSPLA counterpart; treatment with OB significantly decreases the percentage of floating in the MSOB group compared to MSPLA. Number of animals/group = 8. Statistical significance: *p < 0.05. Two-way ANOVA analysis, followed by Bonferroni post hoc tests
Fig. 2
Fig. 2
Effect of OttaBac® on neuronal activation and glucocorticoid receptors of the prefrontal cortex. a Histogram showing the decrease of c-fos+ cells number in the MSPLA group, when compared to their nMSPLA counterpart, and the increase of c-fos+ cells number in the OB-treated group MSOB when compared to their respective MSPLA counterpart, in the prefrontal cortex. b Representative images showing the distribution of c-fos+ cells (in red) in the prefrontal cortex of mice, in the four experimental groups. c Histogram indicating the comparable total number of GR+ cells in the prefrontal cortex among the groups. Number of animals/group = 5. d and e GR and GAPDH expression and results from densitometric analyses of the bands show a significant increase in the amount of receptor in the MSOB group compared to the nMSPLA, MSPLA, and nMSOB groups, in the prefrontal cortex. Number of animals = 4 (MSPLA, nMSOB, MSOB), 3 nMSPLA statistical significance: *p < 0.05, **p < 0.01, and ***p < 0.001. Two-way ANOVA analysis, by Bonferroni post hoc tests. Scale bar: 100 μm. GR, glucocorticoid receptor
Fig. 3
Fig. 3
Effect of OttaBac® on microglia resident in the prefrontal cortex. a Histogram showing the enhanced microglial density in the prefrontal cortex of MSPLA and MSOB group, when compared to their nMSPLA and MSOB counterparts. b Graph illustrating the increased area soma of the MSPLA mice compared to the nMSPLA group and the reversed phenotype after treatment with OB. ci Diagrams showing modification of the microglia morphology towards an activated phenotype (priming) in the MSPLA group and the therapeutic effect exerted by OB on the MSOB group in term of the following parameters extrapolated from Sholl analysis: ending radius (c), intersecting radii (d), and sum and max intersection (e, f). f and g show a main effect of MS in decreasing mean intersection (effect of MS: F(1, 16) = 15.31, p = 0.0013, g) and max intersection radius (effect of MS: F(1, 16) = 6.01, p = 0.026, h). i Histogram showing that the ramification index is similar among the 4 groups analyzed. Number of animals/group = 5. j Representative images displaying the morphological changes (retraction of the processes and enlargement of area soma) observed in prefrontal cortex microglia of the MSPLA mice groups, as compared to the nMSPLA, nMSOB, and MSOB groups. kl Graphs showing a reduction in the expression of microglial homeostatic genes Olfml3 (k) and Tmem119 (l) in the MSPLA group, compared to the nMSPLA control group. Downregulation is not observed in the MSOB group. Number of animals = 5 (nMSPLA, nMSOB, MSOB) and 4 MSPLA. Statistical significance: *p < 0.05, **p < 0.01, and ***p < 0.001. Two-way ANOVA analysis, by Bonferroni post hoc tests. Scale bar: 30 μm
Fig. 4
Fig. 4
Effect of OttaBac® on microglia and adult neurogenesis in the dentate gyrus (DG) of hippocampus. a Histogram indicating the comparable total number of IBA-1+ cells in the dentate gyrus of hippocampus, among the groups. b Histogram illustrating the increased area soma of the MSPLA compared to the nMSPLA mice and the beneficial effect of OB. cf Diagrams showing the modification of the microglia morphology towards an activated phenotype (priming) in the MSPLA group and the therapeutic effect exerted by OB on the MSOB group in terms of the following: ending radius (c), intersecting radii (d), sum and max intersection (e, f). g Histogram showing the decrease of nestin-GFP+ neural stem cells observed in the MSPLA group, when compared to their respective nMSPLA counterpart group, and the OB-dependent increase of NSCs in the MSOB group compared to MSPLA group. h Histogram showing the decrease of DCX+ immature neuronal cells (neuroblasts) observed in the MSPLA group, when compared to their respective nMSPLA counterpart group, and the OB-dependent increase of DCX+ immature neuronal cells in the MSOB group compared to MSPLA group. i Representative pictures describing the decrease of nestin-GFP+ neural stem cells (green) observed in the MSPLA group and the OB-dependent increase of NSCs in the MSOB. j Representative pictures describing the decrease of DCX+ neuroblasts (red) and the OB-dependent increase of DCX+ immature neuronal cells in the MSOB group. k Histogram showing the OB-dependent enhanced number of KI67+ cells detected in the nMSOB and MSOB groups, in comparison to their respective counterpart nMSPLA and MSPLA groups. l and m Graphs showing the OB-dependent increased proliferation of GFP+ neural stem cells observed in nMSOB and MSOB group, in comparison to their counterpart nMSPLA and MSPLA groups, respectively, and the enhanced number of proliferative DCX+ immature neuronal cells in the nMSOB and MSOB groups, in comparison to their counterpart nMSPLA and MSPLA groups, respectively. Number of animals/group = 5. Statistical significance: *p < 0.05, **p < 0.01. Two-way ANOVA analysis by Bonferroni post hoc tests. Scale bar: 100 μm
Fig. 5
Fig. 5
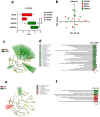
Effect of OttaBac® on α and β diversity and species taxonomy. a α-Diversity expressed by the Chao1 richness index. The color expresses belonging to the group of mice: nMS in green and MS in red. The significance is expressed by the asterisk following the code: *0.01 < p < 0.05; **0.001 < p < 0.01; ***p < 0.001. b β-diversity performed by principal coordinate analyses (PCoA) using Jaccard dissimilarity matrix index. The triangle and the circles are groups of mice subjected to probiotics or placebo respectively. The color expresses belonging to the group of mice: nMS in green and MS in red. c and d LEfSe results using nMS and MS group of mice as classes and OB and PLA as subclasses. The cladogram (c) and the LDA results (d) show all the taxonomy levels until species. The most abundant features in nMS or MS are highlighted in green and red, respectively. e and f LEfSe results using OB and PLA as classes and nMS and MS groups as subclasses. The cladogram (e) and the LDA results (f) show all the taxonomy levels until species. The most abundant features in placebo or OttaBac® are highlighted in green and red, respectively. We utilized five mice/group
Fig. 6
Fig. 6
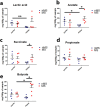
Effect of OttaBac® on SCFAs abundance. Tukey box plots representing the SCFAs abundance in mg/100 g of sample. The significance is expressed by the asterisk following the code: *0.01 < p < 0.05; **0.001 < p < 0.01; ***p < 0.001. We utilized five mice/group

References

    1. Accarie A, Vanuytsel T. Animal models for functional gastrointestinal disorders. Front Psychiatry. 2020;11:509681. doi: 10.3389/fpsyt.2020.509681. - DOI - PMC - PubMed
    1. Vannucchi MG, Evangelista S. Experimental models of irritable bowel syndrome and the role of the enteric neurotransmission. J Clin Med. 2018;7(1):4. England. - PMC - PubMed
    1. van Bodegom M, Homberg JR, Henckens MJAG. Modulation of the hypothalamic-pituitary-adrenal axis by early life stress exposure. Front Cell Neurosci. 2017;11:87. Switzerland. - PMC - PubMed
    1. Lai M-C, Huang L-T. Effects of early life stress on neuroendocrine and neurobehavior: mechanisms and implications. Pediatr Neonatol. 2011;52:122–129. doi: 10.1016/j.pedneo.2011.03.008. - DOI - PubMed
    1. Chen Y, Baram TZ. Toward understanding how early-life stress reprograms cognitive and emotional brain networks. Neuropsychopharmacol. 2016;41:197–206. United States. - PMC - PubMed

Publication types