

Prevotella and succinate treatments altered gut microbiota, increased laying performance, and suppressed hepatic lipid accumulation in laying hens
- PMID: 38369510
- PMCID: PMC10874536
- DOI: 10.1186/s40104-023-00975-5
Prevotella and succinate treatments altered gut microbiota, increased laying performance, and suppressed hepatic lipid accumulation in laying hens
Abstract
Background: This work aimed to investigate the potential benefits of administering Prevotella and its primary metabolite succinate on performance, hepatic lipid accumulation and gut microbiota in laying hens.
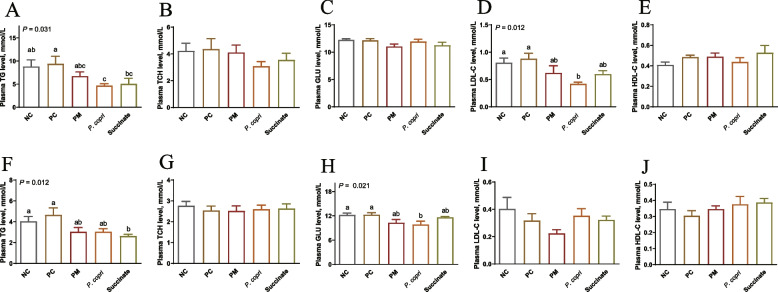
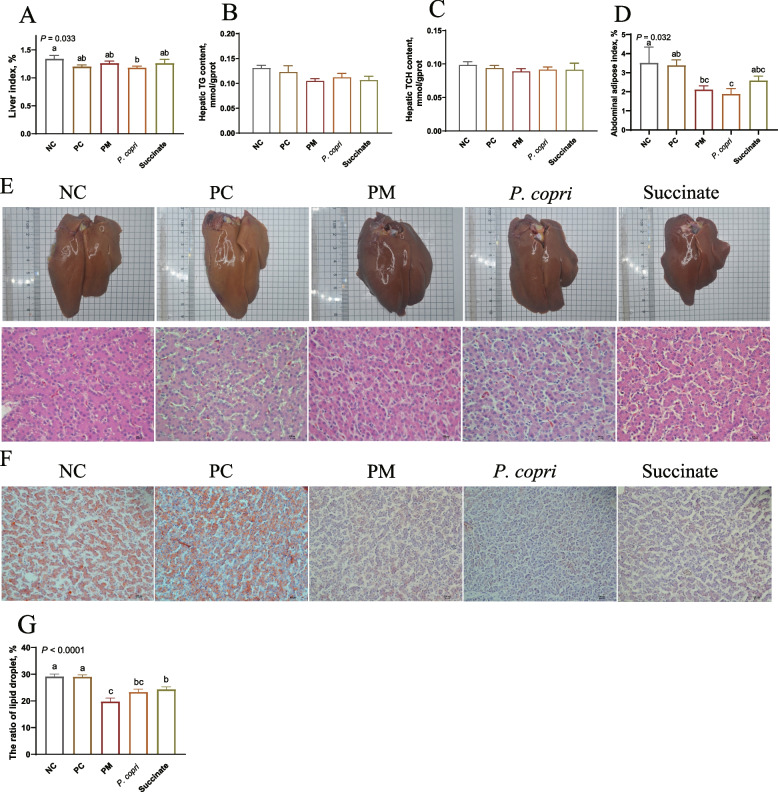
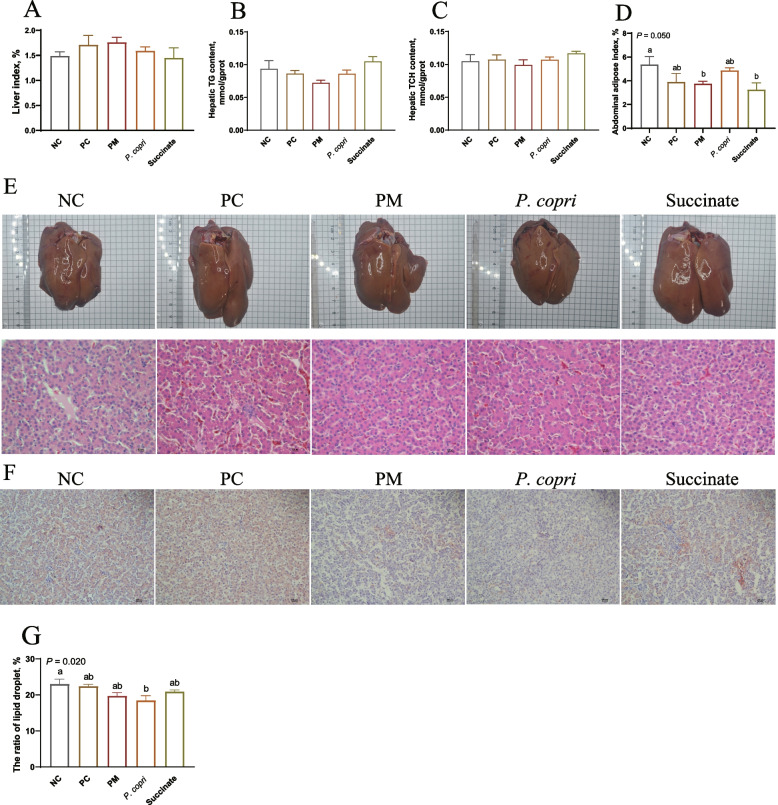
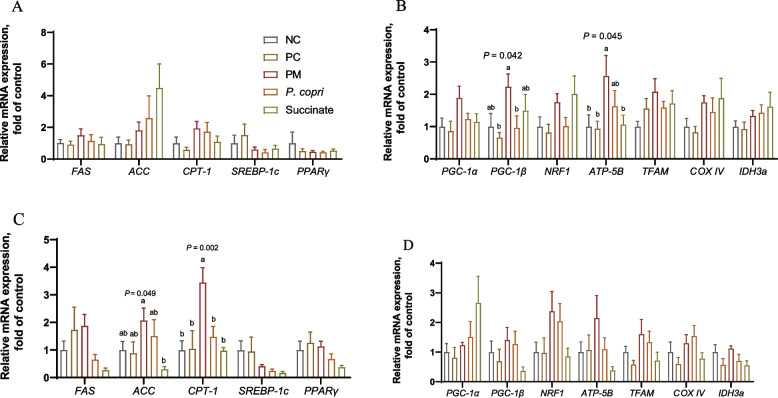
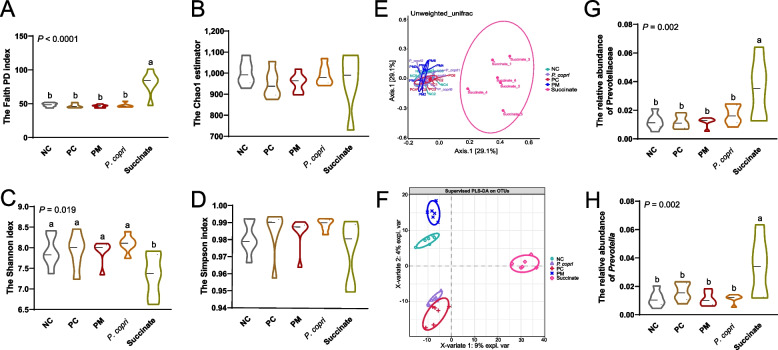
Results: One hundred and fifty 58-week-old Hyline Brown laying hens, with laying rate below 80% and plasma triglyceride (TG) exceeding 5 mmol/L, were used in this study. The hens were randomly allocated into 5 groups and subjected to one of the following treatments: fed with a basal diet (negative control, NC), oral gavage of 3 mL/hen saline every other day (positive control, PC), gavage of 3 mL/hen Prevotella melaninogenica (107 CFU/mL, PM) or 3 mL/hen Prevotella copri (107 CFU/mL, P. copri) every other day, and basal diet supplemented with 0.25% sodium succinate (Succinate). The results showed that PM and P. copri treatments significantly improved laying rate compared to the PC (P < 0.05). The amount of lipid droplet was notably decreased by PM, P. copri, and Succinate treatments at week 4 and decreased by P. copri at week 8 (P < 0.05). Correspondingly, the plasma TG level in Succinate group was lower than that of PC (P < 0.05). Hepatic TG content, however, was not significantly influenced at week 4 and 8 (P > 0.05). PM treatment increased (P < 0.05) the mRNA levels of genes PGC-1β and APB-5B at week 4, and ACC and CPT-1 at week 8. The results indicated enhanced antioxidant activities at week 8, as evidenced by reduced hepatic malondialdehyde (MDA) level and improved antioxidant enzymes activities in PM and Succinate groups (P < 0.05). Supplementing with Prevotella or succinate can alter the cecal microbiota. Specifically, the abundance of Prevotella in the Succinate group was significantly higher than that in the other 4 groups at the family and genus levels (P < 0.05).
Conclusions: Oral intake of Prevotella and dietary supplementation of succinate can ameliorate lipid metabolism of laying hens. The beneficial effect of Prevotella is consistent across different species. The finding highlights that succinate, the primary metabolite of Prevotella, represents a more feasible feed additive for alleviating fatty liver in laying hens.
Keywords: Fatty liver; Gut microbiota; Laying hen; Prevotella; Succinate.
© 2024. The Author(s).
Conflict of interest statement
The authors declare that they have no conflicts of interest.
Figures


Similar articles
-
Dietary silymarin improves performance by altering hepatic lipid metabolism and cecal microbiota function and its metabolites in late laying hens.J Anim Sci Biotechnol. 2024 Jul 13;15(1):100. doi: 10.1186/s40104-024-01057-w. J Anim Sci Biotechnol. 2024. PMID: 38997768 Free PMC article.
-
Prevotella-Produced Succinate Alleviates Hepatic Steatosis by Enhancing Mitochondrial Function in Layer-Type Chickens.J Nutr. 2025 Jun;155(6):1751-1767. doi: 10.1016/j.tjnut.2025.04.018. Epub 2025 Apr 22. J Nutr. 2025. PMID: 40274237
-
Dietary supplementation of porcine bile acids improves laying performance, serum lipid metabolism and cecal microbiota in late-phase laying hens.Anim Nutr. 2022 Aug 14;11:283-292. doi: 10.1016/j.aninu.2022.08.003. eCollection 2022 Dec. Anim Nutr. 2022. PMID: 36263401 Free PMC article.
-
Effects of herbal dregs supplementation of Salvia miltiorrhiza and Isatidis Radix residues improved production performance and gut microbiota abundance in late-phase laying hens.Front Vet Sci. 2024 May 3;11:1381226. doi: 10.3389/fvets.2024.1381226. eCollection 2024. Front Vet Sci. 2024. PMID: 38764854 Free PMC article.
-
Protective effect of Artemisia capillaris on hepatic lipid accumulation in laying hens with fatty liver and the study of its mechanism.Br Poult Sci. 2025 Jun 9:1-12. doi: 10.1080/00071668.2025.2512585. Online ahead of print. Br Poult Sci. 2025. PMID: 40488218 Review.
Cited by
-
Caffeic acid and chlorogenic acid mediate the ADPN-AMPK-PPARα pathway to improve fatty liver and production performance in laying hens.J Anim Sci Biotechnol. 2025 Apr 3;16(1):49. doi: 10.1186/s40104-025-01175-z. J Anim Sci Biotechnol. 2025. PMID: 40176148 Free PMC article.
-
Dietary index for gut microbiota and its inverse association with female infertility: evidence from NHANES 2013-2018.Front Nutr. 2025 Apr 4;12:1564549. doi: 10.3389/fnut.2025.1564549. eCollection 2025. Front Nutr. 2025. PMID: 40256166 Free PMC article.
-
Dietary silymarin improves performance by altering hepatic lipid metabolism and cecal microbiota function and its metabolites in late laying hens.J Anim Sci Biotechnol. 2024 Jul 13;15(1):100. doi: 10.1186/s40104-024-01057-w. J Anim Sci Biotechnol. 2024. PMID: 38997768 Free PMC article.
-
Multi-omics analysis provides new insights into molecular mechanisms for waterfowl fatty liver formation.Poult Sci. 2025 Jun 6;104(9):105398. doi: 10.1016/j.psj.2025.105398. Online ahead of print. Poult Sci. 2025. PMID: 40570459 Free PMC article.
-
The mechanism of egg production improvement in laying hens before and after molting revealed by transcriptome and metabolome integration.Poult Sci. 2025 Jul;104(7):105125. doi: 10.1016/j.psj.2025.105125. Epub 2025 Apr 2. Poult Sci. 2025. PMID: 40315586 Free PMC article.
References
-
- Aziza A, Awadin W, Cherian G. Impact of choline supplementation on hepatic histopathology, phospholipid content, and tocopherol status in layer hens fed flaxseed. J Appl Poultry Res. 2019;28:679–687. doi: 10.3382/japr/pfz019. - DOI
-
- Han GP, Kim DY, Kim K, Kim JH, Kil DY. Effect of dietary concentrations of metabolizable energy and neutral detergent fiber on productive performance, egg quality, fatty liver incidence, and hepatic fatty acid metabolism in aged laying hens. Poult Sci. 2023;102:102497. doi: 10.1016/j.psj.2023.102497. - DOI - PMC - PubMed
Grants and funding
- 32330101/National Natural Science Foundation of China
- 2021YFD1300405/the National Key Research and Development Program of China
- 32102575/the National Natural Science Foundation of China
- CARS-40-K9/Modern Agro-industry Technology Research System
- 2019JZZY020602/the Key Technology Research and Development Program of Shandong province
LinkOut - more resources
Full Text Sources
Molecular Biology Databases
Miscellaneous
