Review
. 2024 Feb 18;20(1):31.
doi: 10.1186/s13007-024-01152-z.

Towards portable MRI in the plant sciences

Affiliations
Review

Towards portable MRI in the plant sciences

Shannan Blystone et al. Plant Methods. .

Abstract

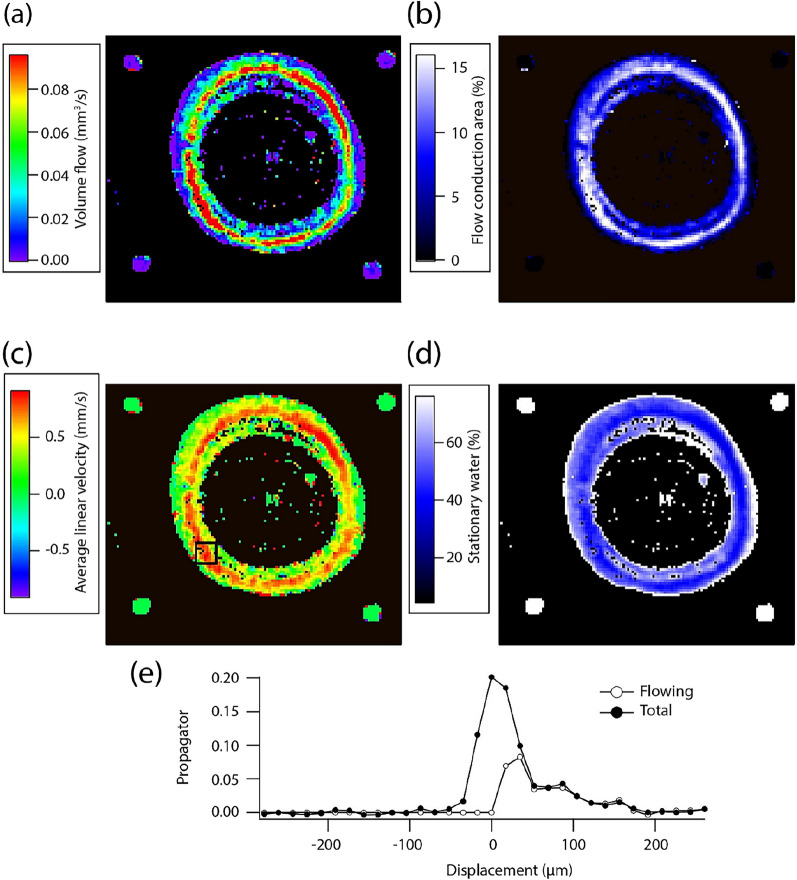
Plant physiology and structure are constantly changing according to internal and external factors. The study of plant water dynamics can give information on these changes, as they are linked to numerous plant functions. Currently, most of the methods used to study plant water dynamics are either invasive, destructive, or not easily accessible. Portable magnetic resonance imaging (MRI) is a field undergoing rapid expansion and which presents substantial advantages in the plant sciences. MRI permits the non-invasive study of plant water content, flow, structure, stress response, and other physiological processes, as a multitude of information can be obtained using the method, and portable devices make it possible to take these measurements in situ, in a plant's natural environment. In this work, we review the use of such devices applied to plants in climate chambers, greenhouses or in their natural environments. We also compare the use of portable MRI to other methods to obtain the same information and outline its advantages and disadvantages.

Keywords: Cavitation; Flow; Low-field NMR; Plant physiology; Relaxation times; Structure; Water.


Conflict of interest statement

The authors declare that they have no competing interests.

Figures

Fig. 1
Fig. 1
According to the weighting of the NMR decay, different parameters can be measured such as proton density, longitudinal (T1) and transverse (T2) relaxation times, diffusion (ADC) and flux. Subset (a) represents proton density and T2 maps acquired on a Fagus sylvatica stem (Adapted from [10] with permission from Wiley). Subset (b) represents an ADC map acquired on a pear tree (Adapted from [11] with permission from AIP Publishing). Subset (c) represents an example of flux measurements. It corresponds to the average linear velocity map of a poplar tree stem (Adapted from [12] with permission from Blackwell Publishing Ltd). The red scale corresponds to the velocity measured in the phloem, while the blue scale corresponds to the velocity measured in the xylem
Fig. 2
Fig. 2
Proton density (A) and transversal relaxation time (T2) maps acquired with a 0.25 T-MRI, and microscopy images of the stem of three Fagus sylvatica samples (1–3). The proton density is related to water content (%) (Adapted from [10] with permission from Wiley)
Fig. 3
Fig. 3
Flow parameters: volume flow (a), flow conducting area (b), average linear velocity (c), and amount of stationary water (d). The propagator displayed (e) was measured in the pixel represented by a black square in (c). These measurements were acquired with a 0.2 T-MRI on a Zelkova tree in situ (Adapted from [33] with permission from Elsevier)
Fig. 4.
Fig. 4.
0.2 T-MRI positioned outside the laboratory on the stem of Zelkova serrata. Images (af) shows the growth of the stem, an increase of the stem diameter being observed (Adapted from [33] with permission from Elsevier)
Fig. 5
Fig. 5
Profiles acquired on (a) the branch of a birch tree, B. pendula (Blystone et al., unpublished). The peak between the dashed lines corresponds to the bark zone, including the phloem tissue (PHL), while the broader peak at greater depths corresponds to xylem tissue (XYL); (b) Linear regression of the integral of the NMR signal as a function of water content, taken through time, on branches of silver birch trees. The green and yellow points correspond to the profiles of subset a. (c) Diurnal evolution of the average water content in an Aspen tree under well-watered (black) and water limited conditions (Adapted from [56] with permission from Frontiers). (d) Quantitative maps of a Fagus sylvatica stem according to the water potential (Adapted from [10] with permission from Wiley)

References

    1. Schulze ED, Beck E, Buchmann N, Clemens S, Müller-Hohenstein K, Scherer-Lorenzen M. Water deficiency (Drought) In: Schulze ED, Beck E, Buchmann N, Clemens S, Müller-Hohenstein K, Scherer-Lorenzen M, editors. Plant ecology. Berlin: Springer, Berlin Heidelberg; 2019. pp. 165–202.
    1. Kamal T, Cheng S, Khan IA, Nawab K, Zhang T, Song Y, et al. Potential uses of LF-NMR and MRI in the study of water dynamics and quality measurement of fruits and vegetables. J Food Process Preserv. 2019;43(11):e14202. doi: 10.1111/jfpp.14202. - DOI
    1. Colnago LA, Wiesman Z, Pages G, Musse M, Monaretto T, Windt CW, et al. Low field, time domain NMR in the agriculture and agrifood sectors: an overview of applications in plants, foods and biofuels. J Magn Reson. 2021;323:106899. doi: 10.1016/j.jmr.2020.106899. - DOI - PubMed
    1. Hills BP, Duce SL. The influence of chemical and diffusive exchange on water proton transverse relaxation in plant tissues. Magn Reson Imaging. 1990;8(3):321–331. doi: 10.1016/0730-725X(90)90106-C. - DOI - PubMed
    1. Van As H. Intact plant MRI for the study of cell water relations, membrane permeability, cell-to-cell and long distance water transport. J Exp Bot. 2007;58(4):743–756. - PubMed

LinkOut - more resources