. 2024 Feb 18;14(1):4007.
doi: 10.1038/s41598-024-54519-6.

Impact of the diet in the gut microbiota after an inter-species microbial transplantation in fish

Affiliations

Impact of the diet in the gut microbiota after an inter-species microbial transplantation in fish

Alberto Ruiz et al. Sci Rep. .

Abstract

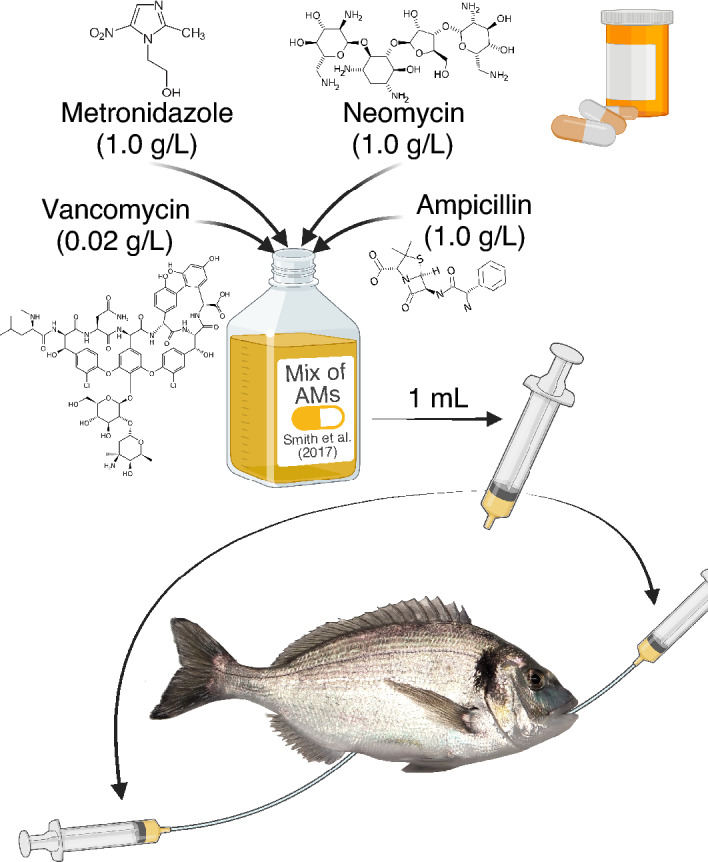
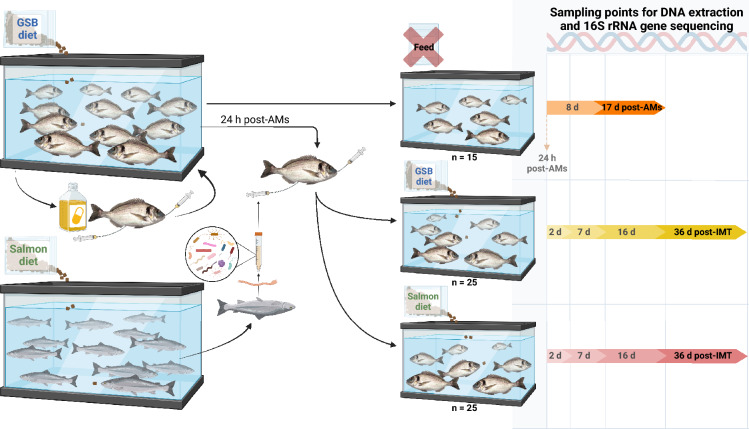
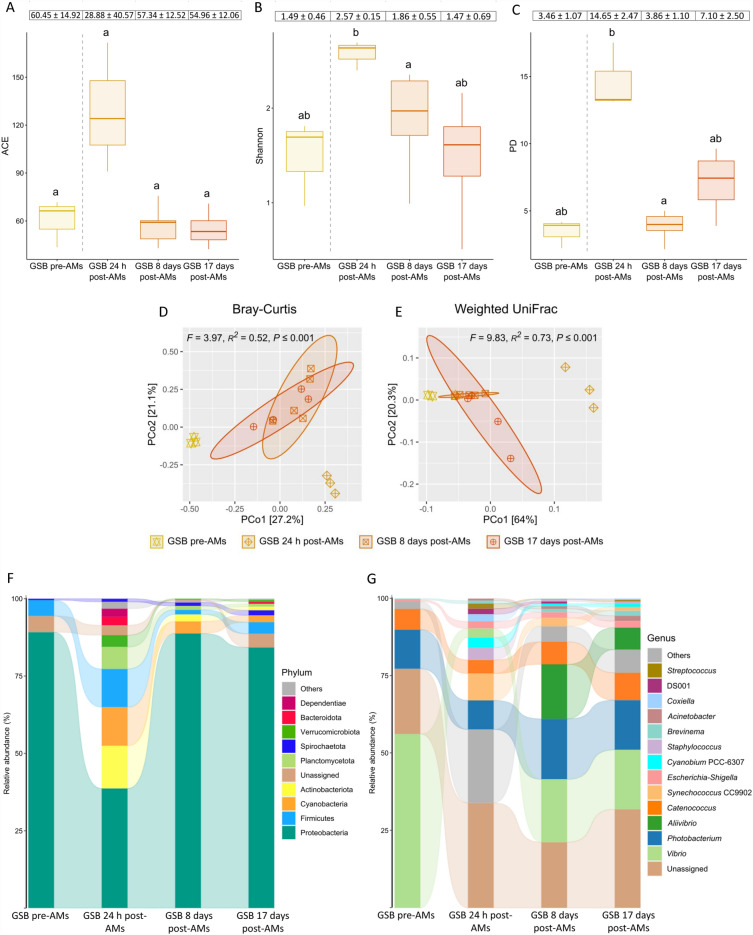
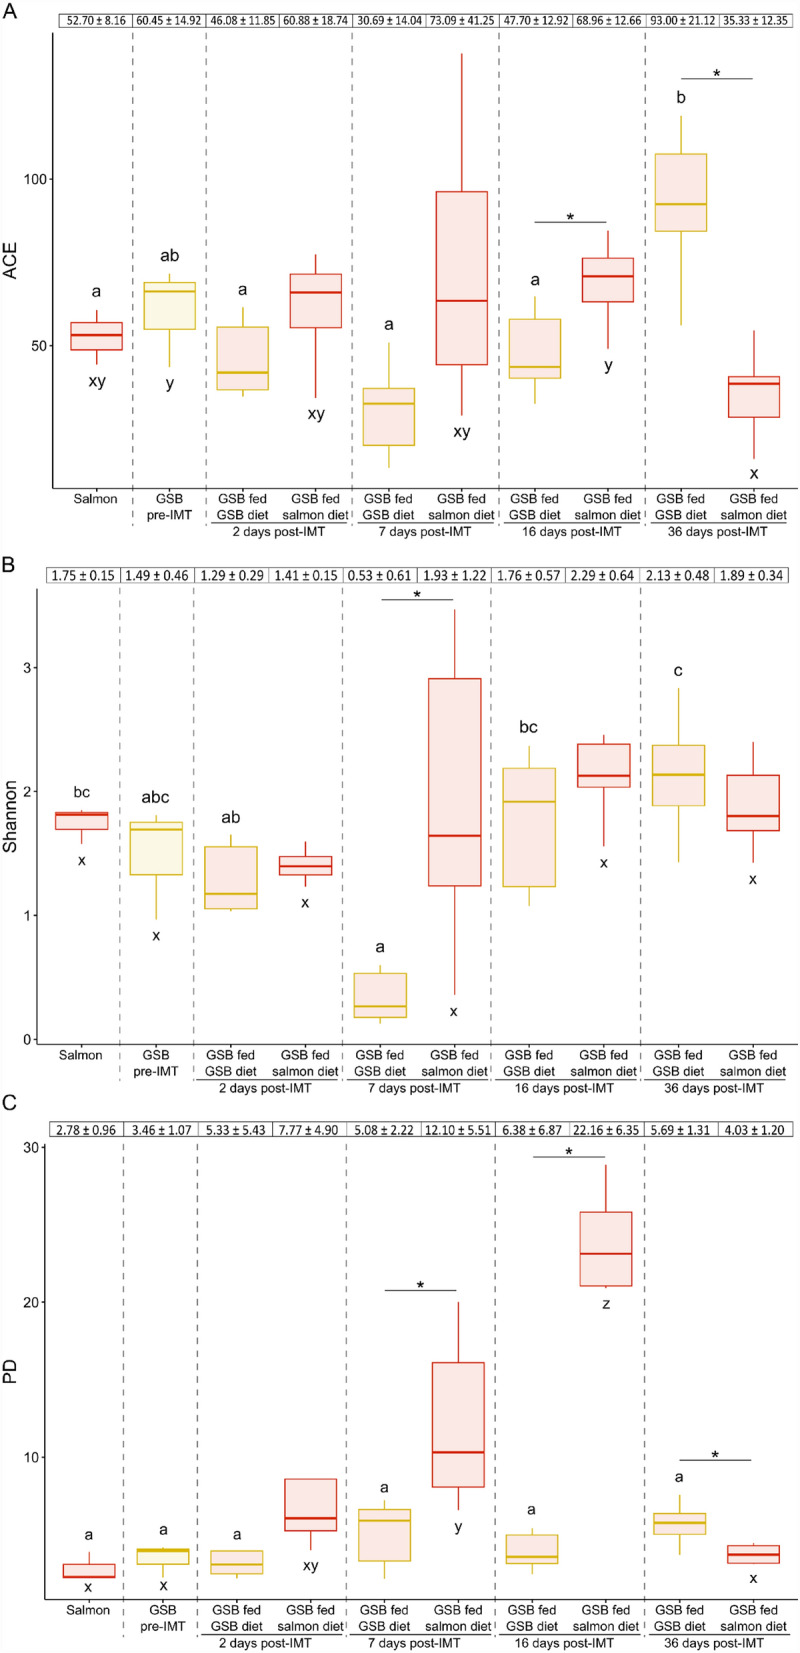
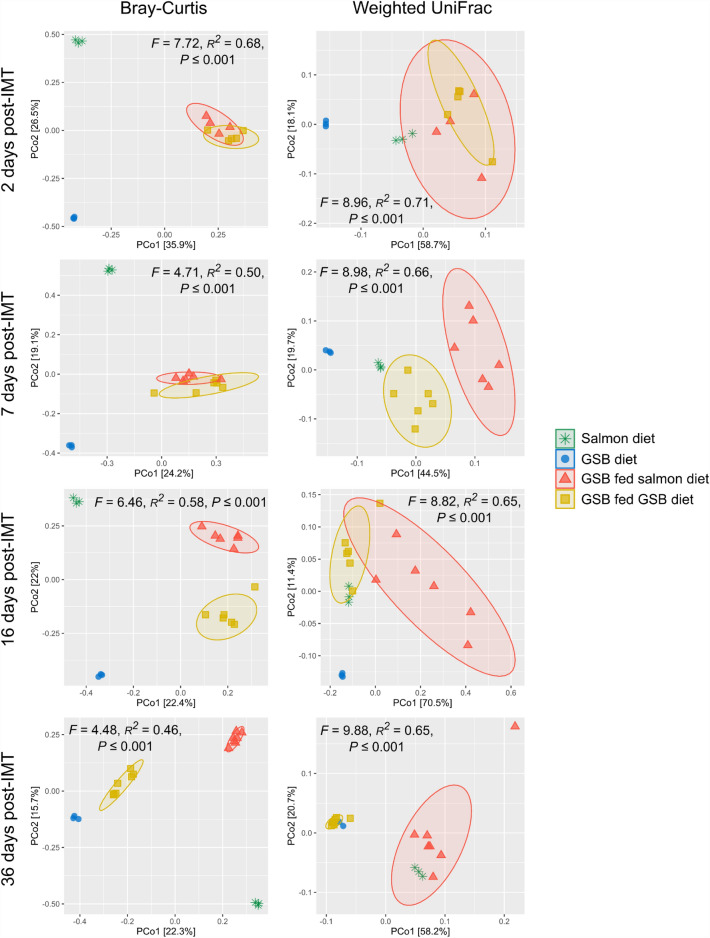
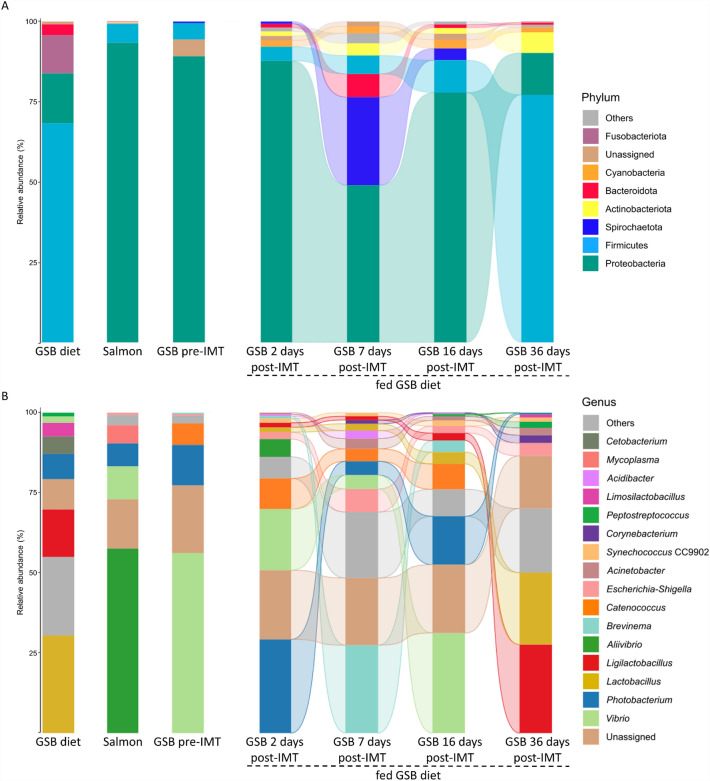
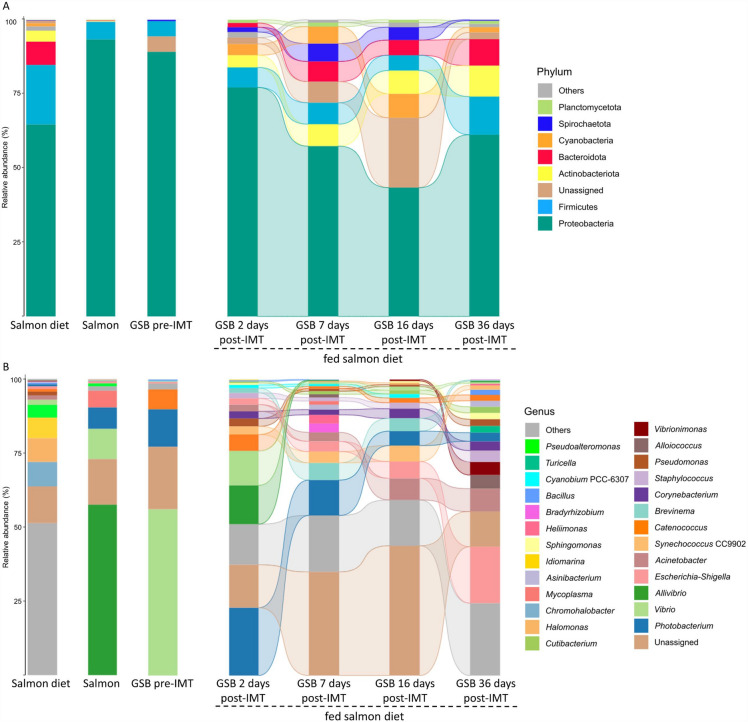
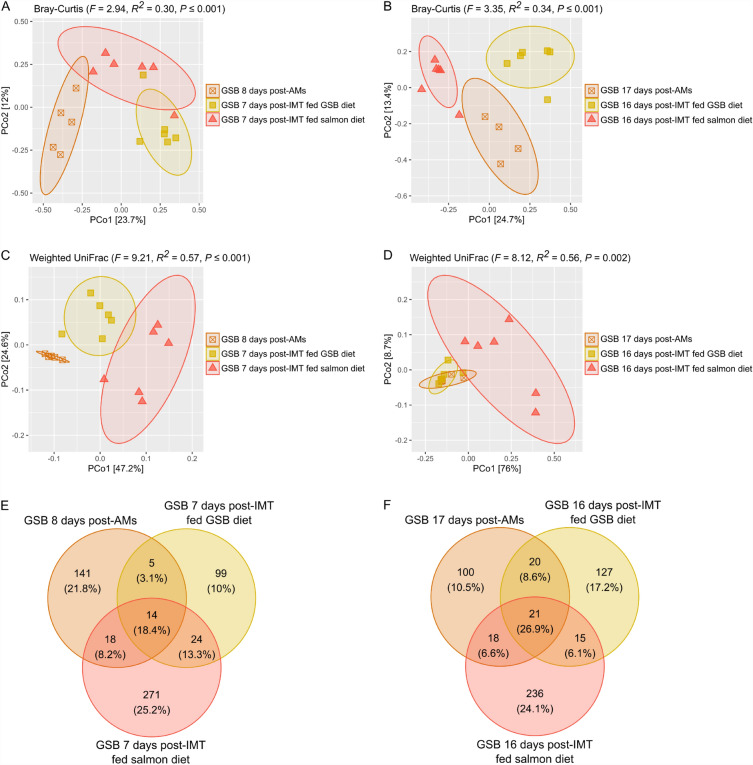
Inter-species microbial transplantations offer the possibility of transferring species-specific microbes and their associated functionality. As a conceptual approach, an intestinal microbiota transplant (IMT) between two marine carnivorous fish species that thrive in different environmental conditions was conducted: from donor Atlantic salmon (Salmo salar) to recipient gilthead seabream (Sparus aurata), after obliterating its basal microbiota with an antibiotic treatment. To confirm that the gut microbiota was able to recover after antibiotics without the influence of the diet, a group of gilthead seabream not submitted to the IMT was kept fasted as an internal control. To assess the effect of the diet after the IMT, two groups of gilthead seabream were respectively fed with their typical diet and with Atlantic salmon diet. At 36 days post-IMT, the gut of the individuals fed with their typical diet was dominated by the feed-associated bacteria, while those fed with the salmon diet had developed a unique microbiota from the convergence of the diet, donor, and recipient microbiota. These results suggested that an intestinal microbiota transplantation may be effective if the basal microbiota from the gut is first cleared and a targeted dietary modification is provided to maintain and enrich the novel bacteria species over time.


Conflict of interest statement

The authors declare no competing interests.

Figures

Figure 1
Figure 1
Schematic representation of the composition and administration of the antimicrobial mixture to recipient gilthead seabream (Sparus aurata). Created with BioRender.com.
Figure 2
Figure 2
Schematic representation of the steps followed for intestinal sampling of bacteria: 1, stripping for chyme collection; 2, scraping for collection of mucosal content; 3, gathering of bacteria still associated to the tissue by shaking; and 4, pooling and homogenization in a Stomacher. Created with BioRender.com.
Figure 3
Figure 3
Schematic representation of the intestinal microbiota transplant (IMT) from Atlantic salmon (Salmo salar) to gilthead seabream (Sparus aurata) and subsequent nutritional assay carried out for assessing the effect of the diet in the gut bacterial communities. After the antimicrobial (AM) treatment, one group of gilthead seabream (n = 15) was fasted for 17 days in order to assess the effect of AMs in the absence of dietary influences. The rest of the gilthead seabream (n = 50) were submitted to the IMT 24 h post-AMs, and in order to assess the effect of the diet, gilthead seabream given the IMT were divided in two tanks (n = 25 per tank): one which continued with the GSB diet, and the other fed with the salmon diet. Created with BioRender.com.
Figure 4
Figure 4
Gut bacterial communities in fasted gilthead seabream (Sparus aurata) from the pre- antimicrobial treatment (GSB pre-AMs) during the first 17 days: Alpha diversity measured by (A) ACE index, (B) Shannon index, and (C) Faith’s phylogenetic diversity index (PD). The letters show significant differences among experimental groups (Kruskal–Wallis with Wilcoxon post-hoc test; P ≤ 0.05). Microbial structure analyzed with (D) Bray–Curtis and (E) weighted UniFrac distances. Significant differences among experimental groups are shown in black captions (PERMANOVA; P ≤ 0.05). Microbial composition at the level of (F) phylum and (G) genus. Taxa with an abundance < 0.5% are classified as “Others”. Mean ± SD values and significant differences among experimental groups (Kruskal–Wallis with Wilcoxon post-hoc test; P ≤ 0.1) at the level of phylum and genus can be found at Supplementary Tables S1 and S2, respectively.
Figure 5
Figure 5
Microbial alpha diversity of the gut bacterial communities in Atlantic salmon (Salmo salar), in gilthead seabream (Sparus aurata) previous to the intestinal microbiota transplant from donor Atlantic salmon specimens (GSB pre-IMT and after AM treatment) and in gilthead seabream fed either their typical diet (GSB fed GSB diet) or the Atlantic salmon diet (GSB fed salmon diet) at 2, 7, 16 and 36 days post-IMT: (A) ACE index, (B) Shannon index, and (C) Faith’s phylogenetic diversity index (PD). The top table represents the index values per group as mean ± SD. Box plots represents the minimum, maximum and the median of the sample values obtained from the diversity indices, and the letters show significant differences among experimental groups (Kruskal–Wallis with Wilcoxon post-hoc test; P ≤ 0.05).
Figure 6
Figure 6
Microbial structure of the gut bacterial communities in gilthead seabream (Sparus aurata) fed either their typical diet (GSB fed GSB diet) or the Atlantic salmon diet (GSB fed salmon diet) at 2, 7, 16 and 36 days after the intestinal microbiota transplant from donor Atlantic salmon (post-IMT), as well as of GSB and salmon diets. Beta diversity was analyzed with the metrics of Bray–Curtis and weighted UniFrac distances, and represented by individual distributions in the principal coordinate analyses. Significant differences among experimental groups are shown (PERMANOVA; P ≤ 0.05).
Figure 7
Figure 7
Contrasting control treatments with gilthead seabream (Sparus aurata) fed an experimental gilthead seabream diet (GSB diet): Mean relative abundances of the gut bacterial communities in GSB diet, Atlantic salmon (microbiota donor), gilthead seabream previous to the intestinal microbiota transplant (GSB pre-IMT and after AM treatment) and in gilthead seabream fed the GSB diet at 2, 7, 16 and 36 days post-IMT (A) at the level of phylum, and (B) at the level of genus. Taxa with an abundance < 0.5% are classified as “Others”. Mean ± SD values for phyla and genera are compiled in Supplementary Tables S3 and S4, respectively. Significant differences among experimental groups (Kruskal–Wallis with Wilcoxon post-hoc test; P ≤ 0.1) at the level of phylum and genus can be found in Supplementary Figs. S2 and S3, respectively.
Figure 8
Figure 8
Contrasting control treatments with gilthead seabream (Sparus aurata) fed an experimental salmon diet: mean relative abundances of the gut bacterial communities in gilthead seabream fed the salmon diet, Atlantic salmon (microbiota donor), gilthead seabream previous to the intestinal microbiota transplant (GSB pre-IMT and after AM treatment) and in gilthead seabream fed the salmon diet at 2, 7, 16 and 36 days post-IMT (A) at the level of phylum, and (B) at the level of genus. Taxa with an abundance < 0.5% are classified as “Others”. Mean ± SD values for phyla and genera are compiled at Supplementary Tables S5 and S6, respectively. Significant differences among experimental groups (Kruskal–Wallis with Wilcoxon post-hoc test; P ≤ 0.1) at the level of phylum and genus can be found in Supplementary Figs. S4 and S5, respectively.
Figure 9
Figure 9
Microbial structure of the gut bacterial communities in gilthead seabream (Sparus aurata) from the group which was fasted after the antimicrobial treatment (post-AMs) and the groups which were submitted to the intestinal microbiota transplant and then fed either their typical diet (GSB fed GSB diet) or the Atlantic salmon diet (GSB fed salmon diet). Beta diversity was analyzed using (A,B) Bray Curtis, and (C,D) weighted UniFrac distances, at 7 and 16 days post-IMT (8 and 17 days post-AMs), respectively. Venn diagram plotting the number of unique and shared ASVs (and relative abundance %) of the three groups (E) at 7 days post-IMT, and (F) at 16 days post-IMT.

Similar articles

Cited by

References

    1. Brugman S, Ikeda-Ohtsubo W, Braber S, Folkerts G, Pieterse CM, Bakker PA. A comparative review on microbiota manipulation: lessons from fish, plants, livestock, and human research. Front Nutr. 2018;5:80. doi: 10.3389/fnut.2018.00080. - DOI - PMC - PubMed
    1. Mills S, Stanton C, Lane JA, Smith GJ, Ross RP. Precision nutrition and the microbiome, part I: current state of the science. Nutrients. 2019;11:923. doi: 10.3390/nu11040923. - DOI - PMC - PubMed
    1. Sommer F, Anderson JM, Bharti R, Raes J, Rosenstiel P. The resilience of the intestinal microbiota influences health and disease. Nat. Rev. Microbiol. 2017;15:630–638. doi: 10.1038/nrmicro.2017.58. - DOI - PubMed
    1. Brugman S, et al. T lymphocytes control microbial composition by regulating the abundance of Vibrio in the zebrafish gut. Gut Microbes. 2014;5:737–747. doi: 10.4161/19490976.2014.972228. - DOI - PMC - PubMed
    1. Astudillo-García C, et al. Evaluating the core microbiota in complex communities: A systematic investigation. Environ. Microbiol. 2017;19:1450–1462. doi: 10.1111/1462-2920.13647. - DOI - PubMed