

Assessment of area and structural irregularity of retinal layers in diabetic retinopathy using machine learning and image processing techniques
- PMID: 38369610
- PMCID: PMC10874958
- DOI: 10.1038/s41598-024-54535-6
Assessment of area and structural irregularity of retinal layers in diabetic retinopathy using machine learning and image processing techniques
Abstract
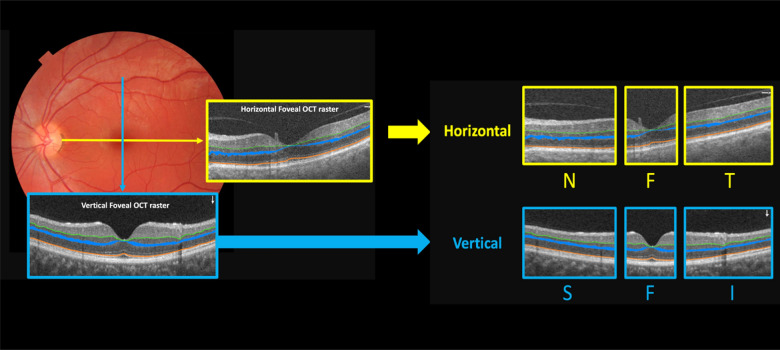
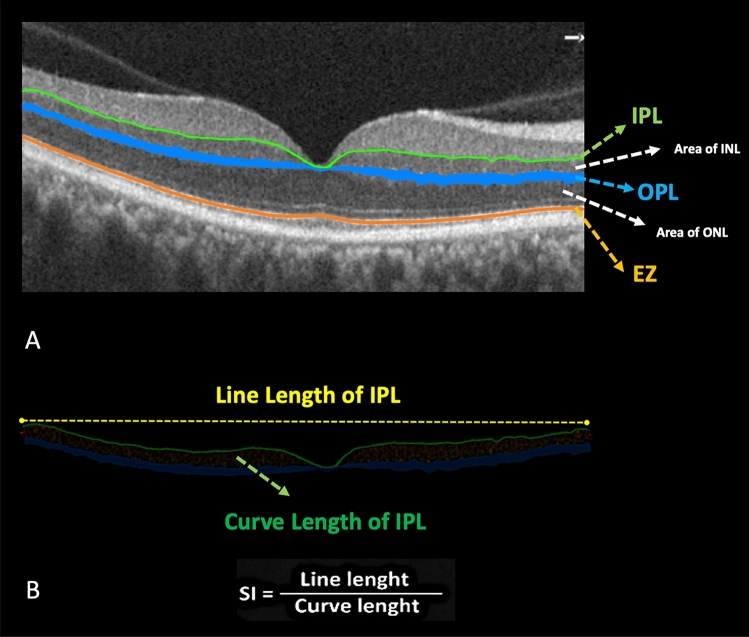
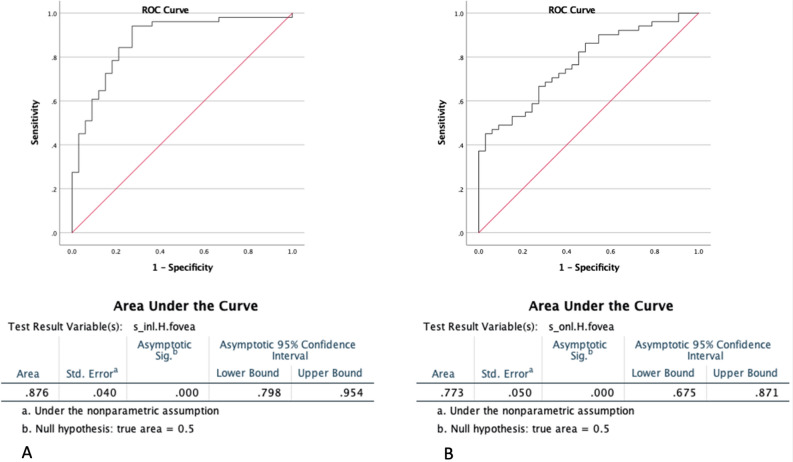
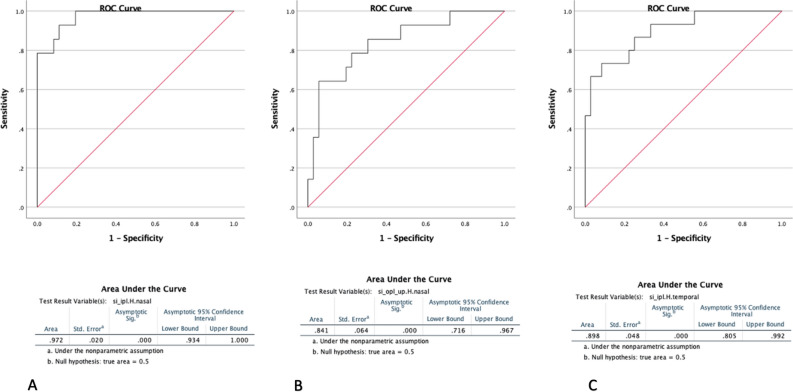
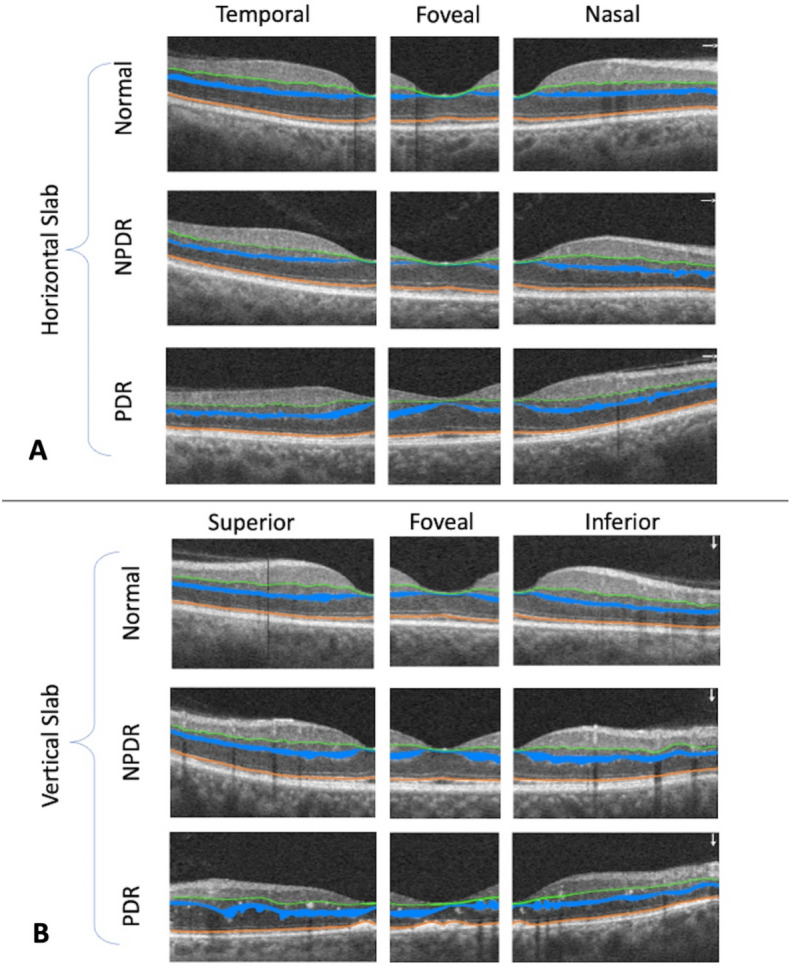
Diabetes retinopathy prevention necessitates early detection, monitoring, and treatment. Non-invasive optical coherence tomography (OCT) shows structural changes in the retinal layer. OCT image evaluation necessitates retinal layer segmentation. The ability of our automated retinal layer segmentation to distinguish between normal, non-proliferative (NPDR), and proliferative diabetic retinopathy (PDR) was investigated in this study using quantifiable biomarkers such as retina layer smoothness index (SI) and area (S) in horizontal and vertical OCT images for each zone (fovea, superior, inferior, nasal, and temporal). This research includes 84 eyes from 57 individuals. The study shows a significant difference in the Area (S) of inner nuclear layer (INL) and outer nuclear layer (ONL) in the horizontal foveal zone across the three groups (p < 0.001). In the horizontal scan, there is a significant difference in the smoothness index (SI) of the inner plexiform layer (IPL) and the upper border of the outer plexiform layer (OPL) among three groups (p < 0.05). There is also a significant difference in the area (S) of the OPL in the foveal zone among the three groups (p = 0.003). The area (S) of the INL in the foveal region of horizontal slabs performed best for distinguishing diabetic patients (NPDR and PDR) from normal individuals, with an accuracy of 87.6%. The smoothness index (SI) of IPL in the nasal zone of horizontal foveal slabs was the most accurate at 97.2% in distinguishing PDR from NPDR. The smoothness index of the top border of the OPL in the nasal zone of horizontal slabs was 84.1% accurate in distinguishing NPDR from PDR. Smoothness index of IPL in the temporal zone of horizontal slabs was 89.8% accurate in identifying NPDR from PDR patients. In conclusion, optical coherence tomography can assess the smoothness index and irregularity of the inner and outer plexiform layers, particularly in the nasal and temporal regions of horizontal foveal slabs, to distinguish non-proliferative from proliferative diabetic retinopathy. The evolution of diabetic retinopathy throughout severity levels and its effects on retinal layer irregularity need more study.
© 2024. The Author(s).
Conflict of interest statement
The authors declare no competing interests.
Figures
Similar articles
-
Evaluation of Structural Retinal Layer Alterations in Retinitis Pigmentosa.Rom J Ophthalmol. 2023 Oct-Dec;67(4):326-336. doi: 10.22336/rjo.2023.53. Rom J Ophthalmol. 2023. PMID: 38239428 Free PMC article.
-
Automated assessment of the smoothness of retinal layers in optical coherence tomography images using a machine learning algorithm.BMC Med Imaging. 2023 Feb 2;23(1):21. doi: 10.1186/s12880-023-00976-w. BMC Med Imaging. 2023. PMID: 36732684 Free PMC article.
-
QUANTIFICATION OF RETINAL VESSEL TORTUOSITY IN DIABETIC RETINOPATHY USING OPTICAL COHERENCE TOMOGRAPHY ANGIOGRAPHY.Retina. 2018 May;38(5):976-985. doi: 10.1097/IAE.0000000000001618. Retina. 2018. PMID: 28333883
-
Automated machine learning-based classification of proliferative and non-proliferative diabetic retinopathy using optical coherence tomography angiography vascular density maps.Graefes Arch Clin Exp Ophthalmol. 2023 Feb;261(2):391-399. doi: 10.1007/s00417-022-05818-z. Epub 2022 Sep 2. Graefes Arch Clin Exp Ophthalmol. 2023. PMID: 36050474
-
Optical coherence tomography angiography and microvascular changes in diabetic retinopathy: a systematic review.Acta Ophthalmol. 2019 Feb;97(1):7-14. doi: 10.1111/aos.13859. Epub 2018 Sep 20. Acta Ophthalmol. 2019. PMID: 30238633
Cited by
-
Evaluation of retinal structure changes with AI-based OCT image segmentation for sodium iodate induced retinal degeneration.Front Cell Neurosci. 2025 Jun 18;19:1605639. doi: 10.3389/fncel.2025.1605639. eCollection 2025. Front Cell Neurosci. 2025. PMID: 40606272 Free PMC article.
-
Artificial intelligence for early detection of diabetes mellitus complications via retinal imaging.J Diabetes Metab Disord. 2025 Apr 12;24(1):104. doi: 10.1007/s40200-025-01596-7. eCollection 2025 Jun. J Diabetes Metab Disord. 2025. PMID: 40224528 Free PMC article. Review.
References
-
- Early Treatment Diabetic Retinopathy Study Research Group Early photocoagulation for diabetic retinopathy. ETDRS report number 9. Early Treatment Diabetic Retinopathy Study Research Group. Ophthalmology. 1991;98:766–785. - PubMed
MeSH terms
LinkOut - more resources
Full Text Sources
Medical
