Review
. 2024 Feb 1:11:1352025.
doi: 10.3389/fcvm.2024.1352025. eCollection 2024.

Invasive coronary imaging of inflammation to further characterize high-risk lesions: what options do we have?

Affiliations
Review

Invasive coronary imaging of inflammation to further characterize high-risk lesions: what options do we have?

Jonathan Los et al. Front Cardiovasc Med. .

Abstract

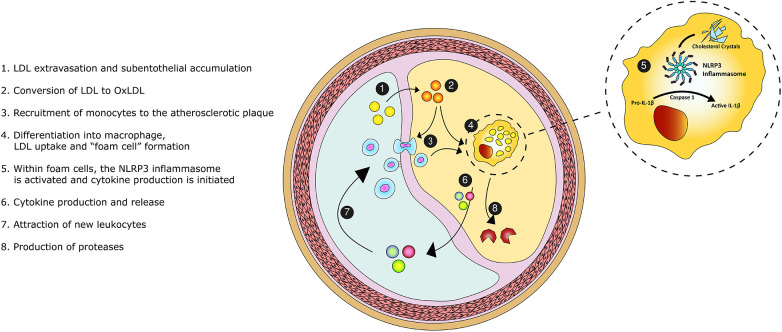
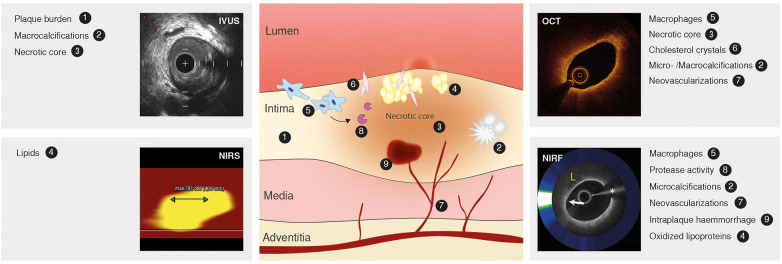
Coronary atherosclerosis remains a leading cause of morbidity and mortality worldwide. The underlying pathophysiology includes a complex interplay of endothelial dysfunction, lipid accumulation and inflammatory pathways. Multiple structural and inflammatory features of the atherosclerotic lesions have become targets to identify high-risk lesions. Various intracoronary imaging devices have been developed to assess the morphological, biocompositional and molecular profile of the intracoronary atheromata. These techniques guide interventional and therapeutical management and allow the identification and stratification of atherosclerotic lesions. We sought to provide an overview of the inflammatory pathobiology of atherosclerosis, distinct high-risk plaque features and the ability to visualize this process with contemporary intracoronary imaging techniques.

Keywords: atherosclerosis; inflammation; intravascular ultrasound; near-infrared fluorescence imaging; near-infrared spectroscopy; optical coherence tomography.


Conflict of interest statement

PD: received research grants and speaker fees from Abbott Vascular; research grants, speaker fees and consultancy fees from Philips; and research grants from AstraZeneca. NvR: research grants from Abbott, Philpis, Biotronik and Medtronic. Speaker fee: Abbott, Bayer, Rainmed, Microport. HG-G: receives consulting fees from Boston Scientific, Abbott and institutional grants from Phillips, Biotronik, Abbott, MedAlliance, Corflow, Chiesi and Medis. JC: Advisory board Amgen en Novo Nordisk. Received research grants from ZonMw. R-JvG: reported grants and personal fees from Boston Scientific, grants and personal fees from Abbott Vascular, grants and personal fees from Astra Zeneca, grants and personal fees from Amgen, grants from InfraRedx. The other authors declare that the research was conducted in the absence of any commercial or financial relationships that could be construed as a potential conflict of interest.

Figures

Figure 1
Figure 1
Graphical overview of the inflammatory pathobiology of atherosclerosis. Legend: Low-density-lipoprotein (LDL) enters the intimal space. The accumulated LDL particles become oxidized and promote the recruitment of monocytes. Monocytes transform into macrophages. Upon the scavenging of lipids, macrophage differentiate into foam cells. Within foam cells, the NOD-, LRR- and pyrin domain-containing protein 3 (NLRP3) inflammasome becomes activated and initiates cytokine en chemokine production, perpetuating the inflammatory process. Foam cells secrete proteases causing proteolysis of the extracellular matrix and destabilizing the atherosclerotic plaque.
Figure 2
Figure 2
Atherosclerotic lesion, markers of inflammation and high-risk plaque and intravascular imaging techniques. Atherosclerotic lesion (middle) depicting the inflammatory pathobiology of atherosclerosis. Contemporary intracoronary imaging tools (intravascular ultrasound, IVUS; near-infrared spectroscopy, NIRS; optical coherence tomography, OCT; near-infrared fluorescence, NIRF) and their ability to display the process. Image of NIRF signal reused with permission from Ughi et al. (122).
Figure 3
Figure 3
Virtual histology intravascular ultrasound (VH-IVUS) image of atherosclerotic plaque. Based on the reflected ultrasound signals, VH-IVUS automatically provides a colorized tissue map of plaque composition: fibrous (dark green), fibrofatty (light green), calcified (white) and necrotic core (red). (A) Longitudinal VH-IVUS image of an atherosclerotic lesion in the right coronary artery. (B) Cross-sectional images within the region of interest showing different tissue compositions. (C) A thin-cap fibroatheroma (TCFA), characterized as a necrotic-core rich lesion without a clear overlying fibrous cap (arrows). Reused with permission from Kuroda et al. (126).
Figure 4
Figure 4
Optical coherence tomography near-infrared spectroscopy (OCT-NIRS) of cadaver coronary artery. Combinded OCT and NIRS (red and yellow circle) imaging of 2 lesions of cadaver coronary artery, showing reduced backscattering (arrows). (A) Lesion with low amounts of lipids, compatible with fibrotic tissue, as it is is shown in red. (B) Lipid-rich plaque displayed as yellow area. Reprinted with permission from Hoang et al. (90) © The Optical Society.
Figure 5
Figure 5
Optical coherence tomography (OCT) images of atherosclerotic plaque and inflammation markers. (A) Macrophages appear as signal-rich bright spots with a signal-poor region below (arrows). (B) Thin-cap fibroatheroma are identified as an atherosclerotic plaque covered by a fibrous cap of <65 µm (between arrows). (C) Cholesterol crystals appear as thin and linear structures with high signal intensity (arrow), often localized nearby lipid-rich plaque. (D) Intraplaque neovessels can be identified as well delineated signal-poor voids (arrows).
Figure 6
Figure 6
Optical coherence tomography near-infrared autofluorescence (OCT-NIRAF) imaging of a ruptured thin-cap fibroatheroma. (A) Coronary angiography of the left circumflex coronary artery. (B) 2-dimensional map of NIRAF signal. (C–E) Cross sectional OCT—NIRAF images showing a rupture of a thin fibrous cap covered with a small thrombus. The rupture site shows high NIRAF. (F,G) Magnified views revealing a cholesterol crystal (F, arrow), thrombus (G, arrows) and the rupture site (H, arrow). All colocalized with elevated NIRAF. (I) 3-dimensional rendered map demonstrating that the high NIRAF signal appears within regions containing high amount of lipids (arrow). The asterisk (*) corresponds with catheter artefact. L, lipid; R, rupture site; T, thrombus. Reused with permission from Ughi et al. (122).

References

    1. Vasan RS, Enserro DM, Xanthakis V, Beiser AS, Seshadri S. Temporal trends in the remaining lifetime risk of cardiovascular disease among middle-aged adults across 6 decades: the framingham study. Circulation. (2022) 145(17):1324–38. 10.1161/CIRCULATIONAHA.121.057889 - DOI - PMC - PubMed
    1. Roth GA, Huffman MD, Moran AE, Feigin V, Mensah GA, Naghavi M, et al. Global and regional patterns in cardiovascular mortality from 1990 to 2013. Circulation. (2015) 132(17):1667–78. 10.1161/CIRCULATIONAHA.114.008720 - DOI - PubMed
    1. Global, regional, and national age-sex specific all-cause and cause-specific mortality for 240 causes of death, 1990–2013: a systematic analysis for the global burden of disease study 2013. Lancet. (2015) 385(9963):117–71. 10.1016/S0140-6736(14)61682-2 - DOI - PMC - PubMed
    1. Weber C, Noels H. Atherosclerosis: current pathogenesis and therapeutic options. Nat Med. (2011) 17(11):1410–22. 10.1038/nm.2538 - DOI - PubMed
    1. Naghavi M, Libby P, Falk E, Casscells SW, Litovsky S, Rumberger J, et al. From vulnerable plaque to vulnerable patient: a call for new definitions and risk assessment strategies: part I. Circulation. (2003) 108(14):1664–72. 10.1161/01.CIR.0000087480.94275.97 - DOI - PubMed

LinkOut - more resources