Prognostic and chemotherapeutic response prediction by proliferation essential gene signature: Investigating POLE2 in bladder cancer progression and cisplatin resistance
- PMID: 38370377
- PMCID: PMC10869977
- DOI: 10.7150/jca.93023
Prognostic and chemotherapeutic response prediction by proliferation essential gene signature: Investigating POLE2 in bladder cancer progression and cisplatin resistance
Abstract
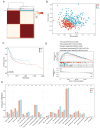
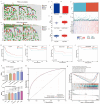
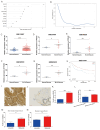
Background: Bladder cancer (BLCA) is the most common genitourinary malignancy. Proliferation essential genes (PEGs) are crucial to the survival of cancer cells. This study aimed to build a PEG signature to predict BLCA prognosis and treatment efficacy. Methods: BLCA PEGs and differentially expressed PEGs were identified using DepMap and TCGA-BLCA datasets, respectively. Based on the prognostic analysis of the differentially expressed PEGs, a PEG model was constructed. Subsequently, we analyzed the relationship between the PEG signature and prognosis of BLCA patients as well as their response to chemotherapy. Finally, we performed random forest analysis to target and functional experiments to validate the most significant PEG which is associated with BLCA progression. CCK-8, invasion, migration, and chemosensitivity assays were performed to assess effects of gene knockdown on BLCA cell proliferation, invasion and migration abilities, and cisplatin chemosensitivity. Results: We screened 10 prognostic PEGs from 201 differentially expressed PEGs and used them to construct a PEG signature model. Patients with high PEG signature score (PEGs-high) exhibited worse OS and lower sensitivity to chemotherapy than those with PEGs-low. We also found significant correlations between the PEG score and previously defined BLCA molecular subtypes. This suggests that the PEG score may effectively predict the molecular subtypes which have distinct clinical outcomes. Random forest analysis revealed that POLE2 (DNA polymerase epsilon subunit 2) was the most significant PEG differentiating BLCA tissue and normal tissue. Bioinformatic analysis and an immunohistochemistry staining assay confirmed that POLE2 was significantly up-regulated in tumor tissues and was associated with poor survival in BLCA patients. Moreover, POLE2 knockdown inhibited the ability of cell clone formation, proliferation, invasion, immigration and IC50 of cisplatin. Conclusion: The PEG signature acts as a potential predictor for prognosis and chemotherapy response in BLCA patients. POLE2 is a key PEG and plays a remarkable role in promoting the malignant progression and cisplatin resistance of BLCA.
Keywords: CRISPR-Cas9; POLE2; bioinformatic analysis; bladder cancer; proliferation; tumor promoter.
© The author(s).
Conflict of interest statement
Competing Interests: The authors have declared that no competing interest exists.
Figures


Similar articles
-
The Prognostic Hub Gene POLE2 Promotes BLCA Cell Growth via the PI3K/AKT Signaling Pathway.Comb Chem High Throughput Screen. 2024;27(13):1984-1998. doi: 10.2174/0113862073273633231113060429. Comb Chem High Throughput Screen. 2024. PMID: 38963027
-
Uncovering the potential functions of lymph node metastasis-associated aberrant methylation differentially expressed genes and their association with the immune infiltration and prognosis in bladder urothelial carcinoma.PeerJ. 2023 Apr 24;11:e15284. doi: 10.7717/peerj.15284. eCollection 2023. PeerJ. 2023. PMID: 37123010 Free PMC article.
-
TEAD4 functions as a prognostic biomarker and triggers EMT via PI3K/AKT pathway in bladder cancer.J Exp Clin Cancer Res. 2022 May 17;41(1):175. doi: 10.1186/s13046-022-02377-3. J Exp Clin Cancer Res. 2022. PMID: 35581606 Free PMC article.
-
Deciphering the immunological and prognostic features of bladder cancer through platinum-resistance-related genes analysis and identifying potential therapeutic target P4HB.Front Immunol. 2023 Sep 18;14:1253586. doi: 10.3389/fimmu.2023.1253586. eCollection 2023. Front Immunol. 2023. PMID: 37790935 Free PMC article.
-
A Novel Natural Killer Cell-related Gene Signature for Improving the Prediction of Prognosis and Immunotherapy Response in Bladder Cancer.Comb Chem High Throughput Screen. 2024;27(8):1205-1221. doi: 10.2174/1386207326666230831164358. Comb Chem High Throughput Screen. 2024. PMID: 37653625
Cited by
-
AMIGO2 expression at the invasive front of bladder cancer predicts recurrence-free and overall survival after radical cystectomy.Oncol Lett. 2025 May 13;30(1):339. doi: 10.3892/ol.2025.15085. eCollection 2025 Jul. Oncol Lett. 2025. PMID: 40421197 Free PMC article.
-
Deciphering a proliferation-essential gene signature based on CRISPR-Cas9 screening to predict prognosis and characterize the immune microenvironment in HNSCC.BMC Cancer. 2025 Apr 22;25(1):756. doi: 10.1186/s12885-025-14181-1. BMC Cancer. 2025. PMID: 40264050 Free PMC article.
-
CRISPR-Cas9 screening identifies a gene signature predictive of prognosis in glioblastoma.Sci Rep. 2025 Jul 1;15(1):21077. doi: 10.1038/s41598-025-07815-8. Sci Rep. 2025. PMID: 40594722 Free PMC article.
-
Assessing TGF-β Prognostic Model Predictions for Chemotherapy Response and Oncogenic Role of FKBP1A in Liver Cancer.Curr Pharm Des. 2024;30(39):3131-3152. doi: 10.2174/0113816128326151240820105525. Curr Pharm Des. 2024. PMID: 39185649
-
Establishment of a SUMO pathway related gene signature for predicting prognosis, chemotherapy response and investigating the role of EGR2 in bladder cancer.J Cancer. 2024 May 20;15(12):3841-3856. doi: 10.7150/jca.96481. eCollection 2024. J Cancer. 2024. PMID: 38911380 Free PMC article.
References
-
- Bray F, Ferlay J, Soerjomataram I, Siegel RL, Torre LA, Jemal A. Global cancer statistics 2018: GLOBOCAN estimates of incidence and mortality worldwide for 36 cancers in 185 countries. CA: a cancer journal for clinicians. 2018;68:394–424. - PubMed
-
- Lenis AT, Lec PM, Chamie K, Mshs MD. Bladder Cancer: A Review. JAMA. 2020;324:1980–91. - PubMed
-
- Ferlay J, Colombet M, Soerjomataram I, Parkin DM, Piñeros M, Znaor A, Cancer statistics for the year 2020: An overview. 2021; 149: 778-89. - PubMed
-
- Heney NM, Ahmed S, Flanagan MJ, Frable W, Corder MP, Hafermann MD. et al. Superficial bladder cancer: progression and recurrence. The Journal of urology. 1983;130:1083–6. - PubMed
LinkOut - more resources
Full Text Sources

