Bioinformatics and Integrative Experimental Method to Identifying and Validating Co-Expressed Ferroptosis-Related Genes in OA Articular Cartilage and Synovium
- PMID: 38370466
- PMCID: PMC10871044
- DOI: 10.2147/JIR.S434226
Bioinformatics and Integrative Experimental Method to Identifying and Validating Co-Expressed Ferroptosis-Related Genes in OA Articular Cartilage and Synovium
Abstract
Purpose: Osteoarthritis (OA) is the most common joint disease worldwide and is the primary cause of disability and chronic pain in older adults.Ferroptosis is a type of programmed cell death characterized by aberrant iron metabolism and reactive oxygen species accumulation; however, its role in OA is not known.
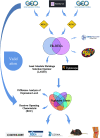
Methods: To identify ferroptosis markers co-expressed in articular cartilage and synovium samples from patients with OA, in silico analysis was performed.Signature genes were analyzed and the results were evaluated using a ROC curve prediction model.The biological function, correlation between Signature genes, immune cell infiltration, and ceRNA network analyses were performed. Signature genes and ferroptosis phenotypes were verified through in vivo animal experiments and clinical samples. The expression levels of non-coding RNAs in samples from patients with OA were determined using qRT-PCR. ceRNA network analysis results were confirmed using dual-luciferase assays.
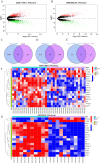
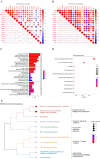
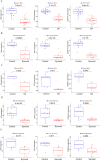
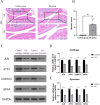
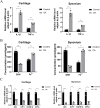
Results: JUN, ATF3, and CDKN1A were identified as OA- and ferroptosis-associated signature genes. GSEA analysis demonstrated an enrichment of these genes in immune and inflammatory responses, and amino acid metabolism. The CIBERSORT algorithm showed a negative correlation between T cells and these signature genes in the cartilage, and a positive correlation in the synovium. Moreover, RP5-894D12.5 and FAM95B1 regulated the expression of JUN, ATF3, and CDKN1A by competitively binding to miR-1972, miR-665, and miR-181a-2-3p. In vivo, GPX4 was downregulated in both OA cartilage and synovium; however, GPX4 and GSH were downregulated, while ferrous ions were upregulated in patient OA cartilage and synovium samples, indicating that ferroptosis was involved in the pathogenesis of OA. Furthermore, JUN, ATF3, and CDKN1A expression was downregulated in both mouse and human OA synovial and cartilage tissues. qRT-PCR demonstrated that miR-1972, RP5-894D12.5, and FAM95B1 were differentially expressed in OA tissues. Targeted interactions between miR-1972 and JUN, and a ceRNA regulatory mechanism between RP5-894D12.5, miR-1972, and JUN were confirmed by dual-luciferase assays.
Conclusion: This study identified JUN, ATF3, and CDKN1A as possible diagnostic biomarkers and therapeutic targets for joint synovitis and OA. Furthermore, our finding indicated that RP5-894D12.5/miR-1972/JUN was a potential ceRNA regulatory axis in OA, providing an insight into the connection between ferroptosis and OA.
Keywords: ATF3; CDKN1A; GPX4; JUN; bioinformatics; ferroptosis; osteoarthritis; synovitis.
© 2024 Ma et al.
Conflict of interest statement
The authors report no conflicts of interest in this work.
Figures






Similar articles
-
Exosomes from osteoarthritic fibroblast-like synoviocytes promote cartilage ferroptosis and damage via delivering microRNA-19b-3p to target SLC7A11 in osteoarthritis.Front Immunol. 2023 Aug 24;14:1181156. doi: 10.3389/fimmu.2023.1181156. eCollection 2023. Front Immunol. 2023. PMID: 37691947 Free PMC article.
-
Identification and verification of ferroptosis-related genes in the synovial tissue of osteoarthritis using bioinformatics analysis.Front Mol Biosci. 2022 Aug 29;9:992044. doi: 10.3389/fmolb.2022.992044. eCollection 2022. Front Mol Biosci. 2022. PMID: 36106017 Free PMC article.
-
Identification of a ferroptosis-related gene pair biomarker with immune infiltration landscapes in ischemic stroke: a bioinformatics-based comprehensive study.BMC Genomics. 2022 Jan 16;23(1):59. doi: 10.1186/s12864-022-08295-0. BMC Genomics. 2022. PMID: 35033021 Free PMC article.
-
JUN and ATF3 in Gout: Ferroptosis-related potential diagnostic biomarkers.Heliyon. 2024 Oct 30;10(22):e39957. doi: 10.1016/j.heliyon.2024.e39957. eCollection 2024 Nov 30. Heliyon. 2024. PMID: 39619595 Free PMC article. Review.
-
The Role of Ferroptosis in the Pathogenesis of Osteoarthritis.J Membr Biol. 2023 Jun;256(3):223-228. doi: 10.1007/s00232-023-00282-0. Epub 2023 Mar 15. J Membr Biol. 2023. PMID: 36920529 Review.
Cited by
-
Mechanisms and Therapeutic Potential of GPX4 in Pain Modulation.Pain Ther. 2025 Feb;14(1):21-45. doi: 10.1007/s40122-024-00673-8. Epub 2024 Nov 6. Pain Ther. 2025. PMID: 39503961 Free PMC article. Review.
-
Development and Validation of Diagnostic Models for Transcriptomic Signature Genes for Multiple Tissues in Osteoarthritis.J Inflamm Res. 2024 Jul 31;17:5113-5127. doi: 10.2147/JIR.S472118. eCollection 2024. J Inflamm Res. 2024. PMID: 39099665 Free PMC article.
-
Regulation of ferroptosis in osteoarthritis and osteoarthritic chondrocytes by typical MicroRNAs in chondrocytes.Front Med (Lausanne). 2024 Nov 5;11:1478153. doi: 10.3389/fmed.2024.1478153. eCollection 2024. Front Med (Lausanne). 2024. PMID: 39564502 Free PMC article. Review.
References
LinkOut - more resources
Full Text Sources
Miscellaneous

