[Preprint]. 2024 Feb 8:2024.02.04.578798.
doi: 10.1101/2024.02.04.578798.

Broad de-regulated U2AF1 splicing is prognostic and augments leukemic transformation via protein arginine methyltransferase activation

Affiliations

Broad de-regulated U2AF1 splicing is prognostic and augments leukemic transformation via protein arginine methyltransferase activation

Meenakshi Venkatasubramanian et al. bioRxiv. .

Update in

  • Splicing regulatory dynamics for precision analysis and treatment of heterogeneous leukemias.
    Venkatasubramanian M, Schwartz L, Ramachandra N, Bennett J, Subramanian KR, Chen X, Gordon-Mitchell S, Fromowitz A, Pradhan K, Shechter D, Sahu S, Heiser D, Scherle P, Chetal K, Kulkarni A, Lee D, Zhou J, Myers KC, Tseng E, Weirauch MT, Grimes HL, Starczynowski DT, Verma A, Salomonis N. Venkatasubramanian M, et al. Sci Transl Med. 2025 May 7;17(797):eadr1471. doi: 10.1126/scitranslmed.adr1471. Epub 2025 May 7. Sci Transl Med. 2025. PMID: 40333990 Free PMC article.

Abstract

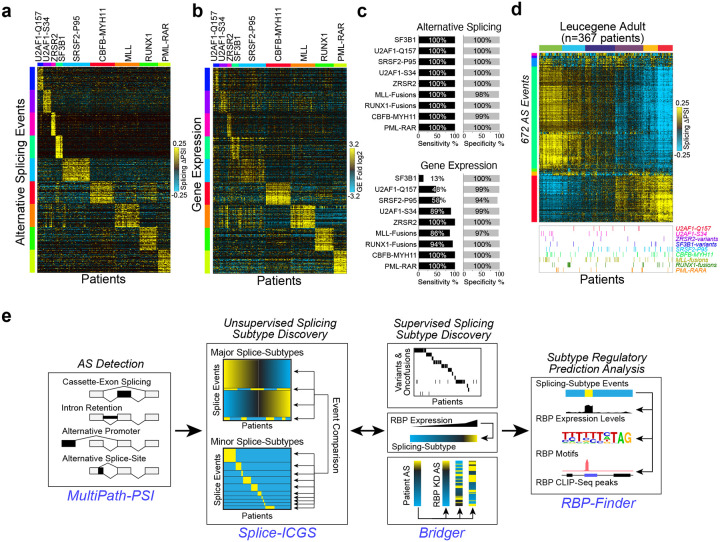
The role of splicing dysregulation in cancer is underscored by splicing factor mutations; however, its impact in the absence of such rare mutations is poorly understood. To reveal complex patient subtypes and putative regulators of pathogenic splicing in Acute Myeloid Leukemia (AML), we developed a new approach called OncoSplice. Among diverse new subtypes, OncoSplice identified a biphasic poor prognosis signature that partially phenocopies U2AF1-mutant splicing, impacting thousands of genes in over 40% of adult and pediatric AML cases. U2AF1-like splicing co-opted a healthy circadian splicing program, was stable over time and induced a leukemia stem cell (LSC) program. Pharmacological inhibition of the implicated U2AF1-like splicing regulator, PRMT5, rescued leukemia mis-splicing and inhibited leukemic cell growth. Genetic deletion of IRAK4, a common target of U2AF1-like and PRMT5 treated cells, blocked leukemia development in xenograft models and induced differentiation. These analyses reveal a new prognostic alternative-splicing mechanism in malignancy, independent of splicing-factor mutations.


Conflict of interest statement

Conflict-of-interest disclosure: DTS. serves on the scientific advisory board at Kurome Therapeutics; is a consultant for and/or received funding from Kurome Therapeutics, Captor Therapeutics, Treeline Biosciences, and Tolero Therapeutics; and has equity in Kurome Therapeutics. AV has received research funding from GlaxoSmithKline, BMS, Jannsen, Incyte, MedPacto, Celgene, Novartis, Curis, Prelude and Eli Lilly and Company, has received compensation as a scientific advisor to Novartis, Stelexis Therapeutics, Acceleron Pharma, and Celgene, and has equity ownership in Throws Exception and Stelexis Therapeutics.

Figures

Figure 1.
Figure 1.. Mutation-defined splicing is largely obscured in leukemia.
a,b) Heatmap of top marker splicing events (a) and differentially expressed genes (b) in AML (Leucegene RNA-Seq) for a subset of patients and common splicing factor mutations/fusions (n=142, traininig). c) Relative ability of splicing versus gene expression to accurately classify AML patient genetics (n=200), based on 3-fold cross-validation (SVM, one vs. rest). Columns=patients, Rows=events/genes. Delta PSI=relative difference in Percent Spliced In (PSI) values. d) Heatmap of alternative splicing-patterns identified in Leucegene RNA-Seq, identified using a single-cell analysis clustering algorithm (ICGS). a) Cartoon of the OncoSplice computational workflow to define new splicing subtypes and mechanisms of gene regulation from RNA-Seq. These steps consist of: 1) splicing quantification, 2) unsupervised subtype discovery, 3) supervised subtype identification (genetics, multi-factor splicing event correlation) and 4) RNA-regulatory splicing-subtype prediction based on RBP expression, binding sites and CLIP-Seq data.
Figure 2.
Figure 2.. OncoSplice uncovers genetically heterogenous subtypes AML.
a) OncoSplice-defined AML subtypes with coincident cancer genomic variants in 367 adult AML samples (yellow=subtype assigned patient) (ED Table 1). Previously-defined AML subtypes (top panel) and novel OncoSplice-defined subtypes (bottom panel), annotated for RNA-Seq-detected genomic variants, oncofusions, deletions or structural rearrangements (bold=splice-ICGS reported). For the top panel, final subtypes were revised according to known patient genetics (Supplementary Methods – Section 7). Note that U2AF1-like and SRSF2-like splicing subtypes co-occur with other splicing subtypes. b) Heatmap of concordant splicing events between OncoSplice-defined subtypes. Hierarchical clustering of the percentage of overlapping splicing events between all pairs of AML subtypes (regulated in the same direction) are shown (black=high percentage, white=low). Clusters of samples dominated by U2AF1 (U2AF1-like or U2AF1 mutation), SRSF2 (SRSF2-like or SRSF2 mutation) or NPM1/FLT3-ITD are labeled (right). c) For major OncoSplice-defined subtypes the number of differentially-expressed genes (DEGs) and unique alternative-splicing events (AS) are shown. Subtypes are grouped into those principally defined by AS (left), AS and DEGs (middle) or DEGs (right). The potentially confounding effect of U2AF1-like and SRSF2-like splicing events has been removed from the other subtypes. d) Splicing example: SashimiPlot of CASP9 splicing in a U2AF1-like and an SRSF2-like patient sample (top). SashimiPlot lines between exons indicate junctions and numbers indicate junction-read counts. The alternative splice event results in predicted CASP9 protein isoforms (bottom) including the pro-apoptotic long CASP9a isoform and the short CASP9b isoform, which lacks the peptidase domain (ExonPlot view AltAnalyze). e) Annotation of the frequency of MultiPath-PSI-defined splice-event types (defined below) associated with each AML subtype (denoted to the left). f) Annotation of the AltAnalyze-predicted impact of splice events on protein domain and protein length in each AML subtype (denoted to the left).
Figure 3.
Figure 3.. U2AF1-like splicing partially phenocopies mutation engendered splicing dysfunction.
a) splice-ICGS reveals broadly-deregulated splicing in the majority of AML patients. The white boxes indicate 1) RNA-Seq samples with U2AF1-S34 mutations and U2AF1-like splicing and 2) samples with SRSF2-P95 mutations and SRSF2-like splicing. b). Heatmap showing splicing events enriched (p-value <0.05, FDR adjusted and δPSI =0.1) in adult AML with splicing factor mutations (U2AF1-S34, SRSF2-P95, SF3B1, U2AF1-Q157). This supervised analysis identifies the coincidence of U2AF1-S34 and SRSF2-P95 splicing events with U2AF1-like and SRSF2-like, respectively (white boxes). c) Venn diagram displaying AML-subtype-associated splicing events (MultiPath-PSI) reveals the partial overlap between broadly deregulated and mutation-associated splicing patterns (U2AF1-S34 and U2AF1-like; SRSF2-P95 and SRSF2-like). d) Weblogo analysis of U2AF1 binding-site preferences at the e-3 splice-site position for cassette-exon splicing events. U2AF1-S34-specific spliced cassette-exons are those not also significant in U2AF1-like, while U2AF1-like cassette-exons are the inverse. e) The number of cassette exon events included and excluded for all U2AF1-S34 and all U2AF1-like events are shown for each binding site preference. f) Kaplan-Meier curves for overall survival in patients from TCGA AML (top) and TARGET AML (bottom) with associated coxph p-values (left: all splice-ICGS stringently classified U2AF1-like versus all other considered AMLs. Analysis of TCGA was restricted to cytogenetically normal AMLs with no RNA binding protein (RBP) mutations and under 60 years of age. g) Distribution of AML cell-line aggregate CRISPR-screen scores (CSS) of 287 genes corresponding to U2AF1-like splicing events (common pediatric and adult) that are significantly associated with poor overall survival compared to all CSS genes. A Wilcoxon rank sum p-value (two-sided) was computed for the comparison of CSS between these two groups. h,i) Select poor-survival associated splicing events in U2AF1-like patients and mutation-associated splicing. Example sample SashimiPlots (h) and violin plots of PSI values for all patients (i). j) Violin plot displaying the PSI distribution for previously identified U2AF1-S34 or SRSF2-P95 splicing events in U2AF1- and SRSF2-like patients. in=inclusion exon, ex=exclusion exon.
Figure 4.
Figure 4.. U2AF1-like splicing is mediated by PRMT5 and WDR77 expression.
a) U2AF1-like splicing status in a prior relapse cohort of matched AML samples at diagnosis (blue dot) and relapse (pink triangle). The U2AF1-score is calculated from the aggregate of 364 poor survival-associated U2AF1-like inclusion versus exclusion ΔPSI splicing event values for each patient. Classification of AML samples as U2AF1-like, SRSF2-like, or Other are based on the range of scores produced for Leucegene patients assigned by splice-ICGS. Prior annotated epigenetic subtypes (eloci) are indicated (below). b) U2AF1-like splicing status in AML patients from with multi-timepoint sampling in the BEAT-AML RNA-Seq cohort. c) Heatmap of the top marker genes (MarkerFinder) distinct human hematopeoitc stem and progenitor populations isolated by Fluorescence-Activated Cell Sorting (FACS) (BluePrint consortium). d) U2AF1-like scores in the BluePrint RNA-Seq segregate by donor rather than cell-type. e) Scatter plot comparing gene expression for 3,574 commonly differentially expressed genes between U2AF1-like and SRSF2-like samples matched in the AML and healthy donor datasets (eBayes t-test p<0.05 (two-sided)). Select transcription factor, splicing regulator and circadian regulators are denoted. f) Top-associated U2AF1-like splicing factors, by comparing gene expression and splicing (Pearson correlation). Correlation values are shown in the upper right quadrants. Scatter plots (lower left quadrants) illustrate the pairwise expression value of the indicated factors. g) AML cell-line CRISPR-screen scores (CSS) for RBPs associated with U2AF1-like or SRSF2-like splicing from gene expression or knockdown signature analyses compared to all RBPs. h) The extent of splicing concordance (similarity index) between Leucgene AML U2AF1-like splice events to RBP knockdown (KD) or over-expression (OE) (n=77) in the indicated cell lines. i) Heatmap of all AML U2AF1-like significant splicing events overlaping to shRNA KD of U2AF1 in K562 cells (ENCODE). j) Concordance between AML U2AF1-like splice events with cell-type and hematological malignancy specific splicing programs. k) Heatmap of all AML U2AF1-like significant splicing events overlapping with PRMT5 inhibitor treated MDS-L cell RNA-Seq. l) SashimiPlot of the IRAK4 gene locus in PRMT5 inhibitor treated and control MDS-L cell RNA-Seq (prior annotated Exon 4 (denoted E6 in AltAnalyze)).
Figure 5:
Figure 5:. Treatment with PRMT5 inhibitor PRT543 via targeting of IRAK4 leads to increased myeloid differentiation and impaired MDS/AML progenitor cell function.
a) Western blot of IRAK4-L (long isoform) in MDSL cells following 72 hours of treatment with the PRMT5 inhibitor (PRT543) at 30nM, 100nM and 300nM. b) NF-kB reporter activity in THP1-Blue NF-kB cells with increasing doses of the PRMT5 inhibitor (PRT543). c) Cell viability in MDSL cells with increasing concentrations of PRT543 50nM, 100nM and 300nM as compared to control. d) MDSL were treated with PRT543 300nM every 72 hours as compared to control and myeloid differentiation assessed on days 21. Statistically significant differentiation occurred in the treated cell population as compared to control at day 21 for CD14 + CD11b. (N=3, P <0.01). e) Representative images of Giemsa stained MDSL cells alone and those treated with PRMT5 inhibitor (PRT543) at 300nM treatment for 72 hours. The red arrow identifies evidence of differentiated myeloid cells with red arrowhead showing evidence of increased vacuolization, consistent with myeloid maturation/differentiation. f-h) MDS patient samples treated with PRMT5i and control for 14 days in clonogenic assays and then assessed for myeloid and erythroid differentiation by FACS. i) Colony formation in isogenic WT and IRAK4KO THP1 and MDSL cell lines (two independent experiments). j) Kaplan Meier survival analysis of NSGS mice (n = 5 mice/group) engrafted with WT or IRAK4KO THP1 or MDSL cells (Data represent one of two independent experiments with similar trends). k) Immunophenotyping of the indicated cells for CD38 and CD14 expression, respectively.

References

    1. Nilsen T.W. & Graveley B.R. Expansion of the eukaryotic proteome by alternative splicing. Nature 463, 457–63 (2010). - PMC - PubMed
    1. Park S.M. et al. U2AF35(S34F) Promotes Transformation by Directing Aberrant ATG7 Prem-RNA 3’ End Formation. Mol Cell 62, 479–90 (2016). - PMC - PubMed
    1. Oudin M.J. et al. Characterization of the expression of the pro-metastatic Mena(INV) isoform during breast tumor progression. Clin Exp Metastasis 33, 249–61 (2016). - PMC - PubMed
    1. Calabretta S. et al. Modulation of PKM alternative splicing by PTBP1 promotes gemcitabine resistance in pancreatic cancer cells. Oncogene 35, 2031–9 (2016). - PMC - PubMed
    1. Zhang S.J. et al. Genetic analysis of patients with leukemic transformation of myeloproliferative neoplasms shows recurrent SRSF2 mutations that are associated with adverse outcome. Blood 119, 4480–5 (2012). - PMC - PubMed

Publication types