[Preprint]. 2025 Feb 15:2024.02.06.579223.
doi: 10.1101/2024.02.06.579223.

T-cells specific for KSHV and HIV migrate to Kaposi sarcoma tumors and persist over time

Affiliations

T-cells specific for KSHV and HIV migrate to Kaposi sarcoma tumors and persist over time

Shashidhar Ravishankar et al. bioRxiv. .

Abstract

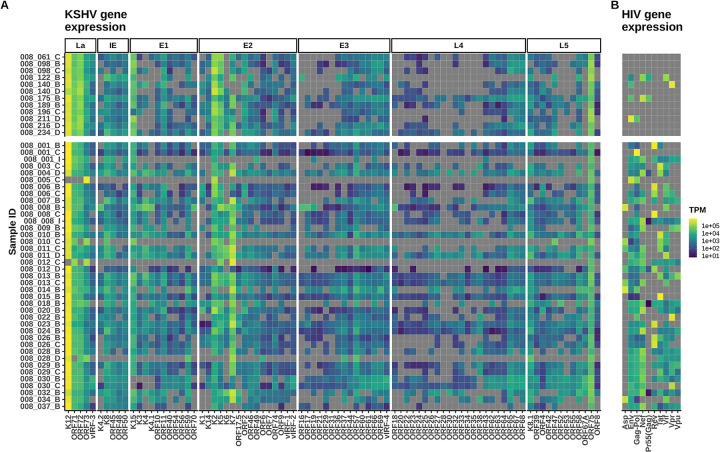
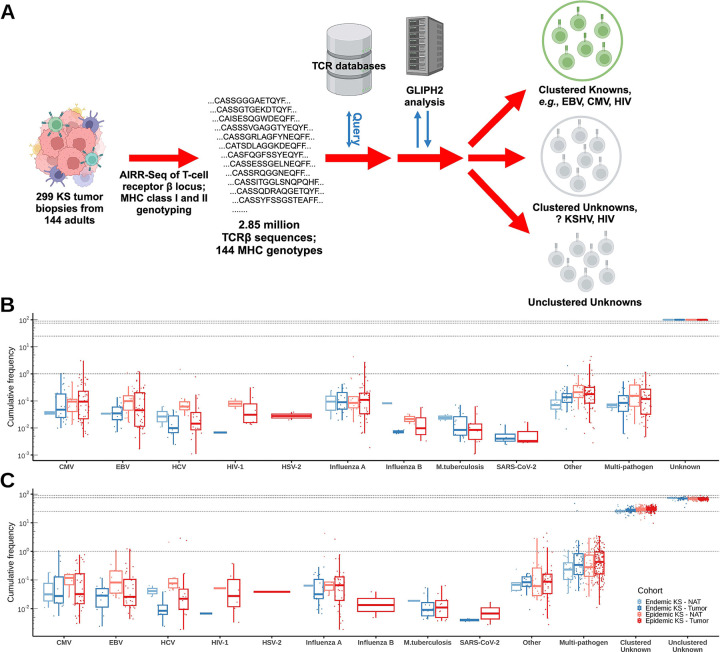
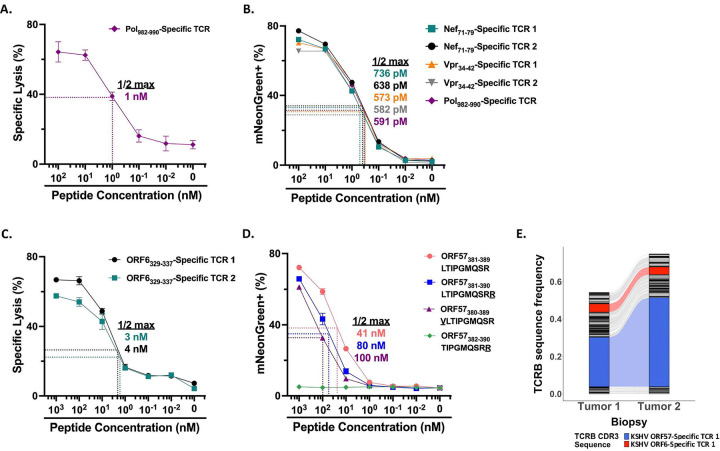
Kaposi sarcoma-associated herpesvirus (KSHV) is the etiologic agent of Kaposi sarcoma (KS), which causes significant morbidity and mortality worldwide, particularly in people living with HIV (PLWH) and in sub-Saharan Africa where KSHV seroprevalence is high. Postulating that T-cells specific for KSHV and HIV would be attracted to KS tumors, we performed transcriptional profiling and T-cell receptor (TCR) repertoire analysis of tumor biopsies from 144 Ugandan adults with KS, 106 of whom were also living with HIV. We show that CD8+ T-cells and M2-polarized macrophages are the most common immune cells in KS tumors. The TCR repertoire of T-cells associated with KS tumors is shared across spatially and temporally distinct tumors from the same individual. Clusters of T-cells with predicted shared specificity for uncharacterized antigens, potentially encoded by KSHV or HIV, comprise ~25% of the T-cells in KS tumors. Single-cell RNA-sequencing of blood from a subset of 9 adults captured 4,283 unique αβ TCRs carried in 14,698 putative KSHV- or HIV-specific T-cells, which carried an antigen-experienced effector phenotype. T-cells engineered to express a representative sample of these TCRs showed high-avidity recognition of KSHV- or HIV-encoded antigens. These results suggest that a poly-specific, high-avidity KSHV- and HIV-specific T-cell response, potentially inhibited by M2 macrophages, migrates to and localizes with KS tumors. Further analysis of KSHV- and HIV-specific T-cells in KS tumors will provide insight into the pathogenesis of KS and could guide the development of specific immune therapy based on adoptive transfer or vaccination.


Conflict of interest statement

Conflict of Interest The authors declare that the research was conducted in the absence of any commercial or financial relationships that could create a conflict of interest.

Figures

Figure 1:
Figure 1:. RNA-seq confirms expression of KSHV and HIV genes in KS tumors.
(A) KSHV gene expression in 12 endemic (top) and 39 epidemic (bottom) KS tumors. Latent (La), Immediate early (IE), Early lytic stage 1 (E1), Early lytic stage 2 (E2), Early lytic stage 3 (E3), Late lytic stage 4 (L4), and Late lytic stage 5 (L5). (B) Expression of HIV genes across all 51 KS tumors.
Figure 2:
Figure 2:. KS tumors show an enrichment of M2 macrophages and CD8+ T-cells in comparison to control skin samples.
(A) Heatmap of relative abundance of the indicated immune cell types found in KS tumors and skin samples from individuals with KS as well as control skin samples from the GTEx consortium, determined via deconvolution of RNA-seq data using CIBERSORTx. The RNA-seq datasets analyzed were derived from (left to right) 12 endemic and 39 epidemic KS tumors from the HIPPOS cohort from Uganda, 3 control skin samples, 24 paired NAT and KS tumor samples from 6 individuals with endemic KS and 18 individuals with epidemic KS from (4); 4 paired NAT and tumor samples from individuals with epidemic KS from (3); and 30 non-sun-exposed control skin samples and 30 sun-exposed control skin samples from the GTEx consortium (6). (B) Box and whisker plots showing the mean and interquartile range (IQR) of the percentages of M2 macrophages, activated CD4+ memory T-cells, resting CD4+ memory T-cells, and CD8+ T-cells, as estimated using CIBERSORTx, in the endemic (blue) and epidemic (red) KS tumors in (A). The upper/lower whiskers extend from the hinge to the largest/smallest value, respectively, no further than 1.5 * IQR from the hinge. Significance between comparisons is indicated by ns (p > 0.05), ** (p<= 0.01), *** (p<= 0.001), **** (p <= 0.0001).
Figure 3:
Figure 3:. Diversity of infiltrating T-cells is higher in endemic than in epidemic KS tumors.
(A, B, C, D, E) Rényi entropy (RE) comparisons, at different values of α, across tissue samples: epidemic KS – NAT (Pink), epidemic KS – tumor (Red), endemic KS – NAT (Light blue), endemic KS – tumor (Blue), Burkitt lymphoma (BL) tumors from Ghana (Yellow), and BL tumors from Uganda (Brown). (A) Species richness (RE α = 0) and (B) Shannon entropy (RE α = 1) are metrics influenced by the number of unique T-cells found in the repertoire. (C) Simpson’s diversity (RE α = 2) and (D) Berger-Parker index (α = ∞) are metrics that are influenced by expanded T-cell clones in the repertoire. (E) Rényi diversity profiles for all six cohorts show the variation in repertoire diversity with change in α. Significance between comparisons is indicated by ns (p > 0.05), * (p <= 0.05), ** (p<= 0.01), *** (p<= 0.001), **** (p <= 0.0001).
Figure 4:
Figure 4:. Clusters of T-cells with predicted similar or identical specificity for unknown antigens comprise 25% of the T-cell repertoire in KS tumors.
(A) Overview of analytic pipeline of TCR β chain sequences generated from AIRR-seq of 299 KS tumors and from 144 individuals, showing the assignment after GLIPH2 analysis to Clustered Known, Clustered Unknown, or Unclustered Unknown subsets. (B) Mean and interquartile range of the frequency of TCR β chain sequences in the TCR repertoires of individual KS tumors that are listed in VDJdb or the McPAS-TCR database as being associated with a T-cell response to a specific pathogen or tissue antigen, classified according to pathogen and endemic (blue) or epidemic (red) KS. Sequences listed in these databases as being associated with a T-cell response to two or more pathogens are listed as “Multi-pathogen.” (C) Mean and interquartile range of the frequency of TCR β chain sequences assigned by GLIPH2 to antigenic specificity groups associated with T-cell responses to the pathogens in B. The frequency of sequences assigned to Clustered Unknown or Unclustered Unknown antigenic specificity groups is indicated at the far right.
Figure 5:
Figure 5:. T-cells from GLIPH2-defined clusters with specificity for unknown antigens persist in the KS TME across time and space in individuals with epidemic and endemic KS.
(A, B) Alluvial plots of the 500 most frequent T-cell receptor β chain sequences observed in tumor samples obtained from different locations on the body surface and at different time points in two representative individuals with (A) endemic KS and (B) epidemic KS. Highlighted are persistent TCR β chain CDR3 sequences from GLIPH2-defined “clustered unknown” antigenic specificity groups in endemic (blue) or epidemic (red) KS lesions. Colored dots on the body figures above each alluvial plot denote the sites from which each tissue sample was collected and are reproduced below the corresponding column containing the repertoire data for that tissue sample.
Figure 6:
Figure 6:. T-cells in “clustered unknown” antigenic specificity groups are primarily CD8+ effector memory cells.
(A) Cell type classification using Celltypist (14, 15) of 61,763 cells carrying a productive αβ TCR from 20 single-cell gene expression and TCR VDJ libraries generated from PBMCs from 9 individuals with KS (4 endemic and 5 epidemic). (B) Cell type classification of the subset of 14,698 T-cells carrying a productive αβ TCR that were assigned to “clustered unknown” antigenic specificity groups by GLIPH2. (C, D) Integrated single-cell UMAP incorporating cell type classification of (C) 6,511 clustered unknown T-cells from the 5 individuals with epidemic KS and (D) 8,187 clustered unknown T-cells from the 4 individuals with endemic KS. (E-H) Gene expression profiles from the integrated single-cell UMAP of 14,698 T-cells carrying clustered unknown TCRs for GZMB, PRF1, IFNG, and KLRG1.
Figure 7:
Figure 7:. TCRs from clustered known and clustered unknown antigenic specificity groups recognize KSHV- and HIV-encoded antigens with high avidity.
(A) Cytotoxicity of primary CD8+ T-cells transduced with an αβ TCR specific for HIV Pol982–990/HLA-B*42:01 against HLA-B*42:01+ EBV-transformed B-cells (EBV-LCL) pulsed with serial dilutions of HIV Pol982–990 peptide in a standard 4-hour 51Cr release assay. (B) Flow cytometric analysis of NeonGreen expression in Jurkat reporter T-cells transduced with αβ TCRs specific for HIV Nef71–79/HLA-B*42:01, HIV Vpr34–42/HLA-B*42:01, or HIV Pol982–990/HLA-B*42:01 after 16-hour co-culture with HLA-B*42:01+ EBV-LCL pulsed with the corresponding peptides at the indicated concentrations. (C) Cytotoxicity of primary CD8+ T-cells transduced with either of two related clustered unknown αβ TCRs against HLA-B*45:01+ EBV-LCL pulsed with serial dilutions of KSHV ORF6329–337 peptide in a 4-hour 51Cr release assay. (D) Flow cytometric analysis of NeonGreen expression in Jurkat reporter T-cells transduced with a clustered unknown αβ TCR after 16-hour co-culture with HLA-A*66:01+ EBV-LCL pulsed with serial dilutions of KSHV ORF57381–389, ORF57381–390, ORF57380–389, and ORF57382–390 peptides. (E) Alluvial plot of the 100 most frequent TCR β chain sequences in two non-contiguous KS tumors from HIV-seronegative HIPPOS participant 008_098. The red and blue-highlighted rivulets identify the TCR β chain sequences carried in the ORF6329–337- and ORF57381–389-specific TCRs featured in (C) and (D), respectively.

Similar articles

Cited by

  • Single-Cell Transcriptomic Analysis of Kaposi Sarcoma.
    Rauch DA, Ramos PV, Khanfar M, Harding J, Joseph A, Fahad A, Simonson P, Risch I, Griffith O, Griffith M, Ratner L. Rauch DA, et al. PLoS Pathog. 2025 Apr 1;21(4):e1012233. doi: 10.1371/journal.ppat.1012233. eCollection 2025 Apr. PLoS Pathog. 2025. PMID: 40168402 Free PMC article.

References

    1. Ibrahim Khalil A, Franceschi S, de Martel C, Bray F, Clifford GM. Burden of Kaposi sarcoma according to HIV status: A systematic review and global analysis. Int J Cancer. 2022;150(12):1948–57. - PubMed
    1. Rose TM, Bruce AG, Barcy S, Fitzgibbon M, Matsumoto LR, Ikoma M, et al. Quantitative RNAseq analysis of Ugandan KS tumors reveals KSHV gene expression dominated by transcription from the LTd downstream latency promoter. PLoS Pathog. 2018;14(12):e1007441. - PMC - PubMed
    1. Tso FY, Kossenkov AV, Lidenge SJ, Ngalamika O, Ngowi JR, Mwaiselage J, et al. RNA-Seq of Kaposi’s sarcoma reveals alterations in glucose and lipid metabolism. PLoS Pathog. 2018;14(1):e1006844. - PMC - PubMed
    1. Lidenge SJ, Kossenkov AV, Tso FY, Wickramasinghe J, Privatt SR, Ngalamika O, et al. Comparative transcriptome analysis of endemic and epidemic Kaposi’s sarcoma (KS) lesions and the secondary role of HIV-1 in KS pathogenesis. PLoS Pathog. 2020;16(7):e1008681. - PMC - PubMed
    1. Newman AM, Steen CB, Liu CL, Gentles AJ, Chaudhuri AA, Scherer F, et al. Determining cell type abundance and expression from bulk tissues with digital cytometry. Nat Biotechnol. 2019;37(7):773–82. - PMC - PubMed

Publication types