[Preprint]. 2024 Feb 8:2024.02.07.579278.
doi: 10.1101/2024.02.07.579278.

A meta-analysis of the gut microbiome in inflammatory bowel disease patients identifies disease-associated small molecules

Affiliations

A meta-analysis of the gut microbiome in inflammatory bowel disease patients identifies disease-associated small molecules

Moamen M Elmassry et al. bioRxiv. .

Update in

Abstract

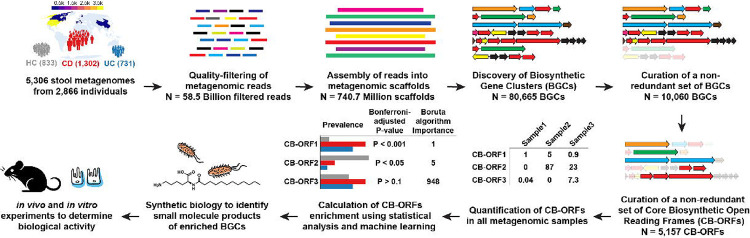
Changes in the gut microbiome have been associated with several human diseases, but the molecular and functional details underlying these associations remain largely unknown. Here, we performed a multi-cohort analysis of small molecule biosynthetic gene clusters (BGCs) in 5,306 metagenomic samples of the gut microbiome from 2,033 Inflammatory Bowel Disease (IBD) patients and 833 matched healthy subjects and identified a group of Clostridia-derived BGCs that are significantly associated with IBD. Using synthetic biology, we discovered and solved the structures of six fatty acid amides as the products of the IBD-enriched BGCs. Using two mouse models of colitis, we show that the discovered small molecules disrupt gut permeability and exacerbate inflammation in chemically and genetically susceptible mice. These findings suggest that microbiome-derived small molecules may play a role in the etiology of IBD and represent a generalizable approach for discovering molecular mediators of microbiome-host interactions in the context of microbiome-associated diseases.


Conflict of interest statement

Declaration of Interests M.S.D. is a Scientific Co-Founder and CSO at Pragma Biosciences.

Figures

Figure 1.
Figure 1.. A systematic analysis workflow to identify disease-associated small molecules.
A meta-analysis of stool metagenomes from IBD cohorts originating from several geographical regions. The heatmap indicates the number of samples per country. Numbers per IBD sub-cohort (Healthy controls, HC; Crohn’s Disease, CD; or Ulcerative Colitis, UC) indicate the number of subjects included in the analysis. Details of each step are described in the main text and Methods.
Figure 2.
Figure 2.. Discovery of IBD-associated small molecule BGCs.
(A) Number of detected small molecule BGCs in gut metagenomes from healthy and diseased subjects. Statistical significance was determined using Kruskal-Wallis test followed by Dunn’s multiple comparison test and Bonferroni correction. (B) A stacked bar plot showing the distribution of all identified small molecule BGCs (grouped by chemical class) in deeply sequenced samples, faceted by health and disease states. (C) A stacked bar plot showing the distribution of all identified small molecule BGCs based on the taxonomy of their organism of origin (displayed at the Phylum level) and grouped by their respective chemical class. The category “Other” includes the following Phyla: Fusobacteria, Verrucomicrobia, Euryarchaeota, and Ascomycota (as well as phages). BGCs that did not match to any reference genome in our analysis are labeled as “Unassigned”. (D) A Bar plot showing the number of BGCs that are enriched or depleted between healthy and disease states. Two-samples proportion z-test followed by Bonferroni correction was used for calculating statistical significance, with P ≤ 0.01 and absolute prevalence difference ≥ 10 as cutoffs. The middle bar labeled as “Shared” indicates the number of BGCs that are commonly detected as statistically significant in both IBD subtypes. (E) A volcano plot of CB-ORFs and their prevalence enrichment statistics between HC and CD. Two-samples proportion z-test followed by Bonferroni correction was used to calculate statistical significance. CB-ORFs with P ≤ 0.01 and absolute prevalence difference ≥ 10 are highlighted (red if enriched in CD and dark grey if depleted in CD, i.e., enriched in HC). The shape of the points indicates whether a CB-ORF was determined to be important for classification in the machine learning model, based on Boruta algorithm importance. Top enriched CB-ORFs belonging to ebf and ecf are labelled and the red numbers shown to their right indicate their rank based on Boruta algorithm importance among CB-ORFs enriched in CD. A few of the CD-enriched CB-ORFs belonged to previously characterized BGCs. A single CB-ORF of those BGCs is labeled with their corresponding small molecule products. (F–G) A random forest machine learning algorithm trained using CB-ORF abundance profiles of 80% of the samples (456 HC and 862 CD), then tested on never-seen 20% of the samples (112 HC and 218 CD) is able to classify CD and HC samples with high performance (Methods). Receiver operating characteristic (ROC) and precision-recall (PR) curves are plotted, and their area under the curve (AUC) values are shown (0.957 and 0.970, respectively). See Data S1 for the results of a five-fold cross-validation method used to evaluate the performance of the classifier model. All analyses were performed at the level of CB-ORFs, except for panels A, B, and D: due to the fact that a CB-ORF can be present in several BGCs, and to avoid inflating the number of detected or enriched BGCs, we computed representative BGCs per CB-ORFs for the purposes of plotting and calculating enrichment in these figures (and relevant text) (Methods).
Figure 3.
Figure 3.. Clostridia-derived ebf and ecf are enriched and frequently transcribed in the gut microbiome of IBD patients.
(A) Prevalence of Clostridia-derived ebf and ecf across HC and IBD (CD and UC) patients. In cases where multiple samples per subject are available, a given subject was deemed “positive” for ebf or ecf presence if either of the two BGCs was detected in any metagenomic sample from the same subject. Two-samples proportion z-test was used to determine statistical significance, followed by Bonferroni correction. (B) Abundance of ebf and ecf in HC, CD and UC patients. Data are presented as boxen (aka letter-value) plot to show distribution with black lines representing the median. Kruskal-Wallis test followed by Dunn’s multiple comparison test and further corrected by Bonferroni method was used to determine statistical significance. In cases where multiple samples per subject are available, the average abundance across samples from the same subject is shown. A pseudo-count of 0.001 was added to all values before plotting. (C) Rainforest plot showing effect sizes with confidence intervals of ebf and ecf enrichment per country. In cases where multiple samples per subject are available, the average abundance across samples from the same subject was used in this analysis. Effect sizes were calculated using a meta-analysis of log ratio of means. A positive shift in effect size indicates enrichment in CD patients, while a negative shift indicates enrichment in HC (or depletion in CD). Random effects model was applied because of study heterogeneity for ebf (P = 0.0007, I2 = 88.4%, τ2 = 1.5 Cochran’s Q = 23.5) and ecf (P = 0.0005, I2 = 88.3%, τ2 = 1.9, Cochran’s Q = 22.8). (D) Prevalence of ebf and ecf transcription across HC, CD, and UC subjects from samples that had paired metagenomic and metatranscriptomic sequencing data available. In cases where multiple samples per subject are available, a given subject was deemed “positive” for ebf or ecf transcription if either of the two BGCs was detected in any metatranscriptomic sample from the same subject. Two-samples proportion z-test was used to determine statistical significance, followed by Bonferroni correction. (E) Abundance of ebf and ecf in paired metagenomic and metatranscriptomic samples. Only samples where RNA/DNA ratio ≥ 5 (for either ebf or ecf) are shown from the three sub-cohorts, and RNA/DNA ratios ≥ 10 are indicated by red squares (most of them exist in CD). A complete list of samples with associated DNA and RNA RPKM abundances is shown in Data S1.
Figure 4.
Figure 4.. Functional characterization of ebf and ecf and discovery of their small molecule products.
(A) Gene and domain architecture of ecf (E. clostridioformis) and ebf (E. bolteae). (B) Molecular structures of ebf-ecf-FAAs, the small molecule products of ebf and ecf. Extracted ion chromatograms (HPLC-HR-MS) for the indicated m/z, obtained from chemical extracts of E. coli expressing ecf (blue) or a control E. coli strain harboring an empty vector (black). MS peaks corresponding to the six discovered FAAs are present in the ecf expression line and not the empty vector control.
Figure 5.
Figure 5.. Only specific FAA BGCs are enriched in IBD.
A phylogenetic tree of 8,427 strains from the class Clostridia, with publicly available genomes from the RefSeq database. The tree was constructed using PhyloPhlAn, based on a set of 400 universal marker genes. Clostridium cluster XIVa clade is highlighted in red. Genomes with BGCs that are homologous to ebf and ecf are marked in the innermost layer of points, labeled as FAA-NRPSs, and colored by their percent identity to ebf as indicated in the color key at the top right. The two outermost layers indicate disease enrichment in CD and UC, colored by prevalence difference (CD or UC - HC) as indicated in the color key at the top left. BGCs with previously identified FAA products are connected to the name and molecular structure of their cognate FAA (Chang et al., 2021).
Figure 6.
Figure 6.. ebf-ecf-FAAs exacerbate disease in mouse models of colitis.
(A) Timeline for the DSS-induced colitis mouse model experiment. ecf+ indicates the group of mice colonized with E. coli expressing ecf, and ecf− indicates the group of mice colonized with E. coli harboring an empty vector control. (B–D) Comparison between ecf+ and ecf− DSS-treated mice in: (B) colon length, (C) colon weight per length, (D) Intestinal permeability using FITC-dextran. (E) Timeline for the IL-10−/− germ-free mouse model experiment. (F–H) Comparison between ecf+ and ecf− IL-10−/− gnotobiotic mice in: (F) colon length, (G) colon weight per length, and (H) Intestinal permeability measured using FITC-dextran. Data are presented as individual points, and the median is presented as a horizontal line. Data in the DSS-induced colitis model are collected from two independent experiments. Two-sided Student’s t-test was used to determine statistical significance in all comparisons (ns: not statistically significant). (I) Cytotoxicity of ebf-ecf-FAAs was evaluated by measuring relative cell viability of Caco-2 cells after 24 hours of incubation with each of five ebf-ecf-FAAs (at concentrations 1–32 μM, with each concentration measured in triplicates). Values are normalized to untreated cells. Data are represented as dose-response curves (x-axis is log-scaled) with individual data points shown and curve fitted using loess regression. IC50, the half-maximal inhibitory concentration, was calculated for NMP using regression curves fitted to NMP concentration and normalized cell viability, according to the Hill Equation.

References

    1. Abu-Ali G.S., Mehta R.S., Lloyd-Price J., Mallick H., Branck T., Ivey K.L., Drew D.A., DuLong C., Rimm E., Izard J., et al. (2018). Metatranscriptome of human faecal microbial communities in a cohort of adult men. Nat Microbiol 3, 356–366. - PMC - PubMed
    1. Ananthakrishnan A.N., Luo C., Yajnik V., Khalili H., Garber J.J., Stevens B.W., Cleland T., and Xavier R.J. (2017). Gut Microbiome Function Predicts Response to Anti-integrin Biologic Therapy in Inflammatory Bowel Diseases. Cell Host Microbe 21, 603–610 e603. - PMC - PubMed
    1. Asnicar F., Thomas A.M., Beghini F., Mengoni C., Manara S., Manghi P., Zhu Q., Bolzan M., Cumbo F., May U., et al. (2020). Precise phylogenetic analysis of microbial isolates and genomes from metagenomes using PhyloPhlAn 3.0. Nat Commun 11, 2500. - PMC - PubMed
    1. Atarashi K., Suda W., Luo C., Kawaguchi T., Motoo I., Narushima S., Kiguchi Y., Yasuma K., Watanabe E., Tanoue T., et al. (2017). Ectopic colonization of oral bacteria in the intestine drives TH1 cell induction and inflammation. Science 358, 359–365. - PMC - PubMed
    1. Blin K., Shaw S., Steinke K., Villebro R., Ziemert N., Lee S.Y., Medema M.H., and Weber T. (2019). antiSMASH 5.0: updates to the secondary metabolite genome mining pipeline. Nucleic Acids Res 47, W81–W87. - PMC - PubMed

Publication types