[Preprint]. 2024 Feb 6:2024.02.06.579103.
doi: 10.1101/2024.02.06.579103.

A pharmacological toolkit for human microglia identifies Topoisomerase I inhibitors as immunomodulators for Alzheimer's disease

Affiliations

A pharmacological toolkit for human microglia identifies Topoisomerase I inhibitors as immunomodulators for Alzheimer's disease

Verena Haage et al. bioRxiv. .

Abstract

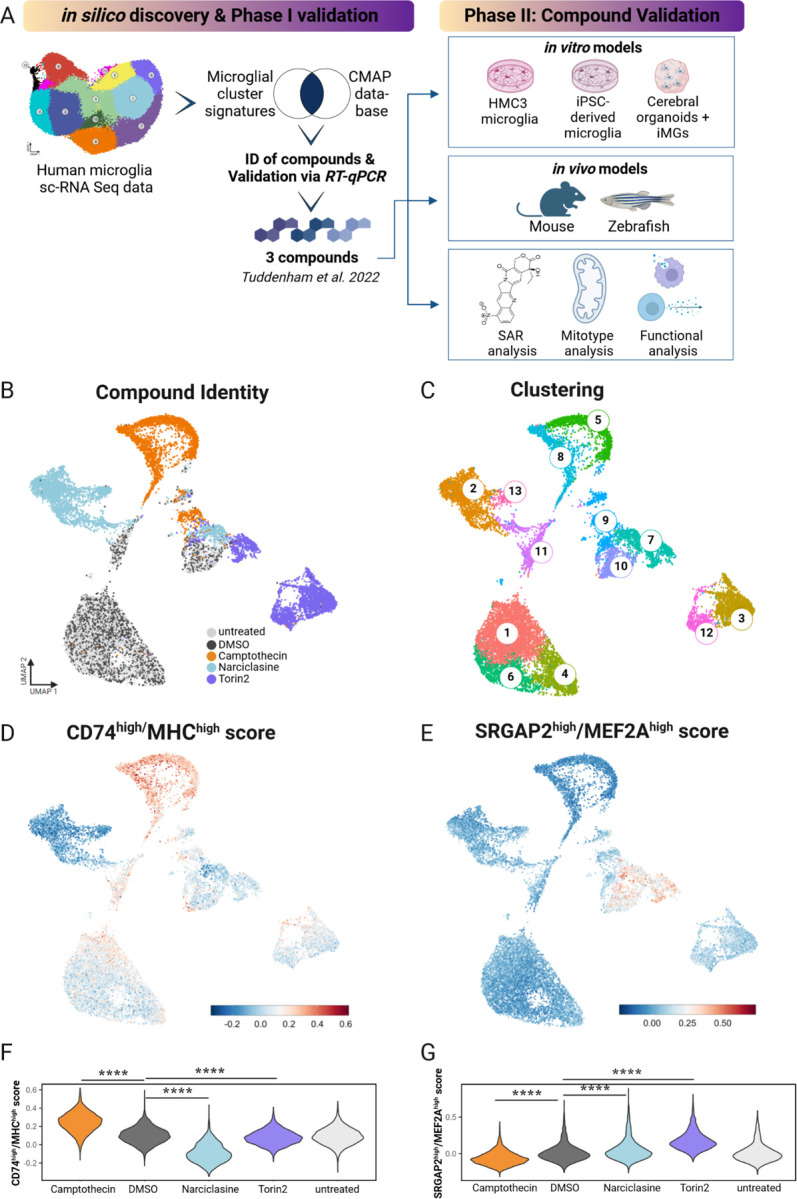
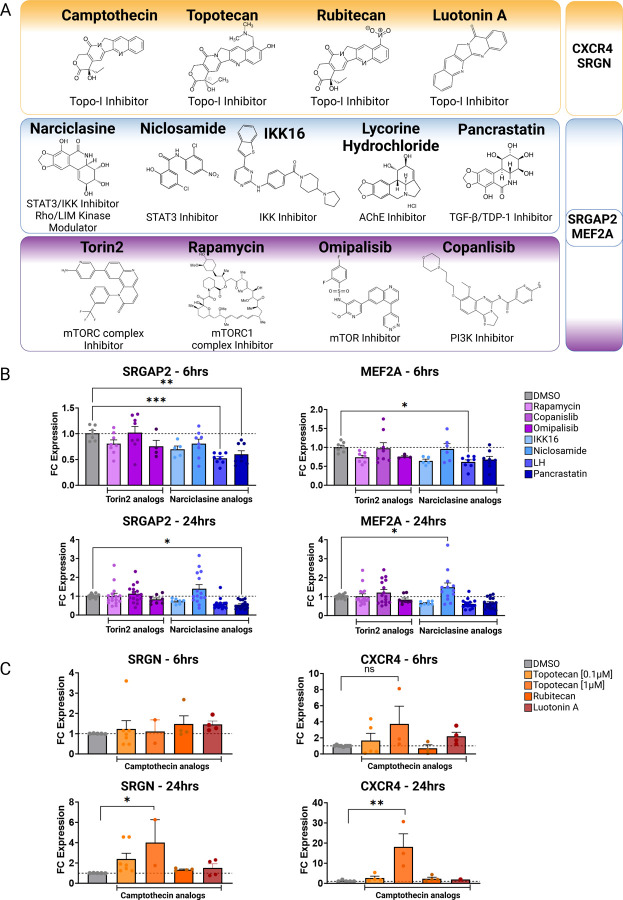
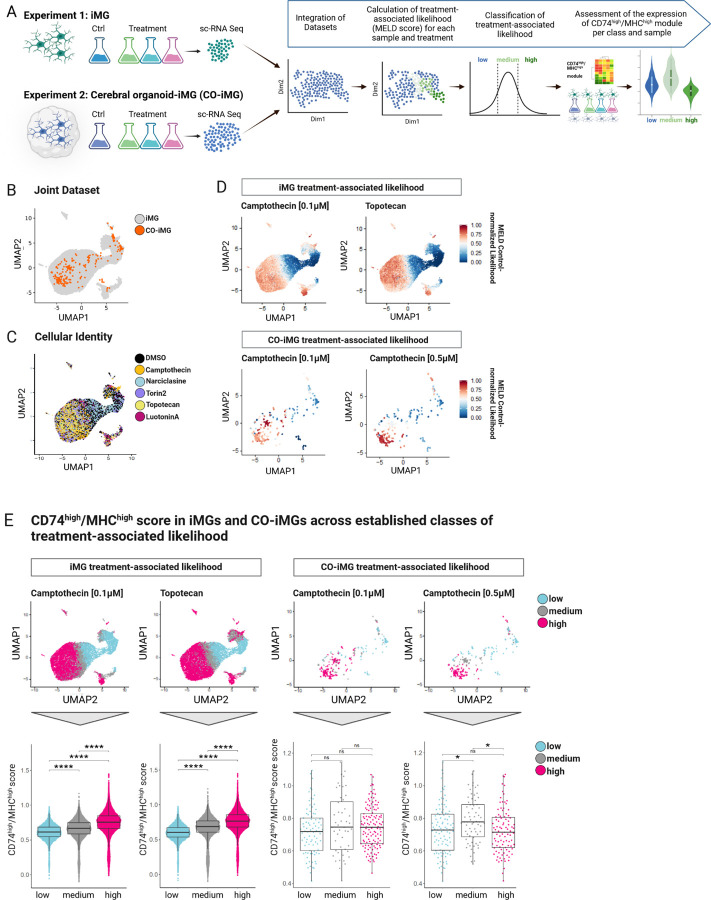
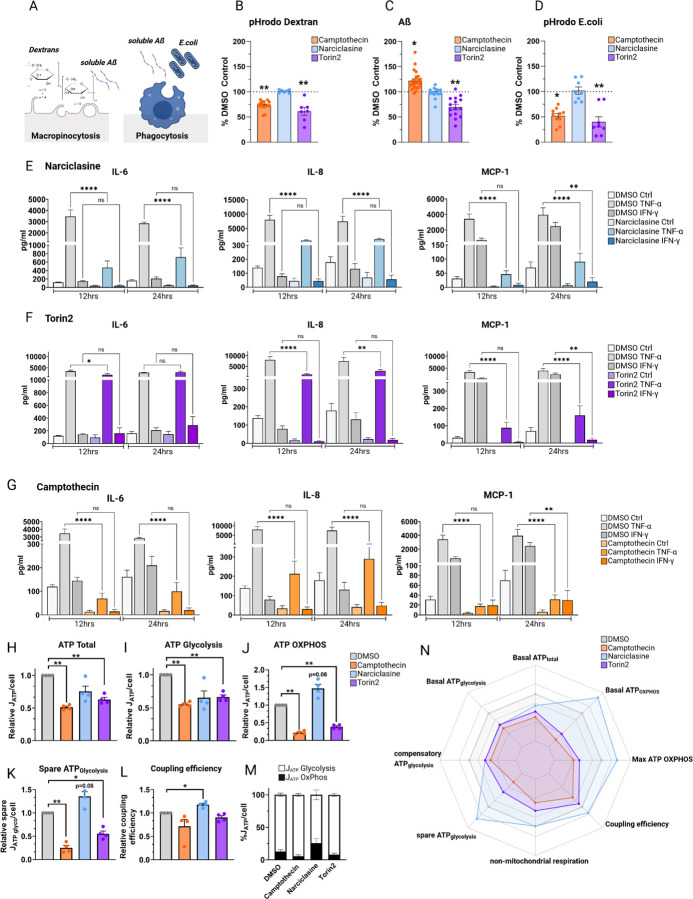
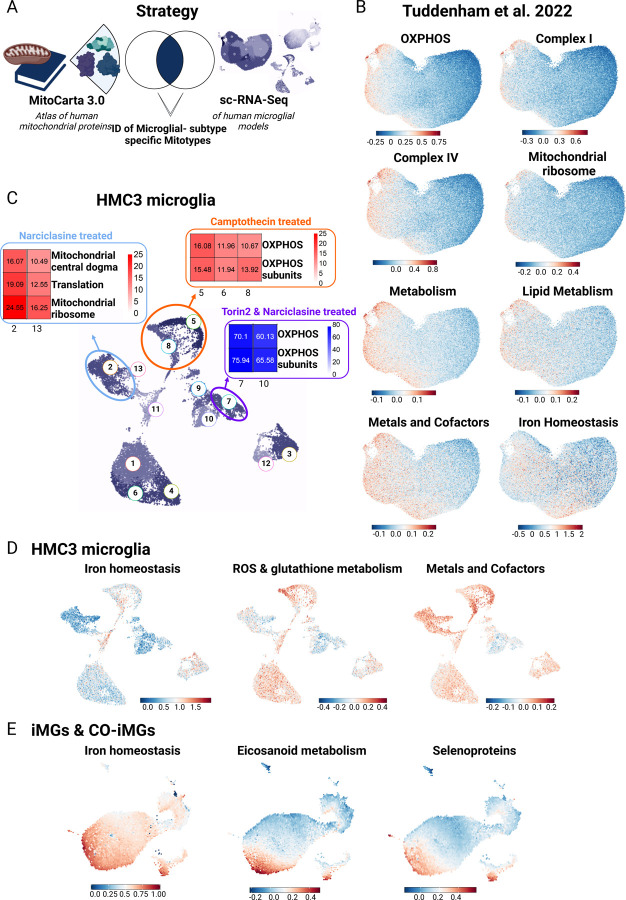
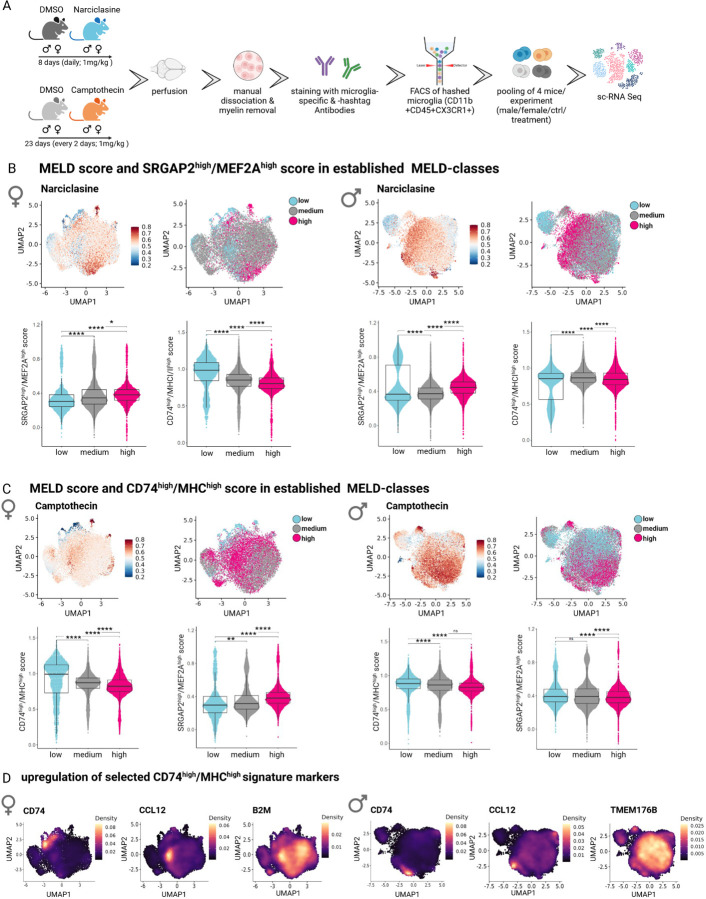
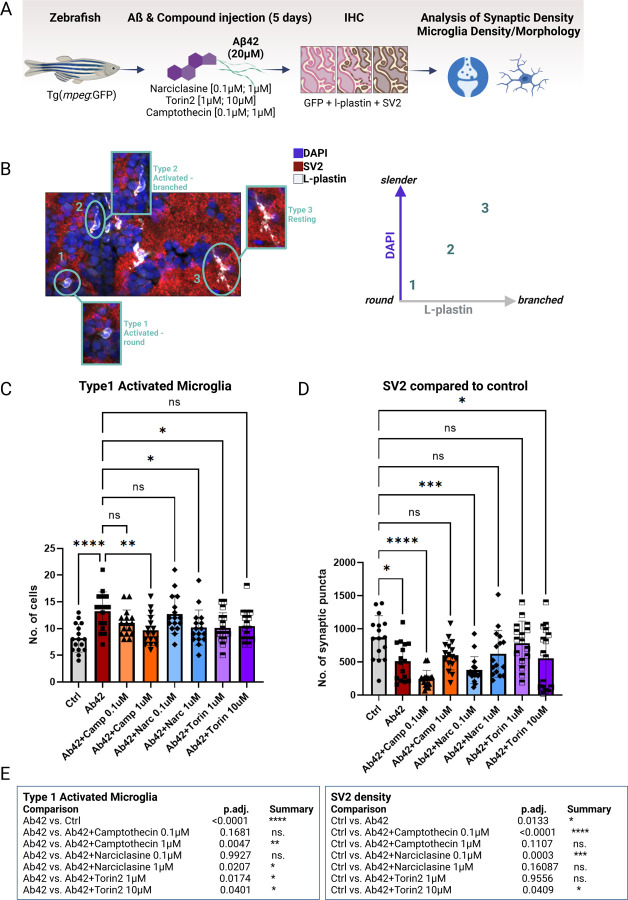
While efforts to identify microglial subtypes have recently accelerated, the relation of transcriptomically defined states to function has been largely limited to in silico annotations. Here, we characterize a set of pharmacological compounds that have been proposed to polarize human microglia towards two distinct states - one enriched for AD and MS genes and another characterized by increased expression of antigen presentation genes. Using different model systems including HMC3 cells, iPSC-derived microglia and cerebral organoids, we characterize the effect of these compounds in mimicking human microglial subtypes in vitro. We show that the Topoisomerase I inhibitor Camptothecin induces a CD74high/MHChigh microglial subtype which is specialized in amyloid beta phagocytosis. Camptothecin suppressed amyloid toxicity and restored microglia back to their homeostatic state in a zebrafish amyloid model. Our work provides avenues to recapitulate human microglial subtypes in vitro, enabling functional characterization and providing a foundation for modulating human microglia in vivo.


Figures

Figure 1.
Figure 1.. A.Overview of the study design and sc-RNA sequencing analysis of compound-treated HMC3 microglia.
Schematic diagram depicting in silico discovery phase, phase I of compound validation via RT-qPCR expression analysis, phase II of compound validation for three selected compounds Narciclasine, Torin2, Camptothecin in various in vitro microglial model systems and in vivo models. In validation phase III structure activity relationship analysis (SAR), mitochondrial phenotyping (mitotype) and functional assays were performed. B. UMAP of compound-treated HMC3s showing treatment. Each dot is a single cell, colored by compound treatment condition - untreated (light grey), DMSO control (dark grey), Camptothecin (orange) Narciclasine (light blue), Torin2 (purple). C. UMAP of compound-treated HMC3s showing cluster identity. Each dot is a single cell, colored by cluster identity ranging from clusters 1–13. D. CD74high/MHChigh signature in Camptothecin-treated HMC3 microglia. Enrichment of the top 50 cluster genes was calculated on a per-cell basis compared to background genes with similar expression levels. Cells are colored by log-fold change of the CD74high/MHChigh gene set. E. SRGAP2high/MEF2Ahigh signature in compound-treated HMC3 microglia. F. Violin plots depict the per-cell CD74high/MHChigh module score grouped by drug treatment. For statistical analysis pairwise Wilcoxon rank-sum tests were performed, ****p.adj ≤ 0.0001. G. Violin plots show SRGAP2high/MEF2Ahigh module score/cell grouped by drug treatment. For statistical analysis pairwise Wilcoxon sum-rank tests were performed, ****p.adj ≤ 0.0001.
Figure 2.
Figure 2.. Structure activity relationship (SAR) analysis.
A. Overview of chemical structures and functional targets of selected compounds for structure activity relationship analysis. B. Marker gene expression (SRGN, CXCR4) in HMC3 microglia treated with Camptothecin analogs (6hrs and 24hrs) assessed via RT-qPCR. CT values were normalized to HPRT1. Bars represent fold change expression (mean ± SEM) in relation to DMSO control. For statistical analysis, one-way ANOVA followed by Dunnett’s multiple comparisons test was performed. *p.adj ≤ 0.05; **p.adj ≤ 0.01; ***p.adj ≤ 0.001; ****p.adj ≤ 0.0001. C. Marker gene expression (SRGAP2, MEF2A) in HMC3 microglia treated with analog compounds for Torin2 and Narciclasine (6hrs and 24hrs), assessed via RT-qPCR. CT values were normalized to housekeeping gene HPRT1. Bars represent fold change expression (mean ± SEM) in relation to DMSO control. For statistical analysis, one-way ANOVA followed by Dunnett’s multiple comparisons test was performed. *p.adj ≤ 0.05; **p.adj ≤ 0.01; ***p.adj ≤ 0.001; ****p.adj ≤ 0.0001.
Figure 3.
Figure 3.. sc-RNA sequencing of compound-treated iMG and CO-iMG reveals upregulation of the CD74high/MHChigh module following Camptothecin and Topotecan treatment.
A. Overview of experimental design. iPSC-derived microglia (iMG), treated with compounds (Narciclasine, Torin2, Camptothecin, Topotecan, LuotoninA; Experiment 1) and cerebral organoids containing implanted iMG (CO-iMG), treated with compounds (Camptothecin 0.1µM and 0.5µM) or DMSO as control (24hrs) were subjected to sc-RNA sequencing. CO-iMG were projected onto the iMG data and MELD was used to quantify the relative treatment-associated likelihood for individual cells. Cells were then classified based on the relative treatment-associated likelihood (low; medium; high) and expression of CD74high/MHChigh signature genes was assessed across the three levels of relative treatment-associated likelihood calculated for each drug. B. UMAP of the integrated datasets (Seurat query-mapping pipeline) of compound-treated iMGs (gray) and CO-iMGs (orange). Each dot represents one cell. C. UMAP of integrated datasets (Seurat query-mapping pipeline) derived from controls and compound-treated iMGs and CO-iMGs. Each dot represents a cell from different treatment conditions before MELD score analysis (DMSO; Torin2; Narciclasine; Camptothecin; Topotecan; LuotoninA). D. Individual iMGs colored by treatment-associated likelihood in the joint UMAP. Same UMAP as in B-C, except that cells are colored by the relative treatment-associated likelihood scores (red:high, blue:low) calculated by MELD for treatment conditions: Camptothecin- and Topotecan treatment in iMGs, and Camptothecin treatment at 0.1µM and 0.5µM in CO-iMGs. E. CD74high/MHChigh score in iMGs and CO-iMGs across different levels of treatment-associated likelihood. Top row - same UMAP as in B-C, with cells colored by three different levels (low, medium, high) of treatment-associated likelihood for each drug-treatment condition. Bottom row - single-cell distribution of the CD74high/MHChigh module scores across the three levels of treatment-associated likelihood for each of the given samples. Each dot represents a single cell, statistical analysis was performed using unpaired t-test; ns = non-significant; ****p ≤ 0.0001. Each boxplot highlights the median, lower and upper quartiles. Whiskers indicate 1.5 times interquartile ranges.
Figure 4.
Figure 4.. Compound-treated HMC3 microglia exhibit substrate-specific endocytic and phagocytic phenotypes and differences in secretion of pro-inflammatory cytokines.
A-C. Phagocytic phenotypes. A. Graph depicting nature of the different assays assessing macropinocytosis (pHrodo Dextran, soluble Aß) and phagocytosis (Aß, E.coli). B. Vorinostat and Entinostat upregulate pHrodoDextran phagocytosis. HMC3 microglia, pretreated with respective compounds or DMSO as control (24hrs), were exposed to pHrodo-labeled Dextran (B), AlexaFluor 647-labeled Aβ (C) or pHrodo-labelled E.coli particles (D) for 1hr, uptake was assessed via flow cytometry. Each dot represents one independent experiment (mean ± SEM; Camptothecin – orange; Narciclasine – blue; Torin2 - purple). Phagocytosis was normalized to percent DMSO control, for statistical analysis, log-fold change values in comparison to DMSO-treated control samples were analyzed using one-way ANOVA followed by Dunnett’s multiple comparison test. *p.adj ≤ 0.05; **p.adj ≤ 0.01. E.-G. Cytokine secretion of compound- or DMSO-pretreated HMC3 cells (24hrs) followed by stimulation with either TNF-a (0.3 µg/mL), IFN-y (0.3 µg/mL) or H2O as control for 12 or 24hrs. Pro-inflammatory cytokine secretion was assessed using a human pro-inflammatory cytokine discovery assay. Bar graphs depict measured amount of cytokines IL-6, IL-8, MCP-1 (mean ± SEM) in pg/ml for DMSO control-treated samples (white, light grey, grey) or compound-treated samples (light blue, purple, orange). For statistical analysis, one-way ANOVA followed by Tukey’s multiple comparisons test with a single pooled variance was performed. *p.adj ≤ 0.05; **p.adj ≤ 0.01; ***p.adj ≤ 0.001; ****p.adj ≤ 0.0001. H-N. MitoStress test on HMC3 cells treated with Camptothecin, Narciclasine, and Torin2, depicting ATP total/cell (H), ATP Glycolysis (I), ATP generated through OxPhos (J), Spare ATP Glycolysis (K), coupling efficiency (L) and ATP generated by Glycolysis or OxPhos relative to DMSO (M). N. Data show means ± SEM. *p.adj ≤ 0.05, **p.adj ≤ 0.01, ***p.adj ≤ 0.001 test with BH adjustment. HedgesG for effect size.
Figure 5.
Figure 5.. Mitochondrial phenotyping identifies association between distinct human microglial subtypes and specific mitochondrial phenotypes.
A. Strategy for mitochondrial phenotyping analysis. 149 mitochondrial pathways defined from the MitoCarta 3.0 , were used to perform Gene Set Enrichment Analysis (GSEA) in the human microglial sc-RNA-Seq dataset B. Selected results of GSEA for specific mitotypes in human microglial subtypes are shown. Legend depicts module score, showing average expression for module genes vs. a background of similarly expressed control genes. C. Mitotype analysis results in compound-treated HMC3 microglia following GSEA for the 149 mitochondrial pathways from . Genes from HMC3-treated sc-RNA Seq data were ordered based on average log-fold change between cells from the respective treatment condition vs. control. Enrichment of gene modules associated with different aspects of mitochondrial activity was performed in upregulated gene lists associated with each cluster using hypergeometric test with Benjamini-Hochberg correction. D. Results of selected results of mitotype GSEA projected into UMAP of compound-treated HMC3 microglia. Plots show most specific and distinct GSEA results for mitochondrial phenotypes in compound-treated HMC3 microglial clusters. Legend depicts module score, showing average expression for module genes versus a background of similarly expressed control genes. E. Results of selected results of mitotype GSEA projected into joint UMAP of compound-treated iMG and CO-iMG. Plots show most specific and distinct GSEA results for mitochondrial phenotypes in compound-treated iMG and CO-iMG microglial clusters. Legend depicts module score, showing average expression for module genes vs. a background of similarly expressed control genes.
Figure 6.
Figure 6.. Narciclasine- and Camptothecin-treatment shifts microglial phenotypes in vivo.
A. Experimental design for Narciclasine- and Camptothecin-treatment of WT mice. For Narciclasine/Camptothecin treatment, 4 female and 4 male WT mice were treated for eight/23 consecutive days with either Narciclasine (1mg/kg)/Camptothecin (1mg/kg) or DMSO as a control via oral gavages. On Day 9/24, perfused brains from one animal/group were sorted by flow cytometry based on CD11b+CD45+CX3CR1+ and subsequently isolated and hashtag-marked microglia from 4 different mice were pooled for sc-RNA Seq using the 10X Chromium platform. B. MELD score and SRGAPhigh/MEF2Ahigh score in established MELD classes in Narciclasine-treated mice. For female/male mice, first graph shows the UMAP of all microglia from either female or male mice for all treatment groups (DMSO control for Narciclasine, DMSO control for Camptothecin, Narciclasine treated, Camptothecin treated) with treatment-associated likelihood colored for high likelihood (red) to low likelihood (blue). The second graph shows classification of cells based on treatment-associated likelihood into low (turquoise), medium (grey), high (pink) classes. The lower graphs depict SRGAPhigh/MEF2Ahigh and CD74high/MHChigh score in each of previously defined treatment-associated likelihood classes. *p.adj ≤ 0.05; **p.adj ≤ 0.01; ***p.adj ≤ 0.001; ****p.adj ≤ 0.0001. C. MELD score and SRGAPhigh/MEF2Ahigh score in established MELD classes in Camptothecin-treated mice. For female/male mice, the first graph shows the UMAP of all microglia from either female or male mice for all treatment groups (DMSO control for Narciclasine, DMSO control for Camptothecin, Narciclasine treated, Camptothecin treated) with treatment-associated likelihood colored for high likelihood (red) to low likelihood (blue). The second graph shows classification of cells based on treatment-associated likelihood into low (turquoise), medium (grey), high (pink) classes. The lower graphs depict SRGAPhigh/MEF2Ahigh and CD74high/MHChigh score in each of the previously defined treatment-associated likelihood classes. *p.adj ≤ 0.05; **p.adj ≤ 0.01; ***p.adj ≤ 0.001; ****p.adj ≤ 0.0001. D. Upregulation of Top20 CD74high/MHChigh signature genes in microglia isolated from Camptothecin-treated mice. Expression level of each of the of Top20 CD74high/MHChigh signature genes was computed separately and plotted in the respective UMAPs derived from female- or male-compound treated microglia (from lower expression: purple to high expression: yellow). Selected markers are depicted for female microglia on the left side (CD74, CCL12, B2M) and for male microglia on the right side (CD74, CCL12, TMEM176B).
Figure 7.
Figure 7.. Treatment with Camptothecin, Narciclasine and Torin2 reduces Type 1 activated microglia and restores synaptic density back to control levels in an adult amyloidosis zebrafish model.
A. Experimental design of compound-testing in the amyloidosis zebrafish model. Transgenic zebrafish (mpeg:GFP) were injected with 20µM of Aβ42 and co-injected with one dosage of either of the compounds in the brain. After 5 days, zebrafish brains were stained for GFP and L-plastin (microglia), SV2 (synapses) and DAPI (nuclei) to assess microglial density, morphology and synaptic density via confocal microscopy. B. Overview of morphological classification scheme of microglial activation states. Microglia were classified into three distinct activation types: Type 1 activated microglia (round-shaped without branching), Type 2 intermediate microglia (activated-branched), Type 3 resting microglia (slender cell bodies with branching). C. Quantification of Type 1 activated microglia (L-plastin; round shaped cell body and missing branches) was performed using confocal images of zebrafish brains harvested 5 days after Aβ42 injection plus compound- or DMSO-injection as control. Bar graphs represent mean cell number ± SD from a total of 16 images/ condition derived from 4 fish/condition. For statistical analysis, 2-way ANOVA followed by Dunnett’s multiple comparison’s test was performed. *p.adj ≤ 0.05; **p.adj ≤ 0.01; ***p.adj ≤ 0.001; ****p.adj ≤ 0.0001. D. Quantification of synaptic density (SV2) was performed using confocal images of zebrafish brains harvested 5 days after Aβ42 injection plus compound- or DMSO-injection as control. Bar graphs represent mean cell number ± SD from a total of 16 images/ condition derived from 4 fish/condition. For statistical analysis, 2-way ANOVA followed by Dunnett’s multiple comparison’s test was performed. *p.adj ≤ 0.05; **p.adj ≤ 0.01; ***p.adj ≤ 0.001; ****p.adj ≤ 0.0001. E. Table summarizing statistical results of quantifications of Type 1 activated microglia and synaptic density. For statistical analysis, 2-way ANOVA followed by Dunnett’s multiple comparison’s test was performed. *p.adj ≤ 0.05; **p.adj ≤ 0.01; ***p.adj ≤ 0.001; ****p.adj ≤ 0.0001.

References

    1. Colonna M. & Butovsky O. Microglia Function in the Central Nervous System During Health and Neurodegeneration. Annual Review of Immunology 35, 441–468, doi:10.1146/annurev-immunol-051116-052358 (2017). - DOI - PMC - PubMed
    1. Prinz M., Jung S. & Priller J. Microglia Biology: One Century of Evolving Concepts. Cell 179, 292–311, doi:10.1016/j.cell.2019.08.053 (2019). - DOI - PubMed
    1. Ransohoff R. M. & Perry V. H. Microglial Physiology: Unique Stimuli, Specialized Responses. Annual Review of Immunology 27, 119–145, doi:10.1146/annurev.immunol.021908.132528 (2009). - DOI - PubMed
    1. Masuda T. et al. Spatial and temporal heterogeneity of mouse and human microglia at single-cell resolution. Nature 566, 388–392, doi:10.1038/s41586-019-0924-x (2019). - DOI - PubMed
    1. Sankowski R. et al. Mapping microglia states in the human brain through the integration of high-dimensional techniques. Nature Neuroscience 22, 2098–2110, doi:10.1038/s41593-019-0532-y (2019). - DOI - PubMed

Publication types