[Preprint]. 2024 Feb 7:2024.02.06.579243.
doi: 10.1101/2024.02.06.579243.

Temporal dynamics of BMP/Nodal ratio drive tissue-specific gastrulation morphogenesis

Affiliations

Temporal dynamics of BMP/Nodal ratio drive tissue-specific gastrulation morphogenesis

Alyssa A Emig et al. bioRxiv. .

Update in

Abstract

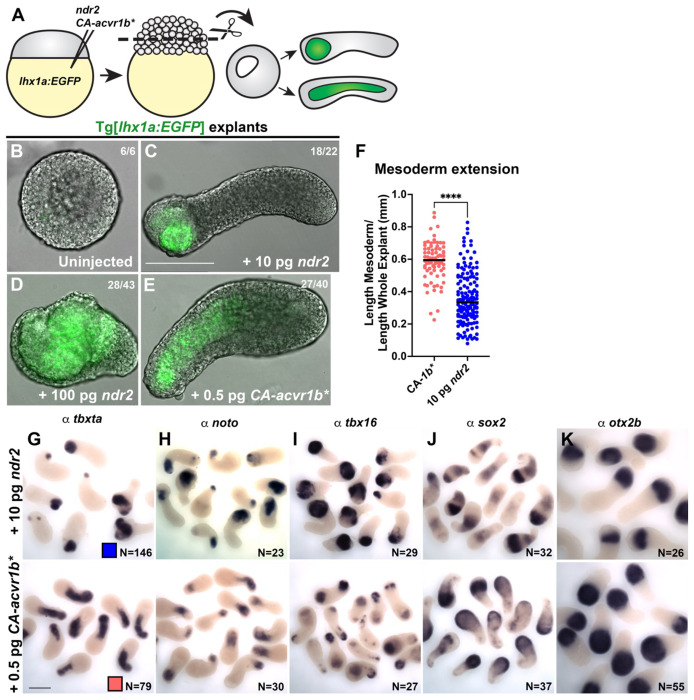
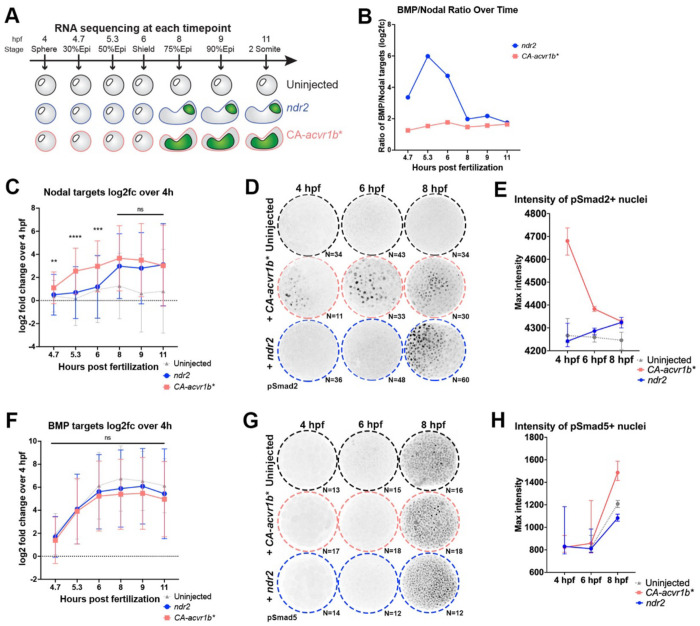
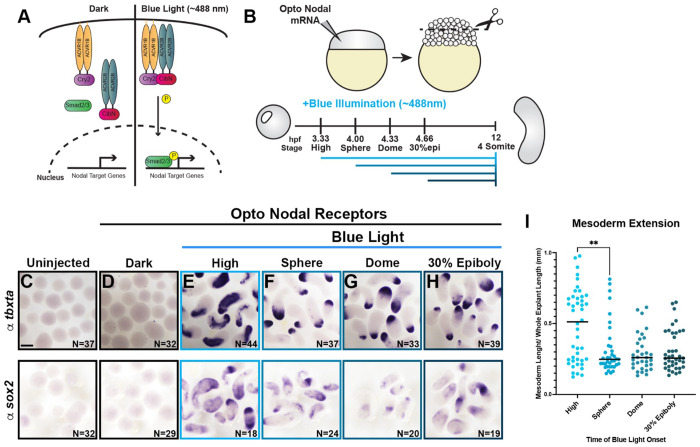
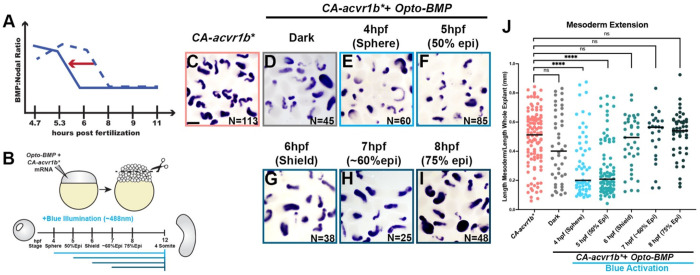
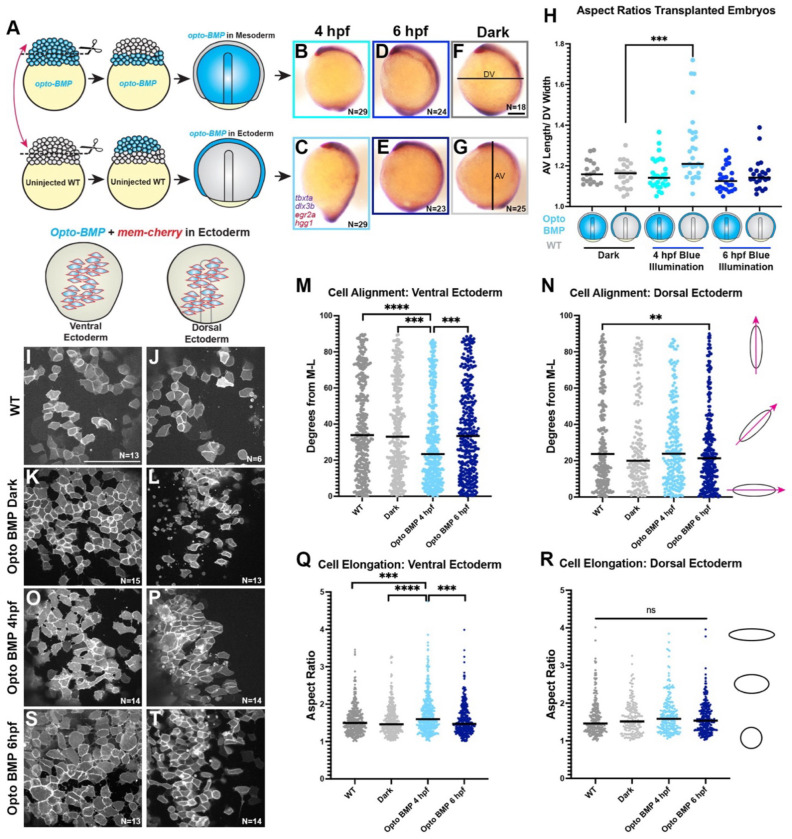
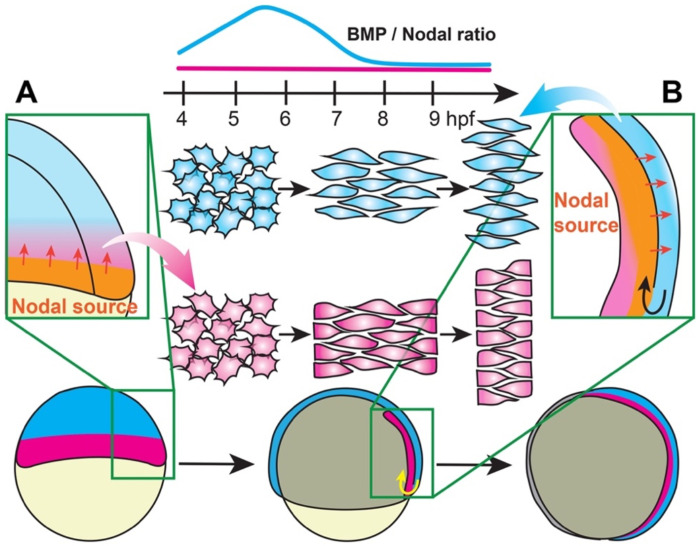
Anteroposterior (AP) elongation of the vertebrate body plan is driven by convergence and extension (C&E) gastrulation movements in both the mesoderm and neuroectoderm, but how or whether molecular regulation of C&E differs between tissues remains an open question. Using a zebrafish explant model of AP axis extension, we show that C&E of the neuroectoderm and mesoderm can be uncoupled ex vivo, and that morphogenesis of individual tissues results from distinct morphogen signaling dynamics. Using precise temporal manipulation of BMP and Nodal signaling, we identify a critical developmental window during which high or low BMP/Nodal ratios induce neuroectoderm- or mesoderm-driven C&E, respectively. Increased BMP activity similarly enhances C&E specifically in the ectoderm of intact zebrafish gastrulae, highlighting the in vivo relevance of our findings. Together, these results demonstrate that temporal dynamics of BMP and Nodal morphogen signaling activate distinct morphogenetic programs governing C&E gastrulation movements within individual tissues.

Keywords: BMP; Convergent extension; Gastrulation; Morphogenesis; Nodal; Zebrafish.


Conflict of interest statement

COMPETING INTERESTS The authors declare no competing interests.

Figures

Figure 1:
Figure 1:. Different methods of activating Nodal signaling promote tissue-specific C&E in zebrafish explants.
A) Diagram of Nodal injections and explantation of zebrafish embryos. B-E) Representative images of live Tg(79) explants, in which mesoderm expresses EGFP, of the conditions indicated at the equivalent of 4-somite stage. Fractions indicate the number of explants with the pictured phenotype over the number of explants examined. F) Mesoderm extension within explants as measured by the length of the tbxta mesoderm domain (shown in (G)) divided by the whole explant length. Each dot represents this ratio for an individual explant. Only explants with an overall length/width ratio of ≥1.4 are considered “extended” and thus, included in this analysis. Black bars are median values, ****p=<0.0001, Mann-Whitney test. The number of explants per condition is indicated in the corresponding image in (G). G-K) Representative images of WISH for the mesoderm markers tbxta, noto, and tbx16 (G-I) and the neuroectoderm markers sox2 and otx2b (J-K) in explants of the conditions indicated at the equivalent of 2-4 somite stage. N = number of explants examined per probe and condition from 5 independent trials. Scale bars = 200 μm.
Figure 2:
Figure 2:. Nodal activity and BMP/Nodal ratios exhibit distinct temporal dynamics in ndr2 and CA-acvr1b* explants.
A) Overview of longitudinal transcriptional profiling in uninjected, CA-acvr1b*, and ndr2 explants. B) Ratio of BMP- to Nodal-dependent transcriptional activity in ndr2 and CA-acvr1b* explants over time as estimated from the log2 fold change values of BMP and Nodal target gene expression in (C) and (F). C) Mean expression levels of 36 validated direct Nodal target genes in uninjected, ndr2, and CA-acvr1b* explants at the time points indicated, represented as log2fold change over expression levels at 4 hpf. ****p=<0.0001, ***p=0.0002, **p=0.006, Mann-Whitney test of ndr2 vs CA-acvr1b*, error bars are standard deviation. D) Representative images of immunofluorescent pSmad2 staining in explants of the conditions and at the time points indicated. N= number of explants analyzed from 2 independent trials. E) Quantification of maximum staining intensity within pSmad2+ nuclei, shown in (D). Symbols are median values with 95% confidence interval. F) Mean expression levels of 11 validated direct BMP target genes in uninjected, ndr2, and CA-acvr1b* explants at the time points indicated, represented as log2fold change over expression levels at 4 hpf. ns-Mann-Whitney test of ndr2 vs CA-acvr1b*, error bars are standard deviation. G) Representative images of immunofluorescent pSmad5 staining in explants of the conditions and at the time points indicated. N= number of explants analyzed from 1 trial. H) Quantification of maximum staining intensity within pSmad5+ nuclei, shown in (G). Symbols are median values with 95% confidence interval.
Figure 3:
Figure 3:. Timing of Nodal signaling onset is sufficient to determine tissue-specific C&E in explants.
A) Diagram of optogenetic Nodal (opto-Nodal) receptors. B) Overview of opto-Nodal onset experiments in explants. C-H) Representative images of WISH staining for the mesoderm and NE markers tbxta (top) and sox2 (bottom) in explants exposed to blue light at the stages indicated and analyzed at the equivalent of 4-somite stage. N = number of explants examined per probe and condition from 6 independent trials. Scale bar = 200 μm. I) Mesoderm extension within explants (shown in (E-H)) as described in Figure 1. Black bars are median values, **p=0.0053, Mann-Whitney test.
Figure 4:
Figure 4:. Increased BMP/Nodal ratios switch explants from mesoderm- to NE-driven C&E modes.
A-B) Overview of experimental manipulation to make BMP/Nodal ratios in CA-acvr1b* explants (dotted line) resemble ndr2 explants (solid line) (A) by injecting BMP modifiers CA-BMPR1 mRNA, admp mRNA, and chrd CRISPRs (B). C-H) Representative images of WISH for tbxta in explants of the conditions indicated at the equivalent of 4-somite stage. N = number of explants examined from 3 independent trials. I) Mesoderm extension within explants (shown in (D-H)) as described in Figure 1. Black bars are median values, ****p= <0.0001 via Mann-Whitney test. J-K) Overview of experimental manipulation to make BMP/Nodal ratios in ndr2 explants (dotted line) resemble CA-acvr1b* explants (solid line) (J) by injecting chrd mRNA (K). L-O) Representative images of WISH for tbxta in explants of the conditions indicated at the equivalent of 4-somite stage. N = number of explants examined from 3 independent trials. P) Mesoderm extension within explants (shown in (L-O)) as described in Figure 1. Black bars are median values, ****p= <0.0001, Mann-Whitney test. Scale bar = 200 μm.
Figure 5:
Figure 5:. High BMP/Nodal ratios prior to gastrulation onset promote NE-driven C&E in explants.
A-B) Overview of experimental manipulation to shift the temporal dynamics of BMP/Nodal ratios in CA-acvr1b* explants (A) by activating optogenetic BMP receptors using blue illumination at different time points (B). C-I) Representative images of WISH for tbxta in explants exposed to blue light at the time points indicated and analyzed at the equivalent of 4-somite stage. N = number of explants examined from 3 independent trials. Scale bar = 200 μm. J) Mesoderm extension within explants (shown in (C-I)) as described in Figure 1. Black bars are median values, ****p=<0.0001, Mann-Whitney test.
Figure 6:
Figure 6:. High BMP/Nodal ratios within ectoderm cells prior to gastrulation promotes C&E behaviors cell-autonomously.
A) Diagram of animal pole transplants between opto-BMP- and un-injected embryos. B-G) Representative images of transplanted embryos with opto-BMP hosts (top) or donors (bottom) activated at 4 or 6 hpf (plus dark controls), then WISH stained for tbxta, dlx3b (purple), eng2a, and hgg1 (red) at 2-somite stage (11 hpf). N = number of explants examined from 3 independent trials, scale bar = 200 μm. H) Ratio of animal-vegetal length (F) to dorsal-ventral width (G) of the embryos shown in (B-G). Each dot represents the aspect ratio of an individual embryo, black bars are median values, ***p=0.0005 Mann-Whitney test. I-L, O-P, S-T) Transplanted opto-BMP/mem-Cherry-expressing ectoderm in the ventral (I,K,O,S) and dorsal (J,L,P,T) sides of live embryos at tailbud stage (10 hpf). N = number of embryos from 3 independent trials, scale bar = 100 μm. M-N, Q-R) Cell alignment (M,N) and cell elongation (Q,R) of ventral (M,Q) and dorsal (N,R) ectoderm cells shown in (I-L, O-P, S-T). Cell alignment (M,N) is represented as degrees from the medio-lateral axis. Black bars are median values, ***p=0.0006, ****p=<0.0001, ***p=0.0008 (M), **p=0.0076 (N), Kolmogorov-Smirnov test. Cell elongation (Q,R) is represented as aspect (length/width) ratio of individual cells. Black bars are median values, ***p=0.0001, ****p=<0.0001, ***p=0.0004, Kolmogorov-Smirnov test. Each dot represents a single cell. Anterior is up in all images.
Figure 7:
Figure 7:. A model for temporal signaling dynamics in tissue-specific gastrulation morphogenesis.
During late blastula stages, the embryonic margin is a source of Nodal ligands that activate signaling within the future mesoderm (A). During gastrulation, internalized mesoderm continues to express Nodal ligands, serving as a Nodal source that activates signaling within the overlying neuroectoderm (B). This creates a delay in the reception of Nodal signals by the NE compared with the mesoderm, resulting in a period of low BMP/Nodal ratios in the mesoderm and high BMP/Nodal ratios in the NE (top) that promote distinct C&E modes in each tissue.

References

    1. Keller R. et al., Mechanisms of convergence and extension by cell intercalation. Philos Trans R Soc Lond B Biol Sci 355, 897–922 (2000). - PMC - PubMed
    1. Concha M. L., Adams R. J., Oriented cell divisions and cellular morphogenesis in the zebrafish gastrula and neurula: a time-lapse analysis. Development 125, 983–994 (1998). - PubMed
    1. Warga R. M., Kimmel C. B., Cell movements during epiboly and gastrulation in zebrafish. Development 108, 569–580 (1990). - PubMed
    1. Keller R. E., Danilchik M., Gimlich R., Shih J., The function and mechanism of convergent extension during gastrulation of Xenopus laevis. J Embryol Exp Morphol 89 Suppl, 185–209 (1985). - PubMed
    1. Wallingford J. B., Harland R. M., Xenopus Dishevelled signaling regulates both neural and mesodermal convergent extension: parallel forces elongating the body axis. Development 128, 2581–2592 (2001). - PubMed

Publication types