[Preprint]. 2024 Feb 7:2024.02.06.579149.
doi: 10.1101/2024.02.06.579149.

Protein-protein interactions with G3BPs drive stress granule condensation and gene expression changes under cellular stress

Affiliations

Protein-protein interactions with G3BPs drive stress granule condensation and gene expression changes under cellular stress

José M Liboy-Lugo et al. bioRxiv. .

Update in

Abstract

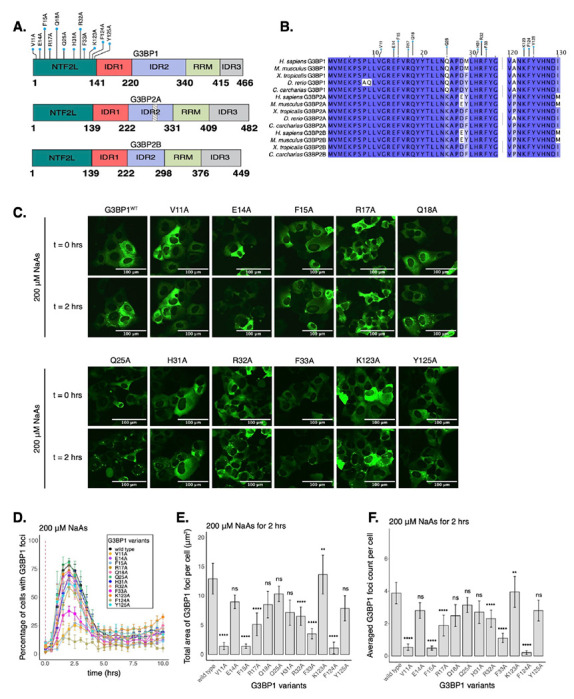
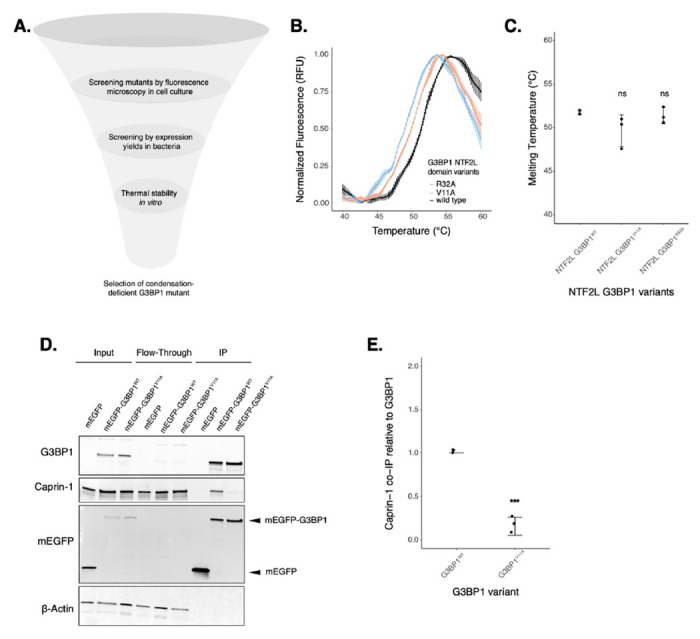
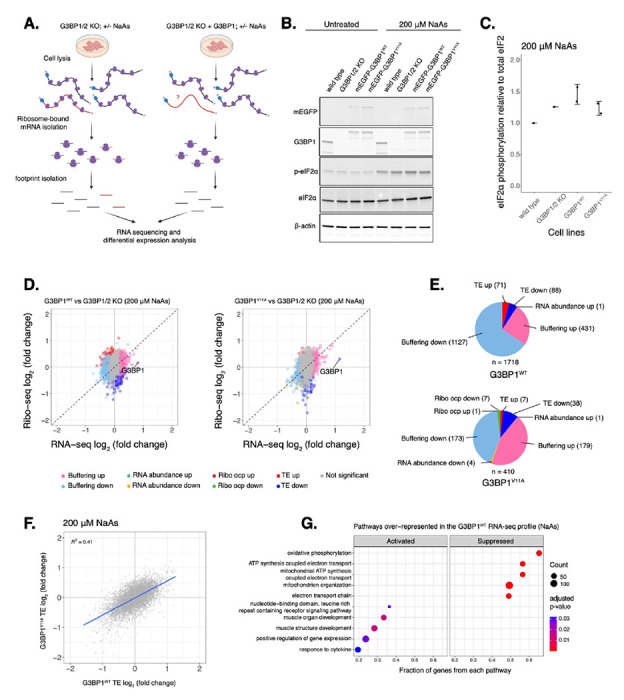
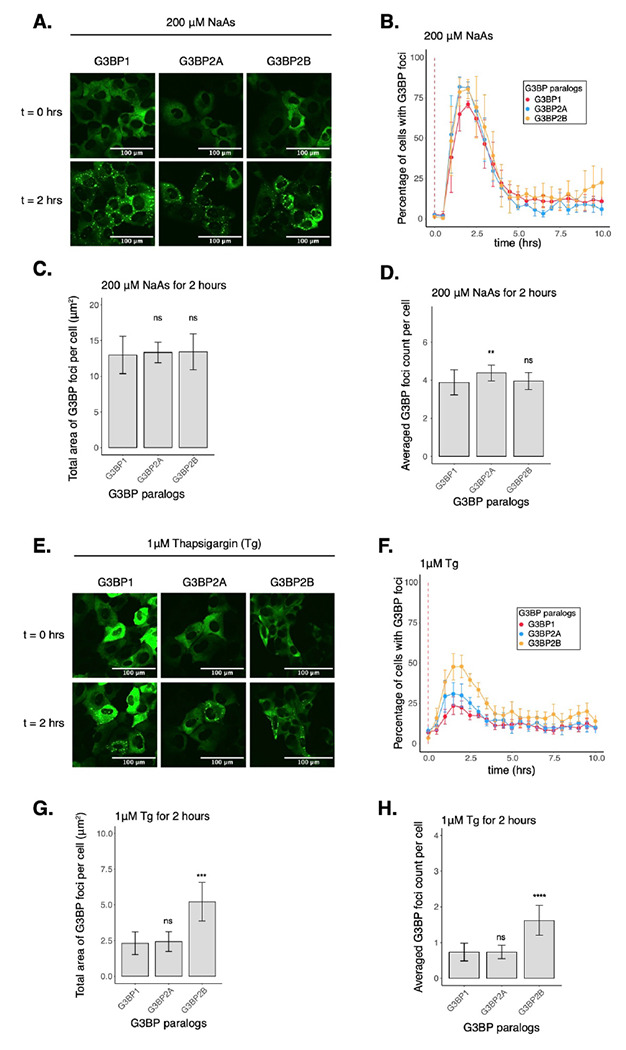
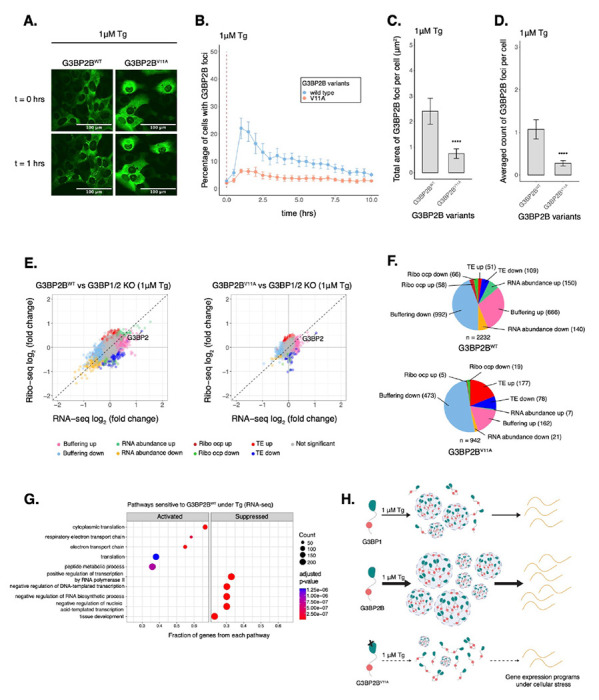
Stress granules (SGs) are macromolecular assemblies that form under cellular stress. Formation of these condensates is driven by the condensation of RNA and RNA-binding proteins such as G3BPs. G3BPs condense into SGs following stress-induced translational arrest. Three G3BP paralogs (G3BP1, G3BP2A, and G3BP2B) have been identified in vertebrates. However, the contribution of different G3BP paralogs to stress granule formation and stress-induced gene expression changes is incompletely understood. Here, we identified key residues for G3BP condensation such as V11. This conserved amino acid is required for formation of the G3BP-Caprin-1 complex, hence promoting SG assembly. Total RNA sequencing and ribosome profiling revealed that disruption of G3BP condensation corresponds to changes in mRNA levels and ribosome engagement during the integrated stress response (ISR). Moreover, we found that G3BP2B preferentially condenses and promotes changes in mRNA expression under endoplasmic reticulum (ER) stress. Together, this work suggests that stress granule assembly promotes changes in gene expression under cellular stress, which is differentially regulated by G3BP paralogs.

Keywords: G3BPs; Stress granules; integrated stress response; ribosome profiling.


Figures

Figure 1:
Figure 1:. Select residues in the NTF2L domain are key for stress granule formation.
A. Schematic of G3BP1 (top) domains showing the location of NTF2L alanine substitutions. Schematics of G3BP2A (middle) and G3BP2B (bottom) are also shown. Striped box on G3BP2A shows the region that is spliced out of the G3BP2B IDR2. B. Conservation of indicated G3BP NTF2L-domain regions across vertebrate species. C. Images (20X objective) of cells expressing mEGFP-G3BP1 variants at t = 0 hr and t = 2 hrs post-treatment with 200 μM NaAs. Puncta in the t = 2 hrs timepoint are stress granules. D. Percentage of cells with G3BP1 foci. Vertical red dashed line shows when NaAs was added to cells. E. Total area of G3BP1 foci per cell at 2 hours under NaAs. F. G3BP1 foci count per cell at 2 hours under NaAs. Plots D-F are showing mean ± SEM across Nreplicates ≥ 3. P-values were calculated based on whole cell populations (ncells ≥ 100 per replicate) relative to G3BP1WT. * p < 0.05, ** p < 0.01, *** p < 0.001, **** p < 0.0001.
Figure 2:
Figure 2:. G3BP1V11A inhibits the G3BP1-Caprin-1 complex without affecting protein stability in solution.
A. Diagram showing screening of G3BP1 mutants (image designed in biorender.com). B. DSF melting curves for purified G3BP1WT, G3BP1V11A and G3BP1R32A NTF2L domains. C. Calculated melting temperatures from curves in panel B. D. Western blot showing co-immunoprecipitation of the G3BP1-Caprin-1 complex in cells treated with 200 μM NaAs for 2 hours. E. Estimations of Caprin-1 band intensities from western on panel D by normalizing on G3BP1 levels. Plots B,C,E are showing mean ± SD across Nreplicates = 3. * p < 0.05, ** p < 0.01, *** p < 0.001, **** p < 0.0001.
Figure 3:
Figure 3:. Deficiency in G3BP1 condensation correlates to marginal changes in the expression of select mRNAs under arsenite stress.
A. Diagram showing Ribo-seq workflow (image designed in biorender.com). B. Western blot showing levels of eIF2α phosphorylation across U-2OS wild type cells, G3BP1/2 KO cells, and G3BP1/2 KO cells expressing either G3BP1WT or G3BP1V11A N-terminally tagged to mEGFP. Cells were treated either with water for control or 200 μM NaAs for 2 hours. C. Comparing levels of eIF2α phosphorylation under NaAs treatment across cell lines from western on panel B. mean ± SD across Nreplicates = 2. These lysates were used for Ribo-seq and total RNA-seq. D. Differential expression plots for Ribo-seq and total RNA-seq. Cells expressing either transgenic G3BP1WT or G3BP1V11A were compared to G3BP1/2 KO cells under 200 μM NaAs for 2 hours. E. Count of sensitive genes to G3BP1WT or G3BP1V11A identified on data from panel D. F. ΔTE LFC correlations between G3BP1WT and G3BP1V11A under NaAs. G. GSEA identifying activated and suppressed pathways by G3BP1WT on the differentially expressed gene sets from RNA-seq.
Figure 4:
Figure 4:. Condensation of G3BP paralogs during the ISR.
A. Images of cells expressing mEGFP-G3BP paralogs at t = 0 hr and t = 2 hrs post-treatment with 200 μM NaAs. B. Percentage of cells with G3BP foci. Vertical red dashed line shows when NaAs was added to cells. C. Total area of G3BP foci per cell at 2 hours under NaAs. D. G3BP foci count per cell at 2 hours under NaAs. E. Images of cells expressing mEGFP-G3BP paralogs at t = 0 hr and t = 2 hrs post-treatment with 1 μM Tg. F. Percentage of cells with G3BP foci. Vertical red dashed line shows when Tg was added to cells. G. Total area of G3BP foci per cell at 2 hours under Tg. H. G3BP foci count per cell at 2 hours under Tg. Plots B-D and F-H are showing mean ± SEM across Nreplicates ≥ 3. P-values were calculated based on whole cell populations (ncells ≥ 100 per replicate) relative to G3BP1. * p < 0.05, ** p < 0.01, *** p < 0.001, **** p < 0.0001.
Figure 5:
Figure 5:. G3BP paralogs impact mRNA expression differently under ER stress.
A. Western blot showing levels of eIF2α phosphorylation across U-2OS wild type cells, G3BP1/2 KO cells, and G3BP1/2 KO cells expressing either G3BP1, G3BP2A, or G3BP2B N-terminally tagged to mEGFP. Cells were treated either with DMSO for control or 1 μM Tg for 2 hours. B. Comparing levels of eIF2α phosphorylation under Tg treatment across cell lines from western on panel A. mean ± SD across Nreplicates = 4. C. Differential expression plots for Ribo-seq and total RNA-seq. Cells expressing either transgenic G3BP1, G3BP2A, or G3BP2B were compared to G3BP1/2 KO cells under 1 μM Tg for 2 hours. D. Count of sensitive genes to G3BP1, G3BP2A, or G3BP2B identified on data from panel C. E. GSEA for SG-associated mRNAs overlapping with differentially translated gene sets from G3BP1 (upper left), G3BP2A (upper right) and G3BP2B (bottom) Ribo-seq profiles. F. GO identifying pathways over-represented in Buffering up genes sensitive to G3BP2B under ER stress.
Figure 6:
Figure 6:. Deficiency in G3BP2B condensation correlates to substantial changes in the expression of select mRNAs under Tg.
A. Images of cells expressing mEGFP-G3BP2B variants at t = 0 hr and t = 1 hrs post-treatment with 1 μM Tg. B. Percentage of cells with G3BP2B foci. Vertical red dashed line shows when Tg was added to cells. C. Total area of G3BP2B foci per cell at 1 hour under Tg. D. G3BP2B foci count per cell at 1 hour under Tg. Plots B-D are showing mean ± SEM across Nreplicates ≥ 3. P-values were calculated based on whole cell populations (ncells ≥ 100 per replicate). * p < 0.05, ** p < 0.01, *** p < 0.001, **** p < 0.0001. E. Differential expression plots for Ribo-seq and total RNA-seq. Cells expressing either transgenic G3BP2BWT or G3BP2BV11A were compared to G3BP1/2 KO cells under 1 μM Tg for 2 hours. F. Count of sensitive genes to G3BP2BWT or G3BP2BV11A identified on data from panel E. G. GSEA identifying activated and suppressed pathways by G3BP2BWT on the differentially expressed gene sets from RNA-seq. H. Model showing the role of protein-protein interactions on the condensation of G3BP1/2 paralogs and mRNA expression during the ISR.

Similar articles

References

    1. Kedersha N. L., Gupta M., Li W., Miller I. & Anderson P. RNA-Binding Proteins Tia-1 and Tiar Link the Phosphorylation of Eif-2α to the Assembly of Mammalian Stress Granules. The Journal of Cell Biology 147, 1431–1442 (1999). - PMC - PubMed
    1. Buchan J. R. & Parker R. EukaryoCc Stress Granules: The Ins and Outs of Translation. Molecular Cell 36, 932–941 (2009). - PMC - PubMed
    1. Kedersha N. et al. Evidence That Ternary Complex (eIF2-GTP-tRNAiMet)–Deficient Preinitiation Complexes Are Core Constituents of Mammalian Stress Granules. MBoC 13, 195–210 (2002). - PMC - PubMed
    1. Sahoo P. K. et al. Axonal G3BP1 stress granule protein limits axonal mRNA translation and nerve regeneration. Nat Commun 9, 3358 (2018). - PMC - PubMed
    1. Sahoo P. K. et al. A Ca2+-Dependent Switch Activates Axonal Casein Kinase 2α Translation and Drives G3BP1 Granule Disassembly for Axon Regeneration. Current Biology 30, 4882–4895.e6 (2020). - PMC - PubMed

Publication types