[Preprint]. 2024 Feb 5:2024.02.03.577834.
doi: 10.1101/2024.02.03.577834.

A Simple and Scalable Zebrafish Model of Sonic Hedgehog Medulloblastoma

Affiliations

A Simple and Scalable Zebrafish Model of Sonic Hedgehog Medulloblastoma

Mattie J Casey et al. bioRxiv. .

Update in

Abstract

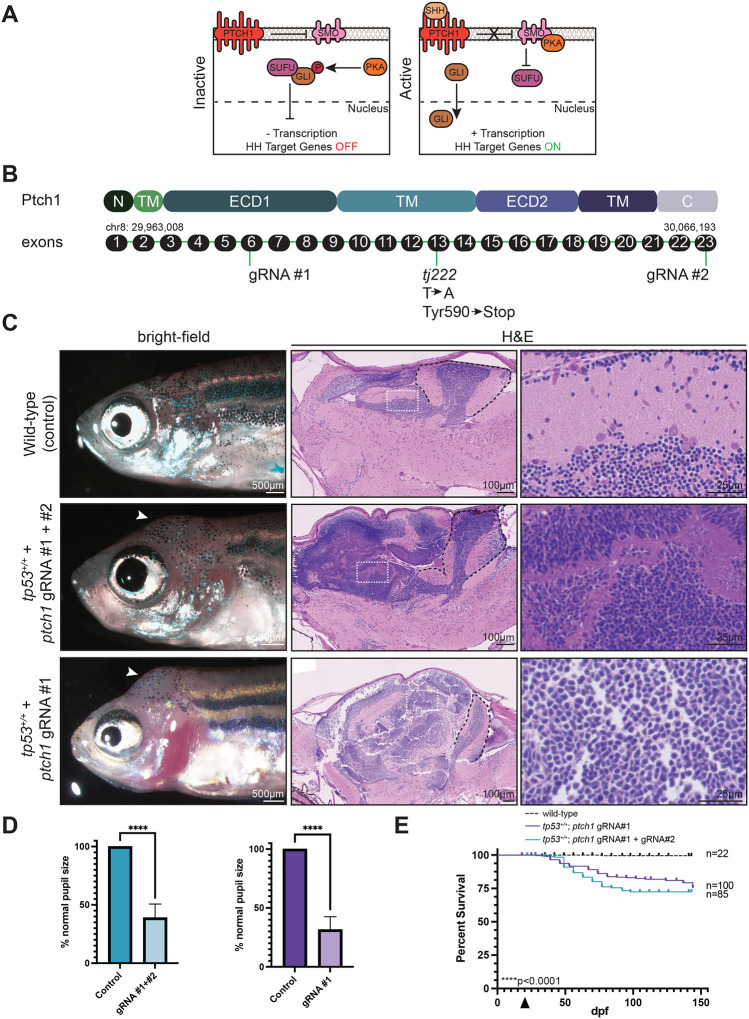
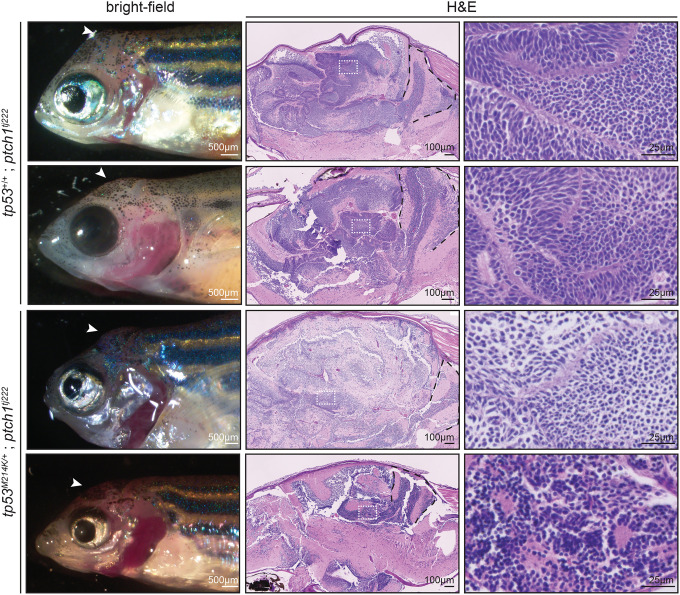
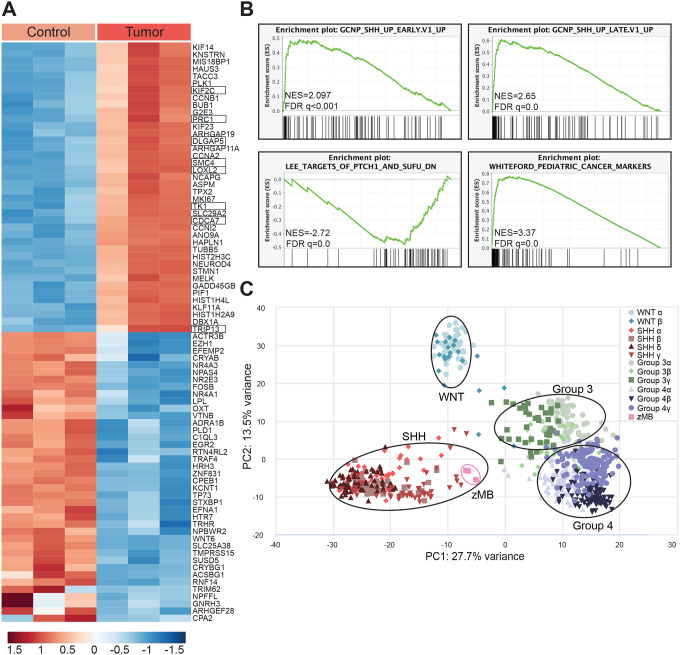
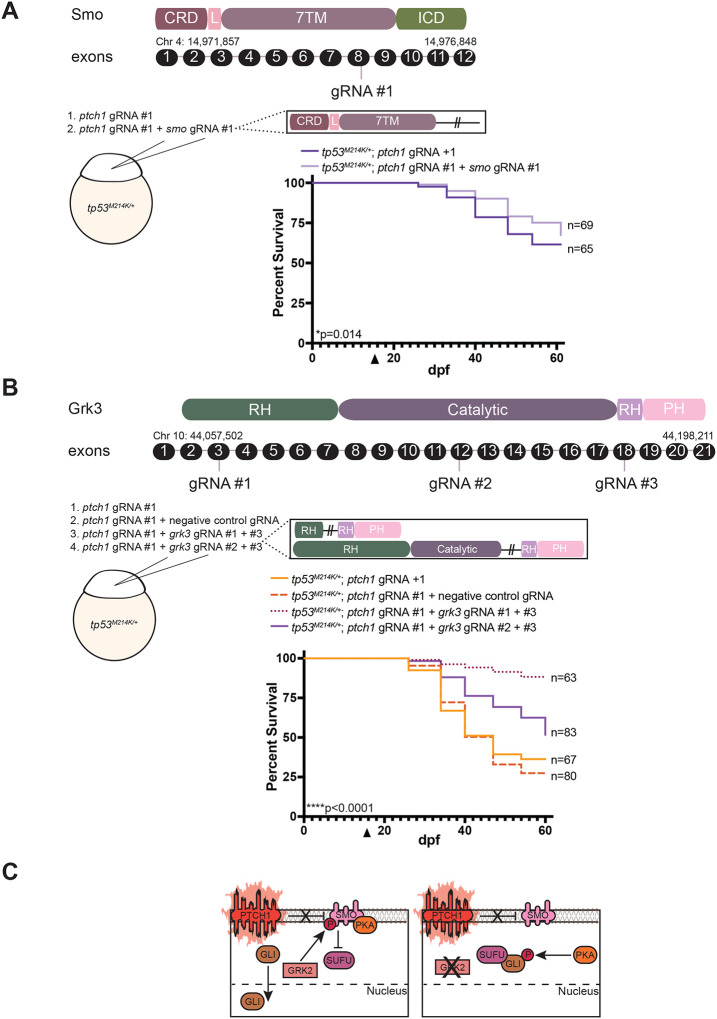
Medulloblastoma (MB) is the most common malignant brain tumor in children and is stratified into three major subgroups. The Sonic hedgehog (SHH) subgroup represents ~30% of all MB cases and has significant survival disparity depending upon TP53 status. Here, we describe the first zebrafish model of SHH MB using CRISPR to mutate ptch1, the primary genetic driver in human SHH MB. These tumors rapidly arise adjacent to the valvula cerebelli and resemble human SHH MB by histology and comparative genomics. In addition, ptch1-deficient MB tumors with loss of tp53 have aggressive tumor histology and significantly worse survival outcomes, comparable to human patients. The simplicity and scalability of the ptch1 MB model makes it highly amenable to CRISPR-based genome editing screens to identify genes required for SHH MB tumor formation in vivo, and here we identify the grk3 kinase as one such target.

Keywords: CRISPR; GRK2; GRK3; PTCH1; Pediatric brain tumors; SHH medulloblastoma; TP53; midbrain-hindbrain boundary; valvula cerebelli; zebrafish.


Conflict of interest statement

Declaration of interests The authors declare no conflicts of interest.

Figures

Figure 1.
Figure 1.. Transient ptch1 crispants develop brain tumors.
(A) Diagram of key mediators of the SHH pathway. (Left) Inactive SHH signaling: In the absence of SHH ligand, PTCH1 inhibits SMO. GLI is bound by SUFU and phosphorylated by PKA. GLI is unable to translocate to the nucleus, SHH target genes are not transcribed. (Right) Active SHH signaling: SHH ligand binds to PTCH1. SMO is activated, directly binds to PKA to prevent phosphorylation of GLI, and inhibits SUFU. GLI is free to translocate to the nucleus and transcribe SHH target genes. (B) Schematic of the Ptch1 protein domains and corresponding exons. gRNA target sites and the germline premature stop mutation (tj222) are indicated. The ptch1tj222 mutation (relevant to Figure 3) is also shown. The chromosomal location is noted above the first and last exon. N, N-terminal domain; TM, transmembrane domain; ECD1 and ECD2, extracellular domains 1 and 2; C, C-terminal domain. (C) (Left) Bright-field image of 6-wpf wild-type AB animals that were injected at the one-cell stage with the indicated ptch1 gRNAs. Uninjected wild-type fish served as a negative control for this experiment. (Middle and right) Sagittal section of either control brain or ptch1-crispant brain tumors stained with hematoxylin and eosin. White arrowheads indicate the location of the tumor in the left panels. White boxes in the middle panel are shown at higher magnification in the right panel. Black dashed lines indicate the cerebellum. (D) Animals from the experiment described in C were analyzed for the presence of smaller pupils. The percentage of animals from each experimental group with normal pupil size was quantified. Data is plotted as the standard error of the mean. ****p<0.0001. (E) Wild-type zebrafish were either left uninjected or were injected at the one-cell stage with either ptch1 gRNAs #1 and #2 or ptch1 gRNA #1 alone, and analyzed for survival following injection. Arrow indicates beginning of survival analysis.
Figure 2.
Figure 2.. Mutation in tp53 promotes aggressiveness in ptch1-crispant brain tumors.
(A) Schematic of the embryo injection strategy to determine whether tp53 acts as a tumor suppressor in the ptch1-crispant brain tumors. (B-C) Zebrafish from the indicated genetic backgrounds were injected at the one-cell stage with either ptch1 gRNAs #1 and #2 (B) or ptch1 gRNA #1 alone (C), and analyzed for survival following injection. Arrow indicates beginning of survival analysis. (D) (Left) Bright-field image of 7-wpf animals with the indicated genetic backgrounds that were injected at the one-cell stage with either ptch1 gRNA #1 alone or ptch1 gRNAs #1 and #2. (Middle and right) Sagittal section of control brain or ptch1-crispant brain tumors stained with hematoxylin and eosin. White arrowheads indicate location of the tumor in the left panels. White boxes in the middle panel are shown at higher magnification in the right panel. Black dashed lines indicate the cerebellum.
Figure 3.
Figure 3.. Zebrafish germline ptch1-mutant adults develop brain tumors.
(Left) Bright-field image of the germline ptch1tj222 mutant animals that survived to adulthood. (Middle and right) Sagittal section of ptch1tj222 brain tumors stained with hematoxylin and eosin. White arrowheads indicate location of the tumor in the left panels. White boxes in the middle panel are shown at higher magnification in the right panel. Black dashed lines indicate the cerebellum.
Figure 4.
Figure 4.. Zebrafish ptch1-crispant brain tumors resemble human SHH medulloblastoma.
(A) Heatmap of the top 40 differentially regulated genes in tp53M214K control brain tissue (“Control”) and tp53M214K; ptch1 gRNA #1 brain-tumor tissue (“Tumor”). Three biological replicates were analyzed per group. SHH pathway response genes are boxed. (Zhao et al. 2002 PNAS PMID 11960025). (B) Gene set enrichment analysis (GSEA) was performed to identify expression pathways enriched in tp53M214K; ptch1-crispant, brain-tumor tissue compared to tp53M214K control brain. NES, normalized enrichment score; FDR, false discovery rate. (C) Principal component analysis comparing zebrafish tp53M214K; ptch1-crispant brain tumors and human MB samples (Cavalli et al., 2017).
Figure 5.
Figure 5.. Loss of grk3 improves overall survival of ptch1 animals.
(A) (Top) Schematic of the Smo protein domains and corresponding exons. The gRNA target site is indicated. CRD, cysteine-rich domain; L, linker domain; 7TM, seven transmembrane domain; ICD, intracellular domain. (Middle) Schematic of injection strategy and predicted zebrafish Smo mutant protein. (Bottom) Survival curve of ptch1 crispants compared to ptch1/smo double crispants. Arrow indicates beginning of survival analysis. (B) (Top) Schematic of the Grk3 protein domains and corresponding exons. gRNA target sites are indicated. RH, RGS-homology domain; Catalytic, catalytic domain; PH, pleckstrin-homology domain. (Middle) Schematic of injection strategy and predicted zebrafish Grk3 mutant protein. (Bottom) Survival curve of ptch1 crispants and ptch1/negative control crispants compared to ptch1/grk3 double crispants using two independent grk3 gRNAs. Arrow indicates beginning of survival analysis. (C) Schematic describing how loss of GRK3 disrupts SHH-induced tumorigenesis. (Left) In ptch1-deficient MB tumors, SMO is not inhibited by mutant PTCH1 promoting phosphorylation by GRK, which enables SMO to bind and sequester PKA. In turn, GLI is no longer modulated by PKA-mediated phosphorylation or sequestered by SUFU and is instead translocated to the nucleus to constitutively transcribe SHH target genes. (Right) Loss/inhibition of GRK2 prevents SMO phosphorylation, thereby preventing SMO from sequestering PKA. Free PKA phosphorylates GLI which now binds to SUFU and is unable to translocate to the nucleus. SHH target genes are no longer transcribed.

References

    1. Smoll N.R., and Drummond K.J.. 2012. The incidence of medulloblastomas and primitive neuroectodermal tumors in adults and children. J. Clin. Neurosci. 19:1541–1544. doi:10.1016/j.jocn.2012.04.009. - DOI - PubMed
    1. Northcott P.A., et al. 2019. Medulloblastoma. Nat. Rev. Dis. Primers. 5:11. doi:10.1038/s41572-019-0063-6. - DOI - PubMed
    1. Cavalli F.M.G., et al. 2017. Intertumoral heterogeneity within medulloblastoma subgroups. Cancer Cell. 31:737–754. doi:10.1016/j.ccell.2017.05.005. - DOI - PMC - PubMed
    1. Skowron P., et al. 2021. The transcriptional landscape of Shh medulloblastoma. Nat. Commun. 12:1749. Doi:10.1038/s41467-021-21883-0. - DOI - PMC - PubMed
    1. Zhukova N., et al. 2013. Subgroup-specific prognostic implications of TP53 mutation in medulloblastoma. J. Clin. Oncol. 31:2927–2935. Doi:10.1200/JCO.2012.48.5052. - DOI - PMC - PubMed

Publication types