[Preprint]. 2024 Dec 23:2024.02.05.578828.
doi: 10.1101/2024.02.05.578828.

Neural signatures of opioid-induced risk-taking behavior in the prelimbic prefrontal cortex

Affiliations

Neural signatures of opioid-induced risk-taking behavior in the prelimbic prefrontal cortex

Cana B Quave et al. bioRxiv. .

Update in

Abstract

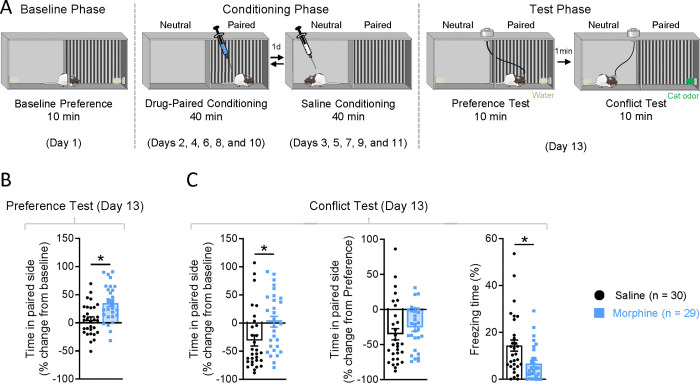
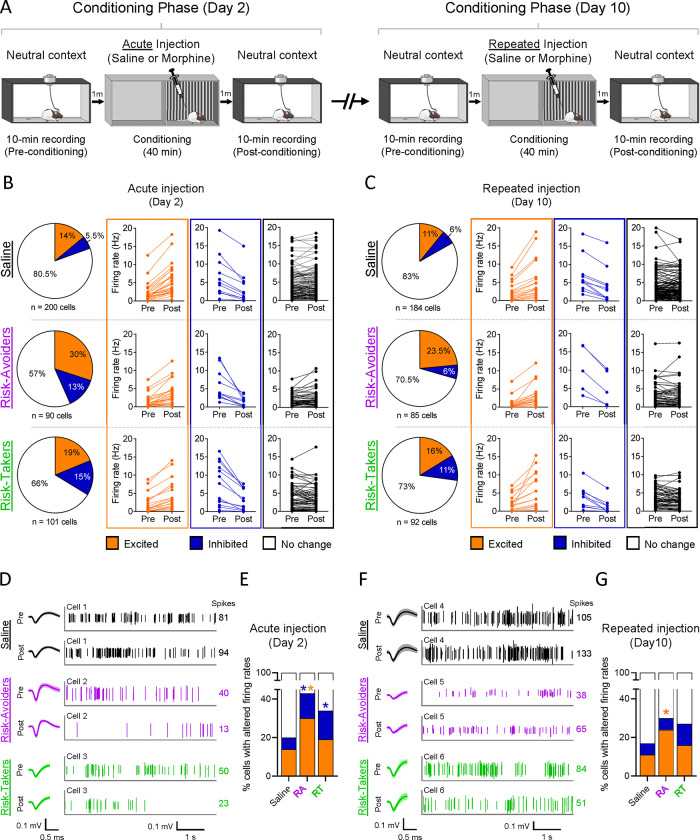
Opioid use disorder occurs alongside impaired risk-related decision-making, but the underlying neural correlates are unclear. We developed an approach-avoidance conflict task using a modified conditioned place preference procedure to study neural signals of risky opioid seeking in the prefrontal cortex, a region implicated in executive decision-making. Following morphine conditioned place preference, rats underwent a conflict test in which fear-inducing cat odor was introduced in the previously drug-paired side of the apparatus. While the saline-exposed control group avoided cat odor, the morphine group included two subsets of rats that either maintained a preference for the paired side despite the presence of cat odor (Risk-Takers) or exhibited increased avoidance (Risk-Avoiders), as revealed by K-means clustering. Single-unit recordings from the prelimbic cortex (PL) demonstrated decreased neuronal activity upon acute morphine exposure in both Risk-Takers and Risk-Avoiders, but this firing rate suppression was absent after repeated morphine administration. Risk-Avoiders also displayed distinct post-morphine excitation in PL which persisted across conditioning. During the preference test, subpopulations of PL neurons in all groups were either excited or inhibited when rats entered the paired side. Interestingly, the inhibition in PL activity was lost during the subsequent conflict test in both saline and Risk-Avoider groups, but persisted in Risk-Takers. Additionally, Risk-Takers showed an increase in the proportion of PL neurons displaying location-specific firing in the drug-paired side from the preference to the conflict test. Together, our results suggest that persistent PL inhibitory signaling in the drug-associated context during motivational conflict may underlie increased risk-taking behavior following opioid exposure.


Conflict of interest statement

COMPETING INTERESTS The authors declare no competing interests.

Figures

Figure 1.
Figure 1.. Repeated morphine administration leads to contextual reward memory formation and risk-taking behavior during approach-avoidance conflict.
A) Schematic timeline of morphine conditioned place preference and approach-avoidance conflict tests. Rats were assigned to one side of a two-chamber apparatus for conditioning, the assigned side being that which the rat preferred least at baseline. B) Percentage of change from baseline in time spent in the drug-paired side of the apparatus. Morphine-treated rats exhibited conditioned place preference as measured by the increased amount of time in the drug-paired side compared to saline controls (Welch’s t-test, *p < 0.001). C left) Percentage of change from baseline in time spent in the drug/cat-paired side of the apparatus during the conflict test. Rats conditioned with saline, but not morphine, showed aversion to the drug/cat-paired side (Shapiro-Wilk normality test, p < 0.001; Mann-Whitney U-test, *p = 0.0062). C center) Percentage of change from the preference test in time spent in the drug/cat-paired side of the apparatus during the conflict test. No groups differences were observed (Shapiro-Wilk normality test, p = 0.007; Mann-Whitney U-test, p = 0.149). C right) Percentage of time spent freezing during the conflict test. Morphine-treated rats displayed reduced freezing levels compared to saline controls (Shapiro-Wilk normality test, p < 0.05; Mann-Whitney U-test, *p = 0.0053). Data are shown as mean ± SEM.
Figure 2.
Figure 2.. Morphine-treated rats show individual differences in risk-taking behavior during conflict.
A) K means cluster analysis (10 repetitions) of Morphine group animals in measures of freezing (% time spent freezing during the conflict test), place preference (% change from baseline in time spent in the drug-paired side during the preference test), and cat odor aversion (% change from preference test in time spent in the drug/cat-paired side during the conflict test). Two clusters were identified: one with lower place preference and greater cat odor aversion (magenta cluster, Risk-Avoiders, n = 15), and another with greater place preference and lower cat odor aversion (green cluster, Risk-Takers, n = 14). B) Percentage of change from baseline in time spent in the drug-paired side of the apparatus. Risk-Takers demonstrated greater place preference than Risk-Avoiders (Welch’s t-test, *p < 0.001). C left) Percentage of change from baseline in time spent in the drug/cat-paired side of the apparatus during the conflict test. Risk-Takers showed less cat odor aversion than Risk-Avoiders (Welch’s t-test, *p < 0.0001). C center) Percentage of change from the preference test in time spent in the drug/cat-paired side of the apparatus during the conflict test. Risk-Takers showed less cat odor aversion than Risk-Avoiders (Welch’s t-test, *p < 0.0001). C right) Percentage of time spent freezing during the conflict test. Both groups displayed similar levels of freezing during the conflict test (Welch’s t-test, *p = 0.052). Representative tracks and heatmaps of time spent in either side of the apparatus during Preference or Conflict Tests for Risk-Avoiders (D) and Risk-Takers (E). Data are shown as mean ± SEM.
Figure 3.
Figure 3.. Morphine-induced PL inhibition is lost after conditioning in both Risk-Avoiders and Risk-Takers, but persistent PL excitation is exclusive to Risk-Avoiders.
A) Timeline of recordings of spontaneous single-unit activity in PL after acute (Day 2) and repeated (Day 10) administration of saline or morphine (10 mg/kg, subcutaneous). B) Representations of cells excited (orange), inhibited (dark blue), or exhibiting no change (black/white) in response to acute drug administration (Z-scores used for response classification [excited, >2.58; inhibited, <−1.96]; cells with firing rates >20 Hz not shown [Saline = 7, Risk-Avoiders = 3, Risk-Takers = 3]). As compared to saline administration, acute morphine administration resulted in a greater number of cells showing increased firing rates in Risk-Avoiders (Fisher’s Exact test, ratio of cells excited to not excited, p = 0.002), and decreased firing rates in both Risk-Avoiders and Risk-Takers (Fisher’s Exact tests, ratio of cells inhibited to not inhibited; Risk-Avoiders: p = 0.0327; Risk-Takers: p = 0.0089). C)Representations of cells excited (orange), inhibited (dark blue), or exhibiting no change (black/white) in response to acute drug administration (Z-scores used for response classification [excited, 2.58; inhibited, −1.96]; cells with firing rates >20 Hz not shown [Saline = 3, Risk-Takers = 1]). On the final drug administration day, morphine failed to suppress PL cell firing rates beyond what was observed after saline administration (Fisher’s Exact tests, ratio of cells inhibited to not inhibited; Risk-Avoiders: p = 1.000; Risk-Takers: p = 0.156). However, in Risk-Avoiders, increased PL cell firing rates in response morphine administration were maintained relative to animals that were administered saline (Fisher’s Exact test, ratio of cells excited to not excited, p = 0.0091) D) Example waveforms and spike raster plots (5s samples from 300s to 305s during recordings) of two representative cells, one from either group, during baseline and after saline or morphine administration on Day 2 (no change cell from Saline group; inhibited cells from Risk-Avoider and Risk-Taker groups). Numbers to the right of spike raster plots denote the quantity of spikes shown. E) Relative percentages of cells on Day 2 that were inhibited (Fisher’s Exact tests, RAs vs. saline: p = 0.033, RTs vs. saline: p = 0.009, RAs vs. RTs: p = 0.84), excited (Fisher’s Exact test, RAs vs. saline: p = 0.002, RTs vs. saline: p = 0.31, RAs vs RTs: p = 0.09), or exhibited no change in response to saline or morphine administration (*p < 0.05). F) Example waveforms and spike raster plots (5s samples from 300s to 305s during recordings) of two representative cells, one from either group, during baseline and after saline or morphine administration on Day 10 (no change cells from Saline and Risk-Taker groups; excited cell from Risk-Avoider group). Numbers to the right of spike raster plots denote the quantity of spikes shown. G) Relative percentages of cells on Day 10 that were excited, inhibited, or exhibited no change in response to saline or morphine administration. Injections failed to result in significant inhibition (Fisher’s Exact tests, RAs vs. saline: p = 1.0, RTs vs. saline: p = 0.16, RAs vs. RTs: p = 0.29), but continued to result in significant excitation solely in the Risk-Avoider group (Fisher’s Exact tests, RAs vs. saline: p = 0.009, RTs vs. saline: p = 0.25, *p = 0.0091).
Figure 4.
Figure 4.. The PL neurons of Risk-Takers exhibit enhanced spatial representation of the drug-paired side during conflict.
A) Schematics summarizing the data analysis pipeline used to determine spatially-defined firing of PL neurons in the CPP apparatus. I) Head positions of rats in the apparatus during the preference and conflict tests were tracked using DeepLabCut pose estimation software. II) For each test video, the apparatus was segmented into 72 spatial bins and the amount of time each animal spent in each bin was calculated (gray bins are those which the animal did not enter during the test). III) The mean firing rate for each PL neuron was calculated when the animal’s head was located in each spatial bin (gray bins are those which the animal was present for less than 5 video frames). IV) The firing rates for each neuron in each spatial bin were normalized to the average firing rate of the same cell during the entire session to determine response classification (excited, Z-score >2.58, p<0.01; inhibited, Z-score < −1.96, p<0.05). B) Plots showing the percentages of PL cells within each group that responded with significant firing rate changes in specific spatial bins of the apparatus during the preference and conflict tests. Neurons responding in more than one spatial bin are included in the quantification. C) Percentages of PL cells that exhibited significant firing rate changes (inhibited or excited) in any spatial bin within the paired side of the apparatus during the preference or conflict tests. Risk-Takers exhibited an increase in the percentage of paired side-responsive PL cells during the conflict test (Fisher’s Exact tests, ratio of responsive cells to non-responsive cells, preference test vs. conflict test, Saline: p = 0.552, RA: p = 0.454, RT: p = 0.021), and this percentage was greater than either Saline or Risk-Avoider rats (Chi-square test, $p = 0.035). D) Percentages of PL cells that significantly decreased their firing rates in any spatial bin within the paired side of the apparatus during the preference or conflict tests. Risk-Takers exhibited an increase in the percentage of paired side-inhibited PL cells during the conflict test (Fisher’s Exact tests, ratio of inhibited cells to non-inhibited cells, preference test vs. conflict test, Saline: p = 0.807, RA: p = 0.398, RT: p = 0.032). Saline-treated rats displayed a smaller proportion of paired side-inhibited PL cells during the conflict test than either Risk-Avoiders or Risk-Takers (Chi-square test, preference test: p = 0.253, conflict test: $p = 0.036). E) Percentages of PL cells that significantly increased their firing rates in any spatial bin within the paired side of the apparatus during the preference or conflict tests. None of the three groups showed changes in the proportion of paired side-excited PL cells between the preference and conflict tests (Fisher’s Exact tests, ratio of excited cells to non-excited cells, preference test vs. conflict test, Saline: p = 0.911, RA: p = 0.312, RT: p = 0.103), nor changes between groups during the preference or conflict tests (Chi-square tests, preference test: p = 0.518, conflict test: p = 0.191). F) Single-cell examples from each of the three groups showing spatially-constrained firing properties during the preference test (top row) and conflict test (bottom row; gray bins are those which the animal was present for less than 5 video frames).
Figure 5.
Figure 5.. PL neurons of Risk-Takers show persistent inhibitory responses upon initiating exploration of the drug-paired side during conflict.
A) Schematic diagram showing the behavior (paired-side head entries) to which neuronal activity was aligned for the following analyses. B) Percentages of cells identified from recordings from each group that were included in Clusters 1 through 7 after spectral clustering. A larger proportion of PL cells in morphine-treated rats (Risk-Avoiders and Risk-Takers) exhibited paired side entry responses consistent with Cluster 2 compared to Saline-treated rats (Fisher’s Exact test, saline vs. morphine: p = 0.038). C) Single-unit peri-event raster plots and D) mean peri-event time histograms showing firing rate changes of PL cells relative to paired-side entries in the preference and conflict tests. All data shown as Z-scores. E) Percentages of cells showing excitation (Z-score > 2.58), inhibition (Z-score < −1.96), or no response to paired side entries during the preference test (saline-treated group, n = 9 rats: 39/162 [24%] cells excited, 30/162 [19%] cells inhibited; RA group, n = 6 rats: 10/72 [14%] cells excited, 11/72 [15%] cells inhibited; RT group, n = 7 rats: 14/95 [15%] cells excited, 9/95 [9%] cells inhibited; Fisher’s Exact tests, RAs vs. saline: p = 0.059, RTs vs. saline: p = 0.0031, RAs vs. RTs: p = 0.48). F–H) Graphs representing firing rate changes of PL cells in Saline (F; n = 9 rats), Risk-Avoider (G; n = 6 rats), and Risk-Taker (H; n = 7 rats) groups that showed excitatory spontaneous activity (Z-score > 2.58) when animals crossed into the paired side during the preference test (orange) compared to firing rates of the same cells when animals crossed into the paired side during the conflict test (charcoal). Inset bar graphs show differences in the total areas under the curves between test stages 500 msec before and after line crossings (*p < 0.05). PL neurons that responded to paired side entries during the preference test with increased firing rates did not respond to paired side entries during the conflict test in Saline-treated rats (AUC: Shapiro-Wilk normality test, p < 0.0001; Wilcoxon test, p = 0.013), Risk-Avoiders (AUC: Shapiro-Wilk normality test, p < 0.01; Wilcoxon test, p = 0.027) or Risk-Takers (AUC: paired Student’s t-test, p = 0.0013). I–K) Graphs representing firing rate changes of PL cells in Saline (I; n = 9 rats), Risk-Avoider (J; n = 6 rats, AUC), and Risk-Taker (K; n = 7 rats) groups that showed inhibitory spontaneous activity (Z-score < −1.96) when animals crossed into the paired side during the preference test (dark blue) compared to firing rates of the same cells when animals crossed into the paired side during the conflict test (charcoal). Inset bar graphs show differences in the total areas under the curves between test stages 500 msec before and after line crossings (*p < 0.05). PL neurons that responded to paired side entries during the preference test with decreased firing rates did not respond to paired side entries during the conflict test in either Saline-treated rats (AUC: Shapiro-Wilk normality test, p < 0.01; Wilcoxon test, p = 0.0002) or Risk-Avoiders (AUC: Shapiro-Wilk normality test, p < 0.01; Wilcoxon test, p = 0.032). However, in Risk-Takers, inhibited paired side entry-responsive PL cells showed similar spatial firing rate changes during both the preference and conflict tests (AUC: Shapiro-Wilk normality test, p < 0.01; Wilcoxon test, p = 0.73). Data are shown as median ± interquartile range for Wilcoxon tests (F–G, I–K) and mean ± SEM for paired Student’s t-test (H).

Similar articles

References

    1. Anderson EM, Engelhardt A, Demis S, Porath E, Hearing MC (2021) Remifentanil self-administration in mice promotes sex-specific prefrontal cortex dysfunction underlying deficits in cognitive flexibility. Neuropsychopharmacol Off Publ Am Coll Neuropsychopharmacol 46:1734–1745. - PMC - PubMed
    1. Ballesteros-Yáñez I, Ambrosio E, Benavides-Piccione R, Pérez J, Torres I, Miguéns M, García-Lecumberri C, DeFelipe J (2007) The effects of morphine self-administration on cortical pyramidal cell structure in addiction-prone lewis rats. Cereb Cortex N Y N 1991 17:238–249. - PubMed
    1. Barattini AE, Montanari C, Edwards KN, Edwards S, Gilpin NW, Pahng AR (2023) Chronic inflammatory pain promotes place preference for fentanyl in male rats but does not change fentanyl self-administration in male and female rats. Neuropharmacology 231:109512. - PMC - PubMed
    1. Bardo MT, Rowlett JK, Harris MJ (1995) Conditioned place preference using opiate and stimulant drugs: A meta-analysis. Neurosci Biobehav Rev 19:39–51. - PubMed
    1. Barry D, Petry NM (2008) Predictors of Decision-Making on the Iowa Gambling Task: Independent Effects of Lifetime History of Substance Use Disorders and Performance on the Trail Making Test. Brain Cogn 66:243–252. - PMC - PubMed

Publication types