[Preprint]. 2024 Feb 8:2024.02.06.579143.
doi: 10.1101/2024.02.06.579143.

Spatially Exploring RNA Biology in Archival Formalin-Fixed Paraffin-Embedded Tissues

Affiliations

Spatially Exploring RNA Biology in Archival Formalin-Fixed Paraffin-Embedded Tissues

Zhiliang Bai et al. bioRxiv. .

Update in

Abstract

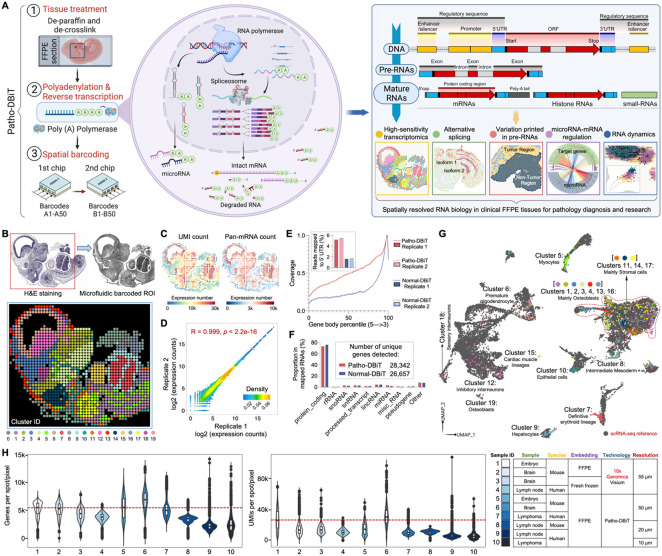
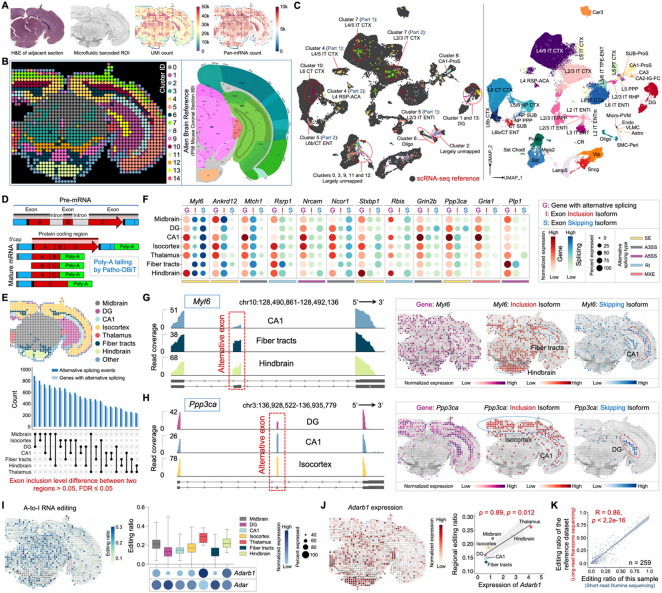
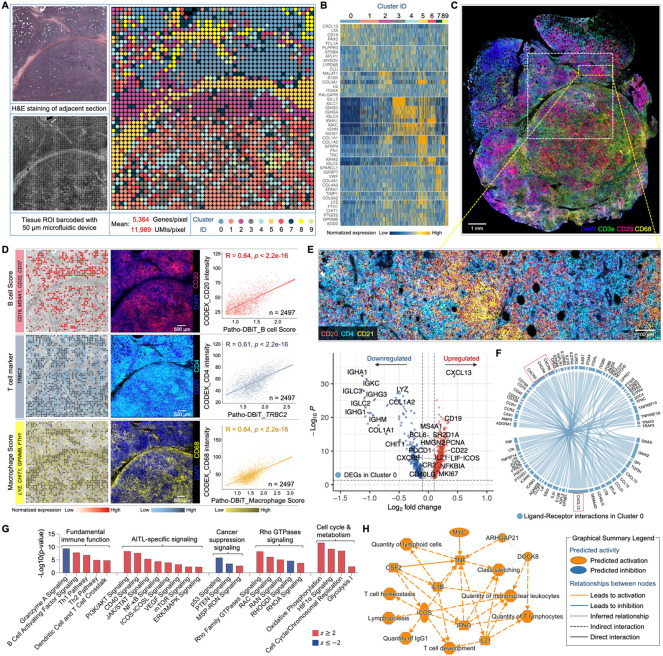
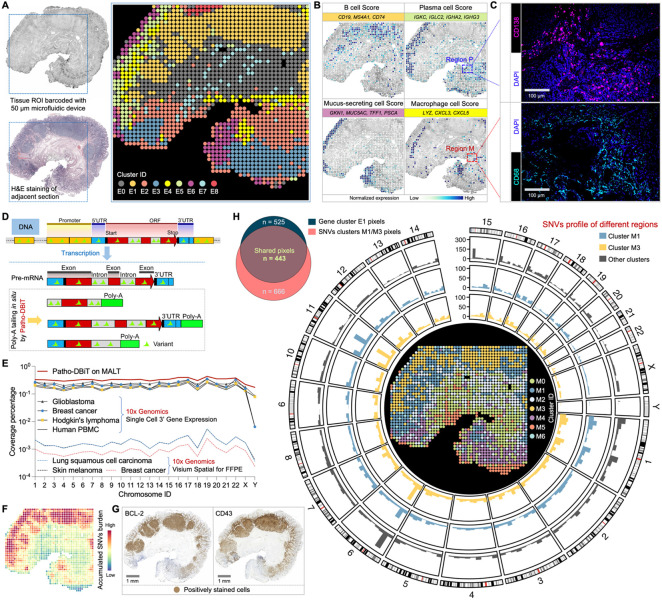
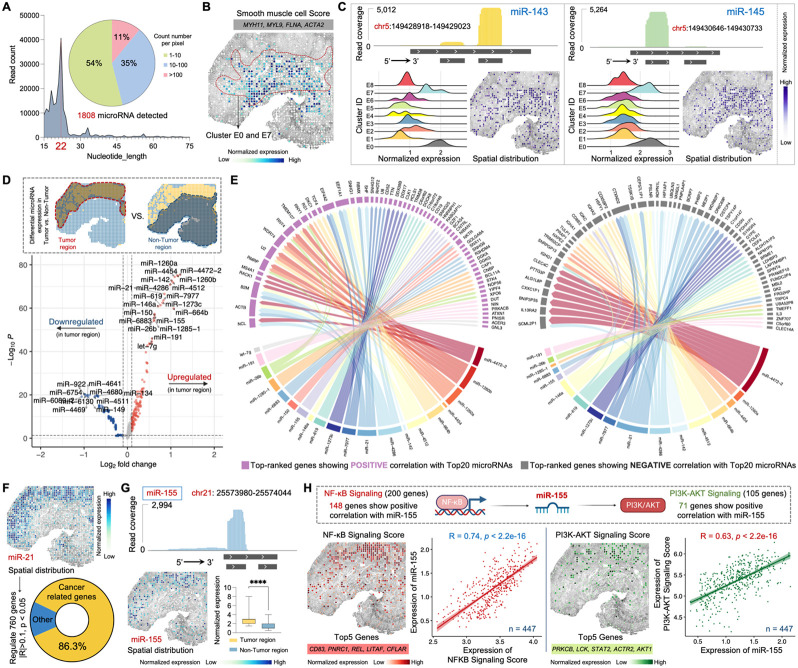
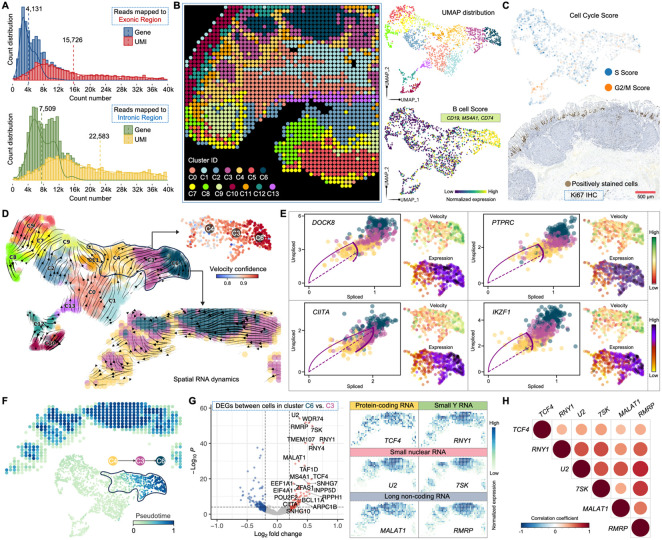
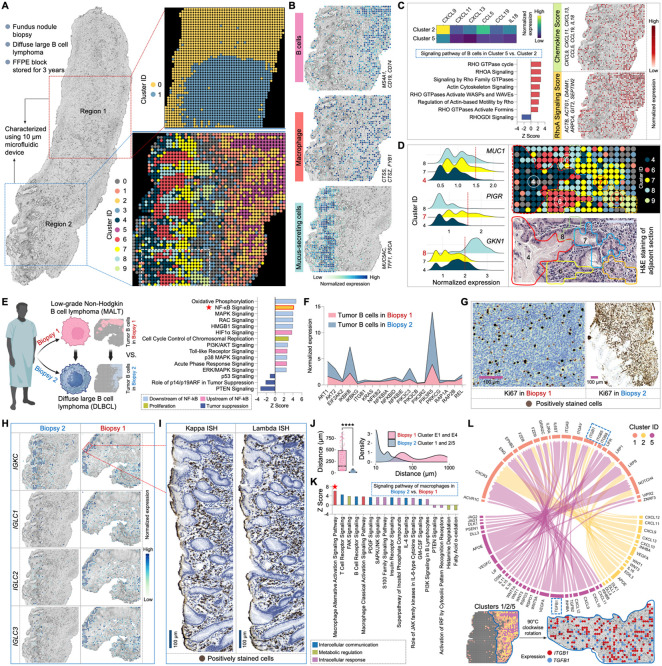
Spatial transcriptomics has emerged as a powerful tool for dissecting spatial cellular heterogeneity but as of today is largely limited to gene expression analysis. Yet, the life of RNA molecules is multifaceted and dynamic, requiring spatial profiling of different RNA species throughout the life cycle to delve into the intricate RNA biology in complex tissues. Human disease-relevant tissues are commonly preserved as formalin-fixed and paraffin-embedded (FFPE) blocks, representing an important resource for human tissue specimens. The capability to spatially explore RNA biology in FFPE tissues holds transformative potential for human biology research and clinical histopathology. Here, we present Patho-DBiT combining in situ polyadenylation and deterministic barcoding for spatial full coverage transcriptome sequencing, tailored for probing the diverse landscape of RNA species even in clinically archived FFPE samples. It permits spatial co-profiling of gene expression and RNA processing, unveiling region-specific splicing isoforms, and high-sensitivity transcriptomic mapping of clinical tumor FFPE tissues stored for five years. Furthermore, genome-wide single nucleotide RNA variants can be captured to distinguish different malignant clones from non-malignant cells in human lymphomas. Patho-DBiT also maps microRNA-mRNA regulatory networks and RNA splicing dynamics, decoding their roles in spatial tumorigenesis trajectory. High resolution Patho-DBiT at the cellular level reveals a spatial neighborhood and traces the spatiotemporal kinetics driving tumor progression. Patho-DBiT stands poised as a valuable platform to unravel rich RNA biology in FFPE tissues to study human tissue biology and aid in clinical pathology evaluation.


Conflict of interest statement

Declaration of Interest Z.B. and R.F. are inventors of a patent application related to this work. R.F. is scientific founder and adviser for IsoPlexis, Singleron Biotechnologies, and AtlasXomics. The interests of R.F. were reviewed and managed by Yale University Provost’s Office in accordance with the University’s conflict of interest policies. M.L.X. has served as consultant for Treeline Biosciences, Pure Marrow, and Seattle Genetics. Other authors declare no competing interests.

Figures

Figure 1.
Figure 1.. Patho-DBiT workflow, technical performance, and spatial mapping of mouse embryo
(A) Schematic workflow, molecular underpinnings, and technological spectrum of Patho-DBiT. Three major steps include (1) FFPE tissue de-paraffinization and de-crosslink, (2) Enzymatic in situ polyadenylation and reverse transcription, (3) Spatial barcoding using a pair of microfluidic devices. Patho-DBiT utilizes poly(A) polymerase to add poly(A) tails to both A-tailed intact mRNA and non-A-tailed RNAs, enabling spatial characterization of molecules across the entire transcription process. Patho-DBiT demonstrates spatial profiling of high-sensitivity transcriptome, alternative splicing, variations printed in pre-RNAs, microRNAs, and RNA dynamics. (B) Patho-DBiT's performance and versatility on an E13 mouse embryo FFPE section. Top left: H&E staining of an adjacent section. Red square indicates the region of interest (ROI). Top right: tissue scanning post 50μm-microfluidic device barcoding. Bottom: unsupervised clustering identified 20 transcriptomic clusters, closely aligning with the H&E tissue histology. (C) Spatial pan-mRNA and UMI count maps. (D) Correlation analysis between replicates shows the high reproducibility of Patho-DBiT. Pearson correlation coefficient is indicated. (E) Read coverage along the gene body from 5' to 3’ and the percentage of reads mapped to the 5' UTR. Comparison involves two Patho-DBiT replicates with normal DBiT mapping without polyadenylation. (F) Comparison of the proportion of mapped RNA categories between Patho-DBiT and normal DBiT. Patho-DBiT demonstrates a similarly low level of mapped rRNA percentage compared to normal DBiT. (G) Integration of spatial RNA data with scRNA-seq mouse organogenesis data (Cao et al., Nature 2019). (H) Distribution of gene and UMI counts in different tissue types at varying spatial resolutions. Patho-DBiT is benchmarked against another sequencing-based spatial technology, Visium from 10x Genomics on both FFPE and fresh frozen tissues.
Figure 2.
Figure 2.. Spatial co-mapping of gene expression and RNA processing in the mouse brain
(A) Patho-DBiT profiling of an adult mouse C57BL/6 FFPE brain section. Left: H&E staining of an adjacent section. Middle: tissue scanning of the region of interest (ROI) post 50μm-microfluidic device barcoding. Right: spatial pan-mRNA and UMI count maps. (B) Unsupervised clustering identified 15 transcriptomically distinct clusters, and their distribution closely aligned with the region annotation of a corresponding coronal section from the Allen Mouse Brain Atlas (section 89, P56). (C) Integration of spatial RNA data with single-cell transcriptomics from cells in the mouse cortex and hippocampus (Yao et al., Cell 2021). (D) Molecular underpinnings of alternative splicing detection by Patho-DBiT. (E) Number of significant differentially spliced events and corresponding parental genes between each pair of two regions of the mouse brain. A splicing event is deemed significant if it exhibits an exon inclusion level difference > 0.05 between two regions, with a false discovery rate (FDR) of ≤ 0.05. (F) Dot plot showing the top-ranked 12 genes exhibiting significant regional differences in exon inclusion levels. Gene dot size corresponds to the percentage of pixels expressing the gene, while isoform dot size indicates the percentage of junction reads derived from the inclusion/skipping isoform over both isoforms. The color shade reflects the normalized expression level of each gene or isoform. (G and H) Junction read coverage of Myl6 (G) and Ppp3ca (H) splicing event in specific brain regions. Spatial expression patterns of the gene, exon inclusion isoform, and exon skipping isoform are shown. (I) Left: spatial variations in A-to-I RNA editing in the mouse brain. Right: distribution of editing ratio across all editing sites and the expression level of ADAR-encoding genes (Adarb1 and Adar) in different brain regions. Box whiskers show the minimum and maximum values. The dot size indicates the percentage of pixels expressing the gene, and the color shade represents normalized expression level. (J) Left: spatial Adarb1 expression. Right: correlation between the Adarb1 expression and the average reginal editing ratio across various brain regions. Spearman correlation coefficient = 0.89, p-value = 0.012. (K) Correlation between regional editing ratios detected by short-read Illumina sequencing-based Patho-DBiT and those detected by long-read Nanopore sequencing, as reported in the reference literature (Lebrigand et al., Nucleic Acids Research 2023). Analysis centered on 259 editing sites detected by both technologies, revealing a robust Pearson correlation coefficient of 0.86 (p-value < 2.2e-16).
Figure 3.
Figure 3.. High-sensitivity spatial transcriptomics of a AITL sample stored for five years
(A) Spatial transcriptome mapping of a subcutaneous nodule section from a patient diagnosed with AITL. The FFPE block has been stored at room temperature for five years before the Patho-DBiT assay. Left top: H&E staining of an adjacent section. Left bottom: tissue scanning post 50μm-microfluidic device barcoding. Right: unsupervised clustering revealed 10 distinct clusters, aligning closely with the H&E tissue histology. (B) Heatmap showing top ranked DEGs defining each cluster. (C) Spatial phenotyping of an adjacent section using the CODEX technology (Co-Detection by Indexing). White square indicates the region of interest (ROI) in (A). (D) Spatial distributions of B cells, T cells, and macrophages revealed by Patho-DBiT, exhibiting a strong Pearson correlation with the proteomic data generated from CODEX. Genes defining each module score are listed. (E) Top: CODEX data from the yellow square indicated area in (C) showing active expression of B cell marker (CD20), T follicular helper cell (Tfh) marker (CD4), and follicular dendritic cell marker (CD21). Bottom: Volcano plot of DEGs in Cluster 0 corresponding to the indicated region. (F) Ligand-receptor interactions within Cluster 0. The distinctive communication pattern between CXCL13 and its receptor genes (CXCR3, CXCR4, and CXCR5) is indicated. Edge thickness is proportional to correlation weights. (G) Corresponding canonical signaling pathways regulated by the DEGs in Cluster 0. z score is computed and used to reflect the predicted activation level (z>0, activated; z<0, inhibited; z≥2 or z≤−2 can be considered significant). (H) Graphical network of canonical pathways, upstream regulators, and biological functions regulated by DEGs identified in Cluster 0.
Figure 4.
Figure 4.. Patho-DBiT enables spatial variant profiling for tumor discrimination
(A) Spatial transcriptome mapping of a gastric antrum biopsy section from a patient diagnosed with extranodal marginal zone lymphoma of mucosa-associated lymphoid tissue (MALT). The FFPE block was stored at room temperature for three years. Left top: tissue scanning with region of interest (ROI) indicated with blue square. Left bottom: H&E staining of an adjacent section. Right: unsupervised clustering revealed 9 distinct clusters, aligning closely with the H&E tissue histology. (B) Spatial identification of representative cell types through curated expression of canonical genes. Genes defining each module score are listed. (C) Patho-DBiT's ability to capture rare cell types in specific regions was cross-validated through immunofluorescence (IF). The IF staining of plasma cell marker (CD138) and macrophage marker (CD68) in the selected Region P and Region M in (B) was shown. (D) Molecular underpinnings of detecting variations printed in pre-mRNA transcripts by Patho-DBiT. (E) Comparison of genomic location coverage bandwidth between Patho-DBiT and other technologies. (F) Spatial expression map of accumulated single nucleotide variants (SNVs) burden. (G) Immunohistochemistry (IHC) staining of canonical markers commonly used for detecting MALT tumor cells (BCL-2 and CD43) on adjacent sections. (H) Unsupervised clustering of the spatial SNV matrix. Left: Veen plot showing the pixel overlap between gene cluster E1 and SNV clusters M1 and M3. Right: genome-wide distribution of somatic variations in clusters M1 and M3 using pixels from the other clusters as controls. Only high-confidence variant loci were preserved for downstream analysis and visualization.
Figure 5.
Figure 5.. Spatial microRNA-mRNA regulatory network in the MALT section
(A) MicroRNAs detected by Patho-DBiT in the MALT section, with the count of mapped reads peaking at 22 nucleotides. The pie chart illustrates the percentage distribution of the detected count number per spatial pixel. (B) Spatial distribution of the Smooth muscle cell Score. Genes defining this module score are listed. (C) Spatial mapping of smooth muscle cell specific miR-143 and miR-145. The read coverage mapped to the reference genome location, expression proportion in each identified cluster, and spatial distribution are shown. (D) Volcano plot showing differentially expressed microRNAs between the tumor and non-tumor regions. (E) Regulatory network between the top 20 upregulated microRNAs and the gene expression in the tumor region. Genes with the highest rankings, demonstrating positive or negative correlations with the microRNAs, were separately illustrated. Edge thickness is proportional to correlation weights. (F) Spatial expression map of the oncomiR miR-21. This microRNA significantly regulates 760 genes (Pearson R > 0.1 or < −0.1, p-value < 0.05). Cancer-related genes are defined based on the IPA data base. (G) Spatial expression map of the B-cell lymphoma enriched miR-155. Top: read coverage mapped to the reference genome location. Bottom left: spatial distribution. Bottom right: expression comparison between tumor and non-tumor regions. Box whiskers show the minimum and maximum values. Significance level was calculated with two-tailed Mann-Whitney test, **** P < 0.0001. (H) Spatial interactions involving mir-155 and its upstream and downstream signaling pathways. Top 5 genes defining each module score are listed. The Pearson correlation between mir-155 expression and both signaling pathways was calculated across 447 spatial pixels within the tumor region.
Figure 6.
Figure 6.. Tumor differentiation trajectory revealed by spatial RNA splicing dynamics
(A) Distribution of detected gene/UMI counts per spatial pixel from reads mapped to exonic or intronic region. The dashed lines indicate average level of gene or UMI count in the MALT section. (B) Unsupervised clustering of the combined exonic and intronic expression matrix. The analysis identified 14 clusters, showcasing UMAP visualization and featured expression of the B cell Score in clusters C3, C4, and C6. Genes defining this module score are listed. (C) Top: cell cycle score colored by the S or G2/M stage. Bottom: IHC staining for Ki67 in the tumor region of an adjacent section. (D) Velocities derived from the dynamical RNA splicing activities are visualized as streamlines in a UMAP-based embedding. The coherence of the velocity vector field provides a measure of confidence, and the spatial velocity pattern within the tumor B cells region is highlighted. (E) Phase portraits showing the ratio of unspliced and spliced RNA for top-ranked genes driving the dynamic flow from cluster C4 to C6, along with their expression and velocity level within the three tumor clusters. The dashed purple line corresponds to the estimated splicing steady state. Positive velocity signifies up-regulation of a gene, observed when cells exhibit a higher abundance of unspliced mRNA for that gene than expected in steady state. Conversely, negative velocity indicates down-regulation of the gene. (F) Spatial pseudotime of underlying cellular processes based on the transcriptional dynamics. A discernible change is evident exclusively within the three tumor clusters, where a higher pseudotime number denotes a later differentiation stage. (G) Volcano plot showing DEGs between cluster C6 and C3. Signature large and small RNAs associated with increased dynamic activities are spatially visualized. (H) Correlation matrices of the signature RNAs evaluated in G. Only significant correlations (p-value < 0.05) are represented as dots. Pearson’s correlation coefficients from comparisons of RNA expression across pixels in the tumor region are visualized by color intensity.
Figure 7.
Figure 7.. Cellular level spatial mapping of a DLBCL section elucidates tumor progression
(A) Spatial transcriptome mapping of fundus nodule biopsy sections collected from the same patient depicted in Figure 4 (A) at the same time. The diagnosis progressed from low-grade MALT to DLBCL in this subsequent biopsy. Left: sections from two different regions underwent 10μm-microfluidic device spatial barcoding. Right top: unsupervised clustering of Region 1 identified two clusters. Right bottom: unsupervised clustering of Region 2 revealed 10 transcriptomically distinct subpopulations. (B) Spatial characterization of representative cell types based on the expression of signature gene. Genes defining each module score are listed. (C) Spatial heterogeneities and interactions among tumor B cells. Left top: comparative analysis of chemokine gene expression between clusters 2 and 5. Left bottom: signaling pathways regulated by DEGs between cluster 2 vs. cluster 5. Right: spatial distribution of the Chemokine Score and RhoA Signaling Score. Genes defining each module score are listed. (D) Cellular-level spatial mapping unveils a distinct transcriptomic neighborhood. Left: comparative analysis of gastric mucus-secreting cell related gene expression between clusters 4, 7, and 8. Right top: enlarged transcriptomic neighborhood highlighted by white square in (A). Right bottom: tissue morphology of the corresponding area defined by H&E staining of an adjacent section. (E) Spatial analysis elucidates the molecular dynamics driving tumor progression. Left: schematic illustration showing comparative analysis. Right: signaling pathways regulated by DEGs between tumor B cells in DLBCL vs. MALT biopsy, revealing a significant upregulation of NF-κB signaling and its associated upstream and downstream pathways. (F) Expression comparison of key genes involved in the NF-κB signaling between DLBCL vs. MALT biopsy. (G) IHC staining for Ki67 on adjacent sections from the two biopsies. (H) Spatial expression mapping of genes encoding plasma cell kappa and lambda chains in the two biopsies. (I) ISH staining for kappa and lambda chain mRNA in the designated area in (H). (J) Distance distribution between macrophages and tumor B cells in the two biopsies. Significance level was calculated with two-tailed Mann-Whitney test, **** P < 0.0001. (K) Signaling pathways regulated by DEGs between macrophages in DLBCL vs. MALT biopsy, revealing a significant upregulation of macrophage alternative activation signaling and its associated pathways. (L) Ligand-receptor interactions between macrophage cluster 1 and tumor B cell clusters 2 and 5. The distinctive communication pattern of TGF-β (TGFB1) and the integrin family (ITGB1, ITGB5, and ITGB8) is indicated and spatially visualized. Edge thickness is proportional to correlation weights. In (C), (E) and (K), z score is computed and used to reflect the predicted activation level (z>0, activated; z<0, inhibited; z≥2 or z≤−2 can be considered significant).

References

    1. Baysoy A., Bai Z., Satija R., and Fan R. (2023). The technological landscape and applications of single-cell multi-omics. Nat Rev Mol Cell Biol 24, 695–713. 10.1038/s41580-023-00615-w. - DOI - PMC - PubMed
    1. Park Y.M., and Lin D.C. (2023). Moving closer towards a comprehensive view of tumor biology and microarchitecture using spatial transcriptomics. Nat Commun 14, 7017. 10.1038/s41467-023-42960-6. - DOI - PMC - PubMed
    1. Yu Q., Jiang M., and Wu L. (2022). Spatial transcriptomics technology in cancer research. Front Oncol 12, 1019111. 10.3389/fonc.2022.1019111. - DOI - PMC - PubMed
    1. Noh K.W., Buettner R., and Klein S. (2021). Shifting Gears in Precision Oncology-Challenges and Opportunities of Integrative Data Analysis. Biomolecules 11. 10.3390/biom11091310. - DOI - PMC - PubMed
    1. Harries L.W. (2019). RNA Biology Provides New Therapeutic Targets for Human Disease. Front Genet 10, 205. 10.3389/fgene.2019.00205. - DOI - PMC - PubMed

Publication types