[Preprint]. 2024 Feb 11:2024.02.09.24302395.
doi: 10.1101/2024.02.09.24302395.

Localized high-risk prostate cancer harbors an androgen receptor low subpopulation susceptible to HER2 inhibition

Affiliations

Localized high-risk prostate cancer harbors an androgen receptor low subpopulation susceptible to HER2 inhibition

Scott Wilkinson et al. medRxiv. .

Update in

  • Localized high-risk prostate cancer harbors an androgen receptor activity-low subpopulation susceptible to HER2 inhibition.
    Wilkinson S, Ku AT, Lis RT, King IM, Low D, Trostel SY, Bright JR, Terrigino NT, Baj A, Summerbell ER, Heyward KE, Kartal S, Fenimore JM, Li C, Singler C, Vo B, Jansen CS, Ye H, Whitlock NC, Harmon SA, Carrabba NV, Atway R, Lake R, Takeda DY, Kissick HT, Pinto PA, Choyke PL, Turkbey B, Dahut WL, Karzai F, Sowalsky AG. Wilkinson S, et al. J Clin Invest. 2025 Sep 4;135(22):e189900. doi: 10.1172/JCI189900. eCollection 2025 Nov 17. J Clin Invest. 2025. PMID: 40906535 Free PMC article. Clinical Trial.

Abstract

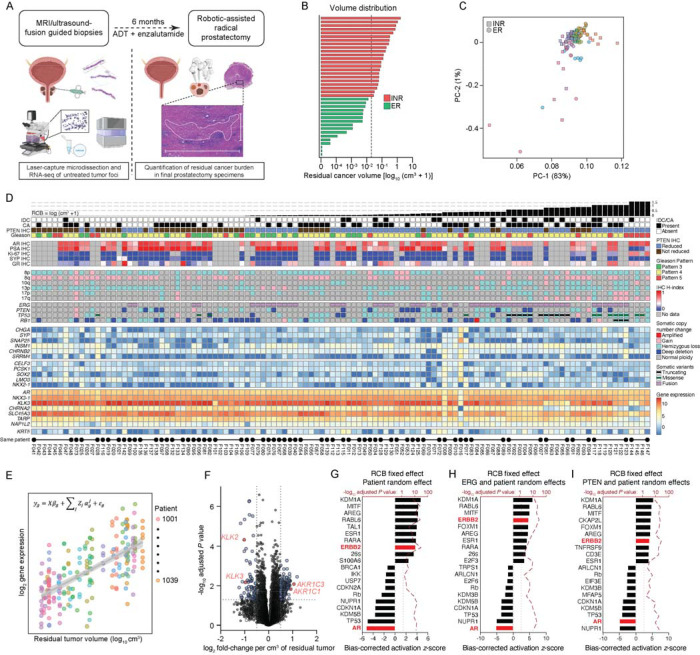
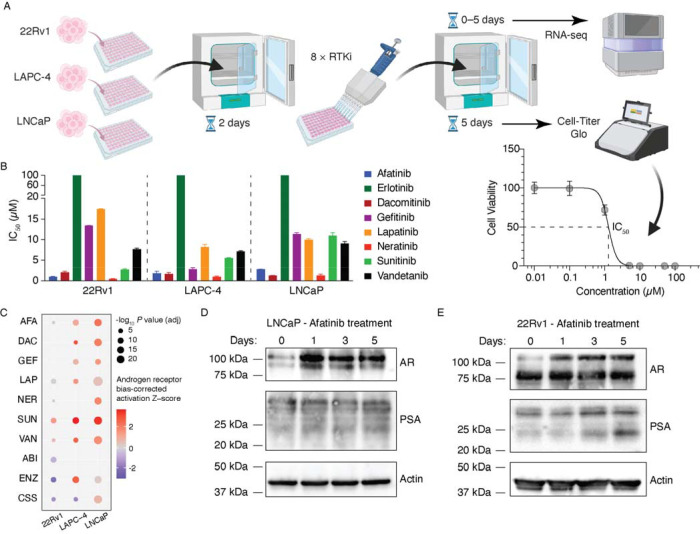
Patients diagnosed with localized high-risk prostate cancer have higher rates of recurrence, and the introduction of neoadjuvant intensive hormonal therapies seeks to treat occult micrometastatic disease by their addition to definitive treatment. Sufficient profiling of baseline disease has remained a challenge in enabling the in-depth assessment of phenotypes associated with exceptional vs. poor pathologic responses after treatment. In this study, we report comprehensive and integrative gene expression profiling of 37 locally advanced prostate tumors prior to six months of androgen deprivation therapy (ADT) plus the androgen receptor (AR) inhibitor enzalutamide prior to radical prostatectomy. A robust transcriptional program associated with HER2 activity was positively associated with poor outcome and opposed AR activity, even after adjusting for common genomic alterations in prostate cancer including PTEN loss and expression of the TMPRSS2:ERG fusion. Patients experiencing exceptional pathologic responses demonstrated lower levels of HER2 and phospho-HER2 by immunohistochemistry of biopsy tissues. The inverse correlation of AR and HER2 activity was found to be a universal feature of all aggressive prostate tumors, validated by transcriptional profiling an external cohort of 121 patients and immunostaining of tumors from 84 additional patients. Importantly, the AR activity-low, HER2 activity-high cells that resist ADT are a pre-existing subset of cells that can be targeted by HER2 inhibition alone or in combination with enzalutamide. In summary, we show that prostate tumors adopt an AR activity-low prior to antiandrogen exposure that can be exploited by treatment with HER2 inhibitors.


Conflict of interest statement

Competing interests H.Y. and R.T.L. perform consulting in an advisory role for Janssen Pharmaceuticals. A.G.S. reports that the National Cancer Institute (NCI) has a Cooperative Research and Development Agreement (CRADA) with Astellas. Resources are provided by this CRADA to the NCI. A.G.S. gets no personal funding from this CRADA but is the primary investigator of the CRADA. The remaining authors declare no conflicts of interest.

Figures

Figure 1.
Figure 1.. Integrated molecular landscape of prostate tumors prior to neoadjuvant intense androgen deprivation therapy.
(A) Schematic of workflow in which laser capture microdissection and RNA-seq of tumor foci from image-guided baseline biopsies (left) are used to assess gene expression differences that track with posttreatment pathologic tumor volumes (right). (B) Distribution of residual cancer burden (RCB, one row per patient) plotted on a logarithmic x-axis with a pseudocount (cm3 + 1). Green bars represent exceptional responders (ER) and red bars represent incomplete and nonresponders (INR) who harbored residual tumor volumes greater than 0.05 cm3. (C) Principal component analysis of 147 baseline tumor foci transcriptomes. Each dot is colored by patient, with squares representing foci from INR patients and circles representing foci from ER patients. (D) Heatmap and oncoprint depicting molecular and histologic features of baseline tumors where each column represents one laser capture microdissected tumor focus subjected to whole-transcriptome sequencing. Identical values are given IHC profiling performed on a single tissue that was subdivided for sequencing. Black bars at the bottom indicate multiple samples from the same patient. Samples are ranked from left-to-right by patient-level residual cancer burden (RCB) volumes. (E) Linear mixed-effect model depicting variance in gene expression across samples within each patient (by color) vs. RCB (x-axis), showing gene expression pattern for positively-correlating genes. (F) Volcano plot depicting differentially-expressed genes (DEGs) determined using a linear mixed-effect model using RCB as a fixed effect and each patient as a random effect. Horizontal boundary depicts the P = 0.05 (adjusted) cutoff, and vertical boundaries demarcate genes with a fold-change of at least ±2. DEGs are quantified as fold-change per unit of post-treatment tumor volume (in cm3) where genes to the right are more expressed at baseline in tumors with higher volumes and genes to the left are less expressed. (G-I) All statistically significant DEGs (Padj < 0.05) from the linear mixed-effect model were processed with the upstream regulator module of Ingenuity Pathway Analysis. The ten most activated and inactivated pathways (with adjusted P values less than 0.05) are shown for DEG analyses in which (G) patients were the only random effect, (H) patients and ERG status were random effects, and (I) patients and PTEN status were random effects. The bias-corrected z score is shown on the bottom x axis and the adjusted P value is shown on the top x axis (−log10 transformed).
Figure 2.
Figure 2.. HER2 protein is expressed at baseline in tumor foci that resist therapy and is retained posttreatment.
(A) Representative micrographs of anti-HER2 and anti-pHER2 IHC in baseline biopsies and residual tumor foci, showing examples from three patients with matched samples. Bar: 50 μm. (B) Heatmaps summarizing semi-quantitative analysis of anti-HER2 and anti-pHER2 immunohistochemistry (IHC) performed on entire sections of biopsies and posttreatment surgical specimens. Rows are grouped by patient. (C-F) Density plots summarizing the frequency distribution of IHC semi-quantitative analysis, per patient, of baseline biopsies (C-D) or of posttreatment prostatectomy specimens (E-F) with antibodies against HER2 (C,E) and pHER2 (D,F). (G-H) Scatter plots showing the association of per-patient HER2 (G) or pHER2 (H) baseline H-scores (x-axis) with posttreatment H-scores (y-axis). Statistical significance determined using Spearman’s rank correlation. Line and gray shaded area show the linear regression line and 95% confidence interval for the regression. (I-J) Density plots of HER2 (I) and pHER2 (J) baseline semi-quantitative IHC, stratified by pathologic response in the final surgical specimens with exceptional responders in green and incomplete/nonresponders in red. Statistical significance determined using χ-squared test. Inv: invasive; IDC: intraductal carcinoma; memb: membranous; cyto: cytosolic.
Figure 3.
Figure 3.. Prostate cancer cell lines recapitulate patterns of enzalutamide resistance observed in patients.
(A-C) Statistically significant DEGs (Padj < 0.05) that were correlated with the “AR Hallmarks” mSigDB geneset processed by single-sample GSVA were analyzed with the upstream regulator module of Ingenuity Pathway Analysis for (A) our original neoadjuvant ADT plus enzalutamide cohort, (B) 123 tumors from the Prostate Cancer Biorepository Network (PCBN) and the (C) prostate cancer TCGA. A linear mixed-effect model was employed with the neoadjuvant cohort in (A) modeling repeated measures from patients as random effects. The ten most activated and inactivated pathways (with adjusted P values less than 0.05) are shown. (D-E) Publicly available data from the Broad DepMap is shown, in which AR-positive cell lines are depicted in blue and AR-negative cell lines depicted in red. Gene expression were summarized using single-sample GSVA for AR and HER2 activity signatures from mSigDB (D), and cell death (sensitivity) were plotted to compare matched enzalutamide sensitivity or ERBB2 RNAi survival scores (E). (F-J) Publicly accessible single-cell gene expression data from LNCaP cells treated with antiandrogen (F-G) were downloaded and normalized together. (G-I) UMAP projections of each treatment condition individually (G), clustered by differential expression (H), and overlaid, colored by treatment condition (I). Following trajectory and pseudobulk differential expression analysis, statistically significant DEGs (Padj < 0.05) in the “resistant” clusters were analyzed with the upstream regulator module of Ingenuity Pathway Analysis. The ten most activated and inactivated pathways (with adjusted P values less than 0.05) are shown.
Figure 4.
Figure 4.. HER2 inhibition selects for prostate cancer cells with greater AR activity.
(A) Schematic depiction of in vitro screening of 22Rv1, LAPC-4 and LNCaP cells with eight different receptor tyrosine kinase inhibitors (RTKi). (B) Half-maximal inhibitory concentrations (IC50 values) are shown for each RTKi used, per cell line. Values depict the average value derived from at least three dose response curves derived for the individual lots of each RTKi that was used. (C) Each cell line was treated with the indicated RTKi, abiraterone (ABI), or enzalutamide (ENZ) at the IC50 derived for that lot of drug. Charcoal stripped serum (CSS) was used in place of FBS (see methods) in cell culture media. Treatments were performed over a 5-day time course and samples were acquired days 0, 1, 3 and 5. RNA extracted from each sample (performed in duplicate) was subjected to whole-transcriptome sequencing, with differentially expressed genes (correlating with time) processed using the upstream regulator module of Ingenuity Pathway Analysis. (D-E) Western blots depicting protein levels of LNCaP cells (D) and 22Rv1 cells (E) treated with afatinib (at its empirically determined IC50) for 0–5 days. Blots shown are representative of at least three independent experiments. Actin is shown as a loading control.
Figure 5.
Figure 5.. Prostate cancer cells expressing high levels of HER2 are distinct from tumor cells with high levels of AR activity.
(A) Flow cytometry of four human prostate cancer organoids treated with 10 μM ABT-373 to identify the gates for apoptotic and nonapoptotic cells. The pathologic grade group of each of the organoid models (183, 187, 188 and 190) is also shown. (B) Flow cytometry of the same four human prostate cancer organoids as in (A), treated with DMSO, 1 μM neratinib, 3 μM neratinib or 5 μM neratinib for 48 hours. The gates defined in (A) were used to identify the apoptotic and nonapoptotic cells. (C) Bar graph showing the proportion of nonapoptotic cells measured in (B). (D) LNCaP cells were treated with either enzalutamide or afatinib ± enzalutamide, (at their respective IC20) for five days. Cell viability was measured using Cell-Titer Glo. Data shown is the average of two experiments. (E) LNCaP cells were treated with enzalutamide, afatinib ± enzalutamide, or neratinib ± enzalutamide for five days. Cell viability was measured using Cell-Titer Glo. Data shown is the median of at least three replicate experiments. Error bars 95% confidence interval for experiments with at least 5 replicates. Statistical significance was measured using a repeated-measures ANOVA test with Bonferroni adjustment for multiple comparisons. (F) Multiplex immunofluorescent micrographs (taken at 20 × magnification) of three representative human prostate tumors stained with HER2 (green), PSA (pink) and AR (purple).

References

    1. Haffner M.C., et al. , Genomic and phenotypic heterogeneity in prostate cancer. Nat Rev Urol, 2020. - PMC - PubMed
    1. Ye H. and Sowalsky A.G., Molecular correlates of intermediate- and high-risk localized prostate cancer. Urol Oncol, 2018. 36(8): p. 368–374. - PMC - PubMed
    1. Moris L., et al. , Benefits and Risks of Primary Treatments for High-risk Localized and Locally Advanced Prostate Cancer: An International Multidisciplinary Systematic Review. Eur Urol, 2020. 77(5): p. 614–627. - PubMed
    1. Jones C.U., et al. , Radiotherapy and short-term androgen deprivation for localized prostate cancer. N Engl J Med, 2011. 365(2): p. 107–18. - PubMed
    1. Spratt D.E., et al. , Androgen Receptor Upregulation Mediates Radioresistance after Ionizing Radiation. Cancer Res, 2015. 75(22): p. 4688–96. - PMC - PubMed

Publication types