

Alteration of bacterial community composition in the sediments of an urban artificial river caused by sewage discharge
- PMID: 38371377
- PMCID: PMC10874175
- DOI: 10.7717/peerj.16931
Alteration of bacterial community composition in the sediments of an urban artificial river caused by sewage discharge
Abstract
Background: Urbanization has an ecological and evolutionary effect on urban microorganisms. Microorganisms are fundamental to ecosystem functions, such as global biogeochemical cycles, biodegradation and biotransformation of pollutants, and restoration and maintenance of ecosystems. Changes in microbial communities can disrupt these essential processes, leading to imbalances within ecosystems. Studying the impact of human activities on urban microbes is critical to protecting the environment, human health, and overall urban sustainability.
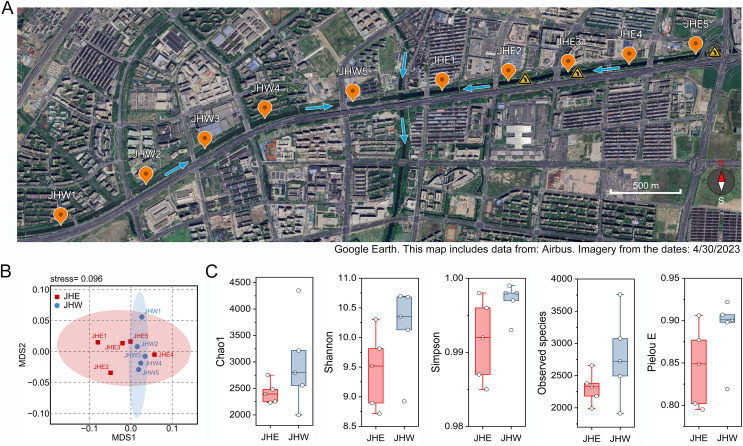
Methods: In this study, bacterial communities in the sediments of an urban artificial river were profiled by sequencing the 16S rRNA V3-V4 region. The samples collected from the eastern side of the Jiusha River were designated as the JHE group and were marked by persistent urban sewage discharges. The samples collected on the western side of the Jiusha River were categorized as the JHW group for comparative analysis.
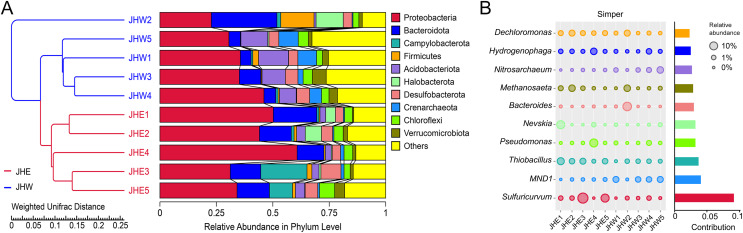
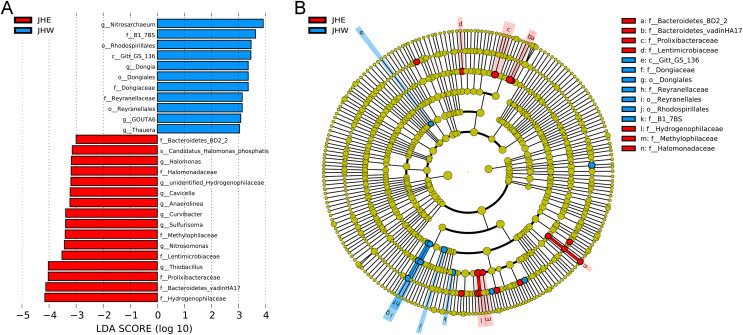
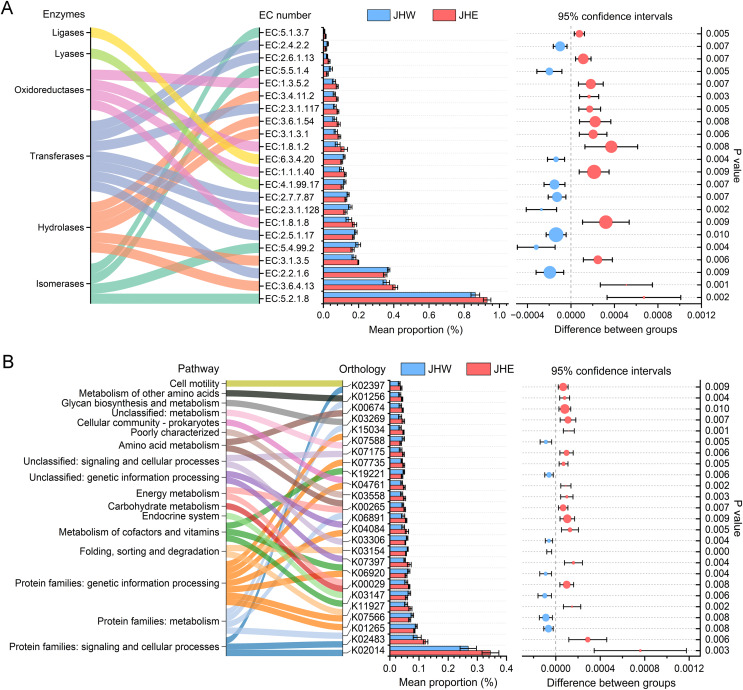
Results: The calculated alpha diversity indices indicated that the bacterial community in the JHW group exhibited greater species diversity and evenness than that of the JHE group. Proteobacteria was the most dominant phylum between the two groups, followed by Bacteroidota. The relative abundance of Proteobacteria and Bacteroidota accumulated in the JHE group was higher than in the JHW group. Therefore, the estimated biomarkers in the JHE group were divided evenly between Proteobacteria and Bacteroidota, whereas the biomarkers in the JHW group mainly belonged to Proteobacteria. The Sulfuricurvum, MND1, and Thiobacillus genus were the major contributors to differences between the two groups. In contrast to JHW, JHE exhibited higher enzyme abundances related to hydrolases, oxidoreductases, and transferases, along with a prevalence of pathways associated with carbohydrate, energy, and amino acid metabolisms. Our study highlights the impact of human-induced water pollution on microorganisms in urban environments.
Keywords: 16S rRNA gene; Bacterial community; Function prediction; River sediment; Urban microbes.
© 2024 Li et al.
Conflict of interest statement
Yishi Li and Xuchao Zhuang are employed by Focused Photonics (Hangzhou), Inc. Daoming Lou is employed by Hangzhou Urban Water Facilities and River Conservation Management Center.
Figures
References
-
- Akhtar N, Ishak MIS, Bhawani SA, Umar K. Various natural and anthropogenic factors responsible for water quality degradation: a review. Water. 2021;13(19):2660. doi: 10.3390/w13192660. - DOI
-
- Bolyen E, Rideout JR, Dillon MR, Bokulich NA, Abnet CC, Al-Ghalith GA, Alexander H, Alm EJ, Arumugam M, Asnicar F, Bai Y, Bisanz JE, Bittinger K, Brejnrod A, Brislawn CJ, Brown CT, Callahan BJ, Caraballo-Rodriguez AM, Chase J, Cope EK, Da Silva R, Diener C, Dorrestein PC, Douglas GM, Durall DM, Duvallet C, Edwardson CF, Ernst M, Estaki M, Fouquier J, Gauglitz JM, Gibbons SM, Gibson DL, Gonzalez A, Gorlick K, Guo J, Hillmann B, Holmes S, Holste H, Huttenhower C, Huttley GA, Janssen S, Jarmusch AK, Jiang L, Kaehler BD, Kang KB, Keefe CR, Keim P, Kelley ST, Knights D, Koester I, Kosciolek T, Kreps J, Langille MGI, Lee J, Ley R, Liu YX, Loftfield E, Lozupone C, Maher M, Marotz C, Martin BD, McDonald D, McIver LJ, Melnik AV, Metcalf JL, Morgan SC, Morton JT, Naimey AT, Navas-Molina JA, Nothias LF, Orchanian SB, Pearson T, Peoples SL, Petras D, Preuss ML, Pruesse E, Rasmussen LB, Rivers A, Robeson MS, 2nd, Rosenthal P, Segata N, Shaffer M, Shiffer A, Sinha R, Song SJ, Spear JR, Swafford AD, Thompson LR, Torres PJ, Trinh P, Tripathi A, Turnbaugh PJ, Ul-Hasan S, van der Hooft JJJ, Vargas F, Vazquez-Baeza Y, Vogtmann E, von Hippel M, Walters W, Wan Y, Wang M, Warren J, Weber KC, Williamson CHD, Willis AD, Xu ZZ, Zaneveld JR, Zhang Y, Zhu Q, Knight R, Caporaso JG. Reproducible, interactive, scalable and extensible microbiome data science using QIIME 2. Nature Biotechnology. 2019;37(8):852–857. doi: 10.1038/s41587-019-0209-9. - DOI - PMC - PubMed
-
- Calapez AR, Serra SRQ, Mortagua A, Almeida SFP, Feio MJ. Unveiling relationships between ecosystem services and aquatic communities in urban streams. Ecological Indicators. 2023;153(1):110433. doi: 10.1016/j.ecolind.2023.110433. - DOI
MeSH terms
Substances
LinkOut - more resources
Full Text Sources
