

Electrochemical approach for the analysis of DNA degradation in native DNA and apoptotic cells
- PMID: 38371963
- PMCID: PMC10873663
- DOI: 10.1016/j.heliyon.2024.e25602
Electrochemical approach for the analysis of DNA degradation in native DNA and apoptotic cells
Abstract
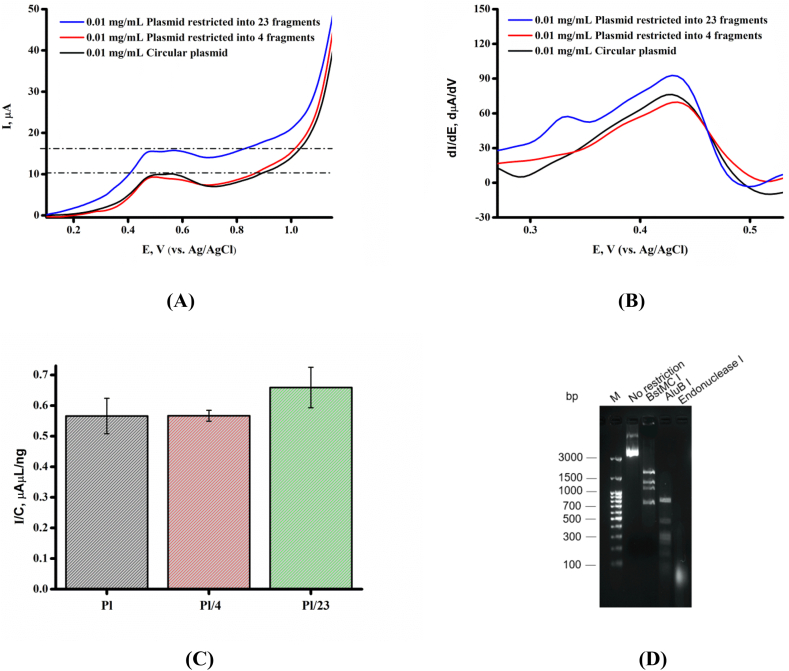
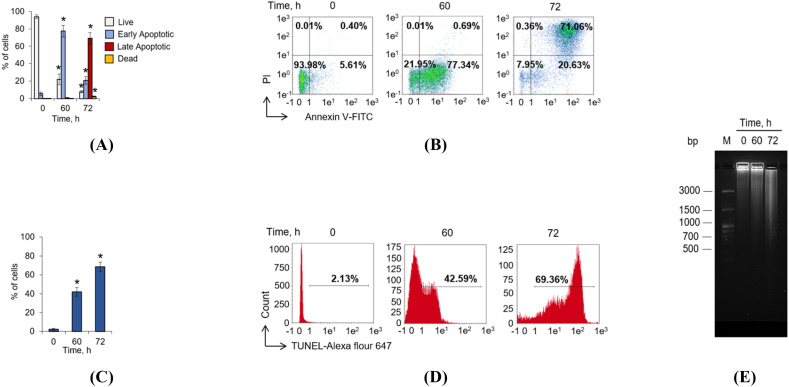
The aim of this work was to develop an electrochemical approach for the analysis of DNA degradation and fragmentation in apoptotic cells. DNA damage is considered one of the major causes of human diseases. We analyzed the cleavage processes of the circular plasmid pTagGFP2-N and calf thymus DNA, which were exposed to restriction endonucleases (the restriction endonucleases BstMC I and AluB I and the nonspecific endonuclease I). Genomic DNA from the leukemia K562 cell line was used as a marker of the early and late (mature) stages of apoptosis. Registration of direct electrochemical oxidation of nucleobases of DNA molecules subjected to restriction endonuclease or apoptosis processes was proposed for the detection of these biochemical events. Label-free differential pulse voltammetry (DPV) has been used to measure endonuclease activities and DNA damage using carbon nanotube-modified electrodes. The present DPV technique provides a promising platform for high-throughput screening of DNA hydrolases and for registering the efficiency of apoptotic processes. DPV comparative analysis of the circular plasmid pTagGFP2-N in its native supercoiled state and plasmids restricted to 4 and 23 parts revealed significant differences in their electrochemical behavior. Electrochemical analysis was fully confirmed by means of traditional methods of DNA analysis and registration of apoptotic process, such as gel electrophoresis and flow cytometry.
Keywords: Apoptosis; Bioelectrochemistry; Carbon nanotubes; DNA fragmentation; Modified electrodes; Plasmid DNA.
© 2024 The Authors.
Conflict of interest statement
The authors declare that they have no known competing financial interests or personal relationships that could have appeared to influence the work reported in this paper.
Figures


Similar articles
-
A Mg(2+)-dependent endonuclease is responsible for internucleosomal DNA fragmentation in human B lymphoblastic IM9 cells.Biochem Mol Biol Int. 1998 Dec;46(6):1259-68. doi: 10.1080/15216549800204832. Biochem Mol Biol Int. 1998. PMID: 9891860
-
Electrochemical monitoring of the interaction between 4-nonylphenol and DNA by graphite and carbon nanotube modified graphite electrodes.Anal Sci. 2010;26(10):1065-9. doi: 10.2116/analsci.26.1065. Anal Sci. 2010. PMID: 20953049
-
DNA sensing on glassy carbon electrodes by using hemin as the electrochemical hybridization label.Anal Bioanal Chem. 2002 Apr;373(8):710-6. doi: 10.1007/s00216-002-1301-3. Epub 2002 May 4. Anal Bioanal Chem. 2002. PMID: 12194028
-
Endonuclease activation and chromosomal DNA fragmentation during apoptosis in leukemia cells.Int J Hematol. 2006 Jul;84(1):31-7. doi: 10.1007/BF03342699. Int J Hematol. 2006. PMID: 16867899 Review.
-
DNA fragmentation in apoptosis.Cell Res. 2000 Sep;10(3):205-11. doi: 10.1038/sj.cr.7290049. Cell Res. 2000. PMID: 11032172 Review.
Cited by
-
Emerging Electrochemical Approaches for the Early Detection of Programmed Cell Death.ACS Omega. 2025 Jul 31;10(31):34106-34122. doi: 10.1021/acsomega.5c05652. eCollection 2025 Aug 12. ACS Omega. 2025. PMID: 40821520 Free PMC article. Review.
-
Degradation of Poliovirus Sabin 2 Genome After Electron Beam Irradiation.Vaccines (Basel). 2025 Jul 31;13(8):824. doi: 10.3390/vaccines13080824. Vaccines (Basel). 2025. PMID: 40872910 Free PMC article.
References
-
- Ogier-Denis E., Codogno P. Autophagy: a barrier or an adaptive response to cancer. Biochim. Biophys. Acta. 2003;1603:113–128. 10.1016/S0304-419X(03)00004-0. - PubMed
-
- Edinger A.L., Thompson C.B. Death by design: apoptosis, necrosis and autophagy. Curr. Opin. Cell Biol. 2004;16:663–669. 10.1016/j.ceb.2004.09.011. - PubMed
-
- Danial N.N., Korsmeyer S.J. Cell death critical control points. Cell. 2004;116:205–219. 10.1016/S0092-8674(04)00046-7. - PubMed
-
- Akçapınar R., Garipcan B., Goodarzi V., Uzun L. Designing of various biosensor devices for determination of apoptosis: a comprehensive review. Biochem. Biophys. Res. Commun. 2021;578:42–62. 10.1016/j.bbrc.2021.08.089. - PubMed
-
- Ichim G., Tait S.W. A fate worse than death: apoptosis as an oncogenic process. Nat. Rev. Cancer. 2016;16:539–548. 10.1038/nrc.2016.58. - PubMed
LinkOut - more resources
Full Text Sources
