

Construction of molecular subtype model of osteosarcoma based on endoplasmic reticulum stress and tumor metastasis-related genes
- PMID: 38371978
- PMCID: PMC10873750
- DOI: 10.1016/j.heliyon.2024.e25691
Construction of molecular subtype model of osteosarcoma based on endoplasmic reticulum stress and tumor metastasis-related genes
Abstract
Introduction: Osteosarcoma, the prevailing primary bone malignancy among children and adolescents, is frequently associated with treatment failure primarily due to its pronounced metastatic nature.
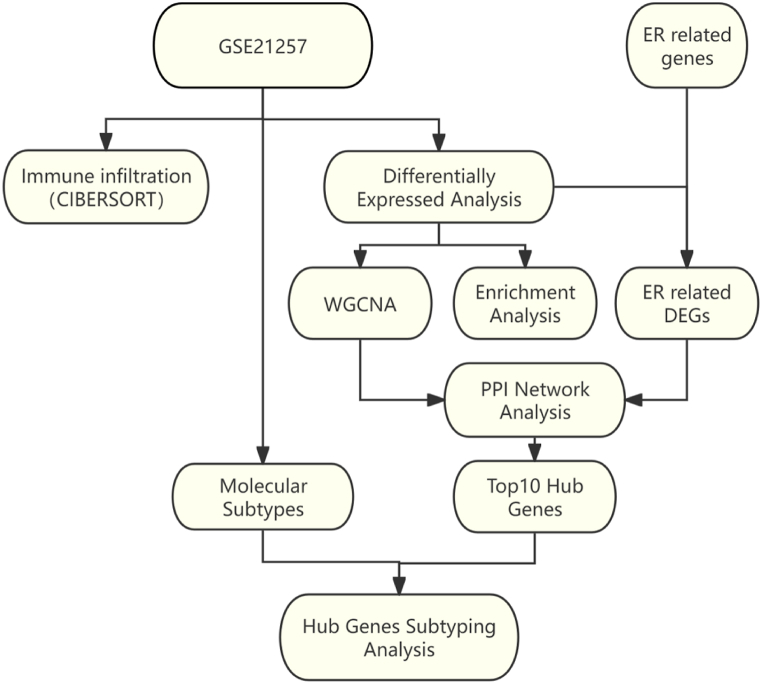
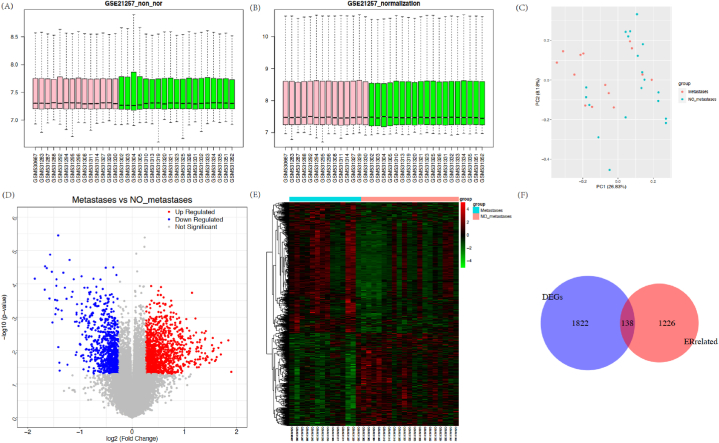
Methods: This study aimed to establish potential associations between hub genes and subtypes for the treatment of metastatic osteosarcoma. Differentially expressed genes were extracted from patients diagnosed with metastatic osteosarcoma and a control group of non-metastatic patients, using the publicly available gene expression profile (GSE21257). The intersection of these gene sets was determined by focusing on endoplasmic reticulum (ER) stress-related genes sourced from the GeneCards database. We conducted various analytical techniques, including functional and pathway enrichment analysis, WGCNA analysis, protein-protein interaction (PPI) network construction, and assessment of immune cell infiltration, using the intersecting genes. Through this analysis, we identified potential hub genes.
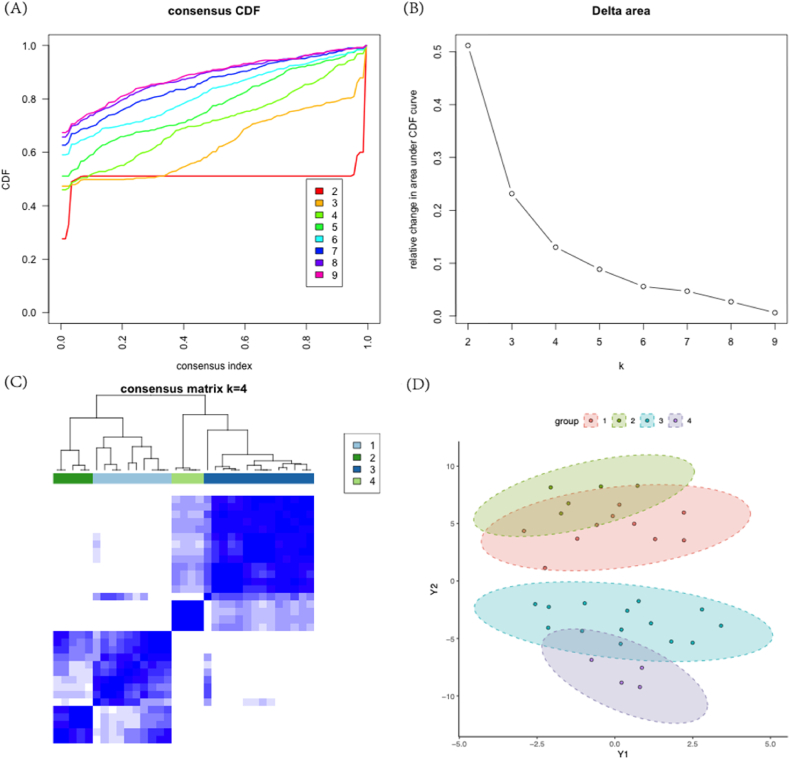
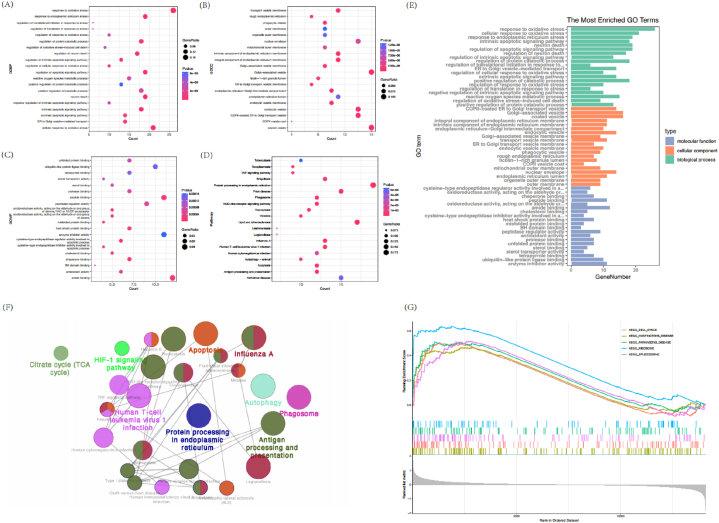
Results: Osteosarcoma subtype models were developed using molecular consensus clustering analysis, followed by an examination of the associations between each subtype and hub genes. A total of 138 potential differentially expressed genes related to endoplasmic reticulum (ER) stress were identified. These genes were further investigated using Gene Ontology (GO), Kyoto Encyclopedia of Genes and Genomes (KEGG), and Gene Set Enrichment Analysis (GSEA) pathways. Additionally, the PPI interaction network revealed 38 interaction relationships among the top ten hub genes. The findings of the analysis revealed a strong correlation between the extent of immune cell infiltration and both osteosarcoma metastasis and the expression of hub genes. Notably, the differential expression of the top ten hub genes was observed in osteosarcoma clusters 1 and 4, signifying their significant association with the disease.
Conclusion: The identification of ten key genes linked to osteosarcoma metastasis and endoplasmic reticulum stress bears potential clinical significance. Additionally, exploring the molecular subtype of osteosarcoma has the capacity to guide clinical treatment decisions, necessitating further investigations and subsequent clinical validations.
Keywords: Endoplasmic reticulum stress; Metastasis; Osteosarcoma; Subtype analysis.
© 2024 The Authors.
Conflict of interest statement
The authors declare that they have no known competing financial interests or personal relationships that could have appeared to influence the work reported in this paper.
Figures
- 2
Molecular Subtype Construction
- 3
Enrichment analysis
- 4
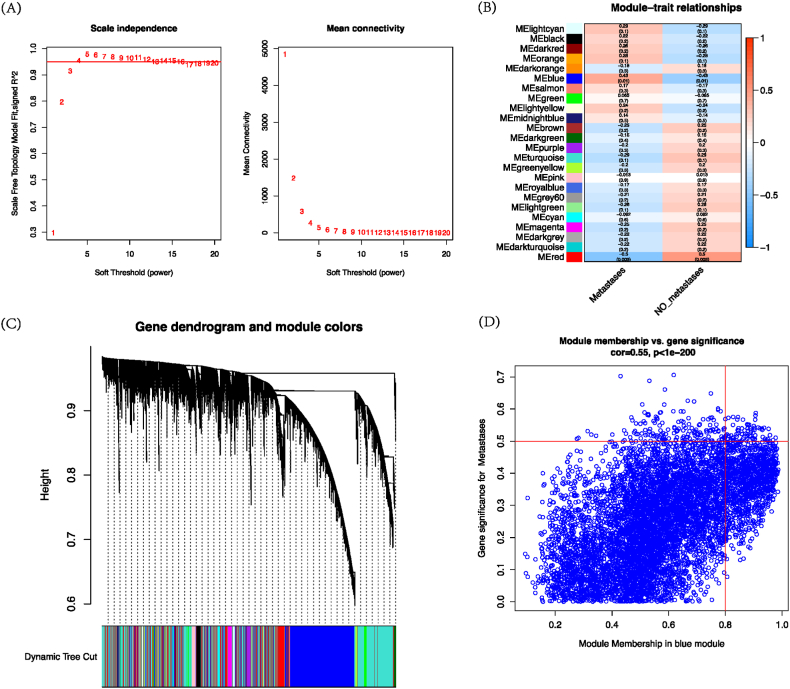
WGCNA analysis
- 5
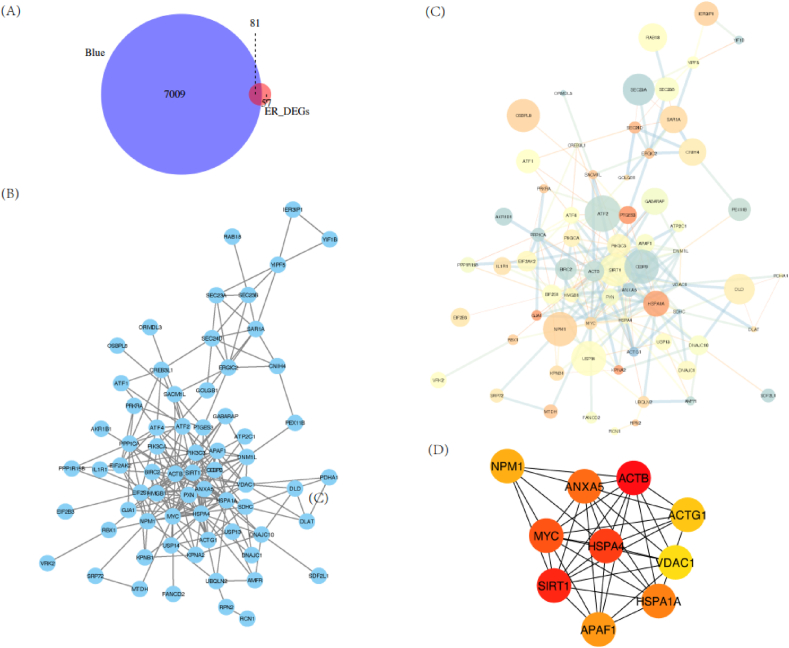
PPI Interaction Network
- 6
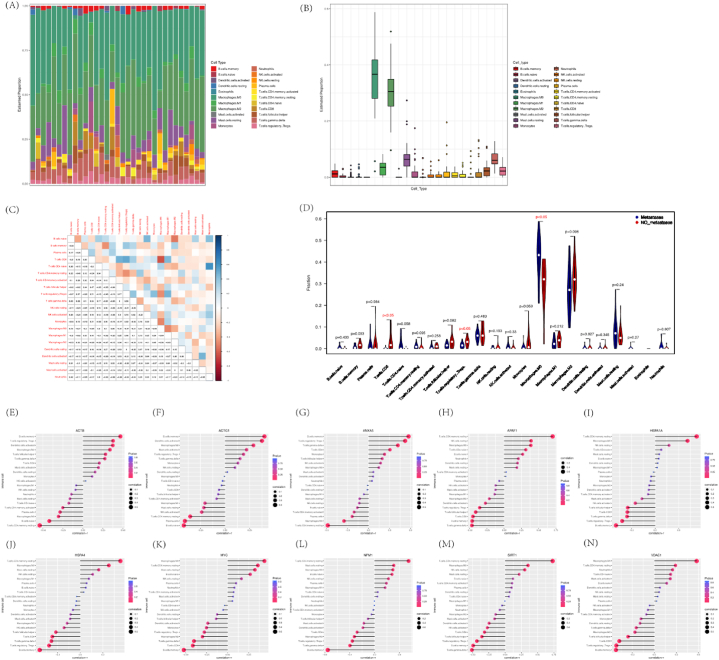
Immune infiltration correlation analysis
- 7
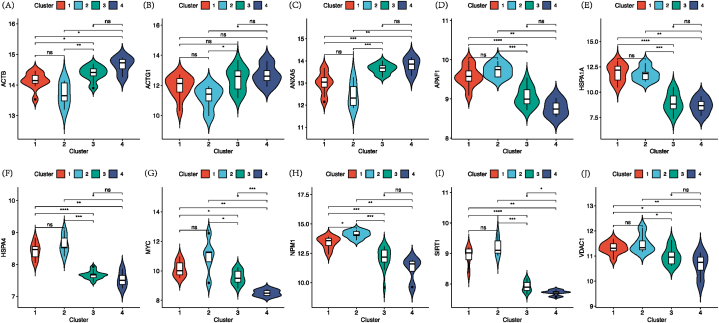
Correlation analysis between Hub genes and different molecular subtypes
Similar articles
-
Identification of key biomarkers and functional pathways in osteosarcomas with lung metastasis: Evidence from bioinformatics analysis.Medicine (Baltimore). 2021 Feb 12;100(6):e24471. doi: 10.1097/MD.0000000000024471. Medicine (Baltimore). 2021. PMID: 33578541 Free PMC article.
-
Identification of differentially expressed ER stress-related genes and their association with pulmonary arterial hypertension.Respir Res. 2024 May 24;25(1):220. doi: 10.1186/s12931-024-02849-4. Respir Res. 2024. PMID: 38789967 Free PMC article.
-
Comprehensive analysis of endoplasmic reticulum stress and immune infiltration in major depressive disorder.Front Psychiatry. 2022 Oct 24;13:1008124. doi: 10.3389/fpsyt.2022.1008124. eCollection 2022. Front Psychiatry. 2022. PMID: 36353576 Free PMC article.
-
The identification of key genes and pathways in hepatocellular carcinoma by bioinformatics analysis of high-throughput data.Med Oncol. 2017 Jun;34(6):101. doi: 10.1007/s12032-017-0963-9. Epub 2017 Apr 21. Med Oncol. 2017. PMID: 28432618 Free PMC article.
-
PODN is a prognostic biomarker and correlated with immune infiltrates in osteosarcoma.Cancer Cell Int. 2021 Jul 17;21(1):381. doi: 10.1186/s12935-021-02086-5. Cancer Cell Int. 2021. PMID: 34273970 Free PMC article. Review.
Cited by
-
Exploratory Analysis of Molecular Subtypes in Early-Stage Osteosarcoma: Identifying Resistance and Optimizing Therapy.Cancers (Basel). 2025 May 16;17(10):1677. doi: 10.3390/cancers17101677. Cancers (Basel). 2025. PMID: 40427174 Free PMC article.
-
Novel lipid metabolism factor HIBCH inhibitor synergizes with doxorubicin to suppress osteosarcoma growth and impacts clinical prognosis in osteosarcoma patients.J Bone Oncol. 2024 Nov 24;49:100652. doi: 10.1016/j.jbo.2024.100652. eCollection 2024 Dec. J Bone Oncol. 2024. PMID: 39687213 Free PMC article.
References
LinkOut - more resources
Full Text Sources
