. 2024 May;23(5):e14109.
doi: 10.1111/acel.14109. Epub 2024 Feb 19.

Spatially resolved transcriptome of the aging mouse brain

Affiliations

Spatially resolved transcriptome of the aging mouse brain

Cheng Wu et al. Aging Cell. 2024 May.

Abstract

Brain aging is associated with cognitive decline, memory loss and many neurodegenerative disorders. The mammalian brain has distinct structural regions that perform specific functions. However, our understanding in gene expression and cell types within the context of the spatial organization of the mammalian aging brain is limited. Here we generated spatial transcriptomic maps of young and old mouse brains. We identified 27 distinguished brain spatial domains, including layer-specific subregions that are difficult to dissect individually. We comprehensively characterized spatial-specific changes in gene expression in the aging brain, particularly for isocortex, the hippocampal formation, brainstem and fiber tracts, and validated some gene expression differences by qPCR and immunohistochemistry. We identified aging-related genes and pathways that vary in a coordinated manner across spatial regions and parsed the spatial features of aging-related signals, providing important clues to understand genes with specific functions in different brain regions during aging. Combined with single-cell transcriptomics data, we characterized the spatial distribution of brain cell types. The proportion of immature neurons decreased in the DG region with aging, indicating that the formation of new neurons is blocked. Finally, we detected changes in information interactions between regions and found specific pathways were deregulated with aging, including classic signaling WNT and layer-specific signaling COLLAGEN. In summary, we established a spatial molecular atlas of the aging mouse brain (http://sysbio.gzzoc.com/Mouse-Brain-Aging/), which provides important resources and novel insights into the molecular mechanism of brain aging.

Keywords: aging; brain; cell types; gene expression; spatial transcriptome.


Conflict of interest statement

All authors declare no competing financial interests.

Figures
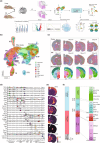
FIGURE 1
FIGURE 1
Spatial transcriptional mapping of young and old mouse brains. (a) Overview of the workflow. We performed spatial transcriptome (ST) sequencing on a total of 8 slices of young and aged mouse brains, and then used bioinformatics analysis methods to identify spatial domain and aging‐related genes. (b) Uniform manifold approximation and projection (UMAP) visualization of 27,089 spots, colored by clusters. Hippocampal region (HIP); Retrohippocampal region (RHP); Thalamus (TH); Hypothalamus (HY); Midbrain (MB); Hindbrain (HB); Ventricular systems (VC). (c) Visualization of spot clusters on 8 spatial slices; ABA divides regions based on anatomy (as a reference) (bottom). (d) Violin diagram of the expression of known brain region‐related genes in spot clusters. Hippocampal formation (HPF, including HIP and RHP). (e) The expression distribution of region‐related genes on slice‐B1. (f) Distribution of spots according to region definitions.
FIGURE 2
FIGURE 2
Spatial‐specific transcriptional changes in aging brain. (a) Scatter chart showing DEGs (dots) in 27 brain spatial domains. The red/blue dots show that gene expression increases/decreases with aging, and the top and bottom show the number of DEGs. (b) Violin plot showing gene expression differences of C1qa, Cryab, S100b, Bc1, Tfrc, Eno1, Penk and Nrgn in Isocortex, HPF, TH, HY and MB regions using spatial data; *p < 0.05, **p < 0.01, ***p < 0.001, ****p < 0.0001 by t‐test. (c) Histogram showing the relative fold expression of C1qa, Cryab, S100b, Bc1, Tfrc, Eno1, Penk and Nrgn in Isocortex, HPF, TH, HY and MB regions by qPCR; *p < 0.05, **p < 0.01, ***p < 0.001, ****p < 0.0001 by t‐test.
FIGURE 3
FIGURE 3
Spatial‐specific transcriptional changes in genes associated with cellular senescence and inflammation. (a) Heatmap showing cellular senescence‐related genes in 6 brain spatial domains. The red/blue box colors represent up/downregulation with aging, respectively. (b) Heatmap showing positive regulation of inflammatory response related genes in 6 brain spatial domains. The red/blue box colors represent up/downregulation with aging, respectively. (c) Histogram showing the relative fold expression of B2m and Ctss in Isocortex, HPF, TH, HY and MB regions by qPCR; *p < 0.05, **p < 0.01 by t‐test. (d, e) Heatmap showing mitochondrial genes and ribosomal protein genes in 6 brain spatial domains. The red/blue box colors represent up‐ and downregulation with aging, respectively.
FIGURE 4
FIGURE 4
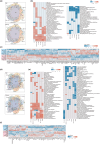
Aging‐related transcriptional changes in cerebral cortex subregions. (a) Venn diagram showing commonalities and differences between the DEGs of the isocortex subregions. (b) Heatmap showing aging‐related pathways (p < 0.05 and q < 0.25) across 6 subregions. The legend corresponds to the normalized enrichment scores (Nes), which represent the strength of the relationship between the phenotype and gene signature. Positive Nes values (red) indicate the pathways enriched in the old group, while negative Nes values (blue) indicate those enriched in the young group. (c) Heatmap showing both up/downregulated gene expression in the isocortex subregions. (d) Venn diagram showing commonalities and differences between the DEGs of HPF subregions. (e) Heatmap showing aging‐related pathways (p < 0.05 and q < 0.25) across HPF subregions. (f) Heatmap showing both up/downregulated gene expression in the HPF subregions.
FIGURE 5
FIGURE 5
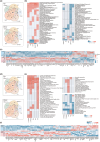
Aging‐related transcriptional changes in brainstem subregions. (a) Venn diagram showing commonalities and differences between the DEGs of IB subregions (TH and HY). (b) Heatmap showing aging‐related pathways (p < 0.05) across interbrain subregions. (c) Heatmap showing both up/downregulated gene expression in the IB subregions. (d) Venn diagram showing commonalities and differences between the DEGs of MB subregions. (e) Heatmap showing aging‐related pathways (p < 0.05) across midbrain subregions. (f) Heatmap showing both up/downregulated gene expression in the MB subregions.
FIGURE 6
FIGURE 6
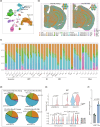
Integrating spatial transcriptomics and single‐cell RNA‐seq. (a) UMAP plot of all cells, colored by cell type; n = 37,096 individual cells. (b) Spatial distribution of cell types. Left and right are the distributions on slice B1 (young) and slice B2 (old), respectively. (c) Histogram showing the proportion of cell types of spots contained in each spatial domain in young and old mice. (d) Pie chart showing the proportion of cell types contained in the VIS‐L2/3/4 and VIS‐L5/6 regions in slice B. (e) Violins showing the expression of Ifi27 in cell types (top) and regions (bottom), the p‐value is calculated by t‐test. (f) Relative fold expression of Ifi27 in Isocortex by qPRC, the p‐value is calculated by t‐test.
FIGURE 7
FIGURE 7
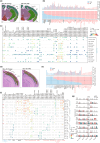
Communication between different regions based on spatial transcriptional maps. (a) The large regions were identified in the slices (slice‐B1 and slice‐B2), which mainly include the iscortex, HPF, TH, HY, MB, and fiber tracts. (b) All the significant signaling pathways were ranked based on their differences in overall information flow within the inferred networks between slice‐B from young and old mice. The overall information flow of a signaling network is calculated by summarizing all the communication probabilities in that network. The signaling pathways colored red were more enriched in old individuals, and those colored blue were more enriched in young individuals. (c) Comparison of the significant ligand–receptor pairs between slice B from young and old. The dot color reflects communication probabilities, and the dot size represents the computed p values. Empty space means the communication probability is zero. The p values were computed from a one‐sided permutation test. (d) Distribution of the isocortex subregions on slices (slice‐B1 and slice‐B2). (e) All the significant signaling pathways were ranked based on their differences in overall information flow within the inferred networks between isocortex subregions in young and old mice. (f) Comparison of the significant ligand–receptor pairs between isocortex subregions in young (slice‐B1) and old mice (slice‐B2). (g) Violin plot showing COLLAGEN signal‐related ligand receptor gene expression in different subregions from slice‐B.

Similar articles

Cited by

References

    1. Balasubramanian, P. , Branen, L. , Sivasubramanian, M. K. , Monteiro, R. , & Subramanian, M. (2021). Aging is associated with glial senescence in the brainstem ‐ implications for age‐related sympathetic overactivity. Aging (Albany NY), 13(10), 13460–13473. 10.18632/aging.203111 - DOI - PMC - PubMed
    1. Barnes, C. A. (2003). Long‐term potentiation and the ageing brain. Philosophical Transactions of the Royal Society of London. Series B, Biological Sciences, 358(1432), 765–772. 10.1098/rstb.2002.1244 - DOI - PMC - PubMed
    1. Berchtold, N. C. , Coleman, P. D. , Cribbs, D. H. , Rogers, J. , Gillen, D. L. , & Cotman, C. W. (2013). Synaptic genes are extensively downregulated across multiple brain regions in normal human aging and Alzheimer's disease. Neurobiology of Aging, 34(6), 1653–1661. 10.1016/j.neurobiolaging.2012.11.024 - DOI - PMC - PubMed
    1. Berchtold, N. C. , Cribbs, D. H. , Coleman, P. D. , Rogers, J. , Head, E. , Kim, R. , Beach, T. , Miller, C. , Troncoso, J. , Trojanowski, J. Q. , Zielke, H. R. , & Cotman, C. W. (2008). Gene expression changes in the course of normal brain aging are sexually dimorphic. Proceedings of the National Academy of Sciences of the United States of America, 105(40), 15605–15610. 10.1073/pnas.0806883105 - DOI - PMC - PubMed
    1. Bouhrara, M. , Cortina, L. E. , Rejimon, A. C. , Khattar, N. , Bergeron, C. , Bergeron, J. , Melvin, D. , Zukley, L. , & Spencer, R. G. (2020). Quantitative age‐dependent differences in human brainstem myelination assessed using high‐resolution magnetic resonance mapping. NeuroImage, 206, 116307. 10.1016/j.neuroimage.2019.116307 - DOI - PMC - PubMed

Publication types