. 2024 May 1;30(9):1934-1944.
doi: 10.1158/1078-0432.CCR-23-3477.

Targeting Dendritic Cell Dysfunction to Circumvent Anti-PD1 Resistance in Head and Neck Cancer

Affiliations

Targeting Dendritic Cell Dysfunction to Circumvent Anti-PD1 Resistance in Head and Neck Cancer

Shin Saito et al. Clin Cancer Res. .

Abstract

Purpose: Neoadjuvant anti-PD1 (aPD1) therapies are being explored in surgically resectable head and neck squamous cell carcinoma (HNSCC). Encouraging responses have been observed, but further insights into the mechanisms underlying resistance and approaches to improve responses are needed.

Experimental design: We integrated data from syngeneic mouse oral carcinoma (MOC) models and neoadjuvant pembrolizumab HNSCC patient tumor RNA-sequencing data to explore the mechanism of aPD1 resistance. Tumors and tumor-draining lymph nodes (DLN) from MOC models were analyzed for antigen-specific priming. CCL5 expression was enforced in an aPD1-resistant model.

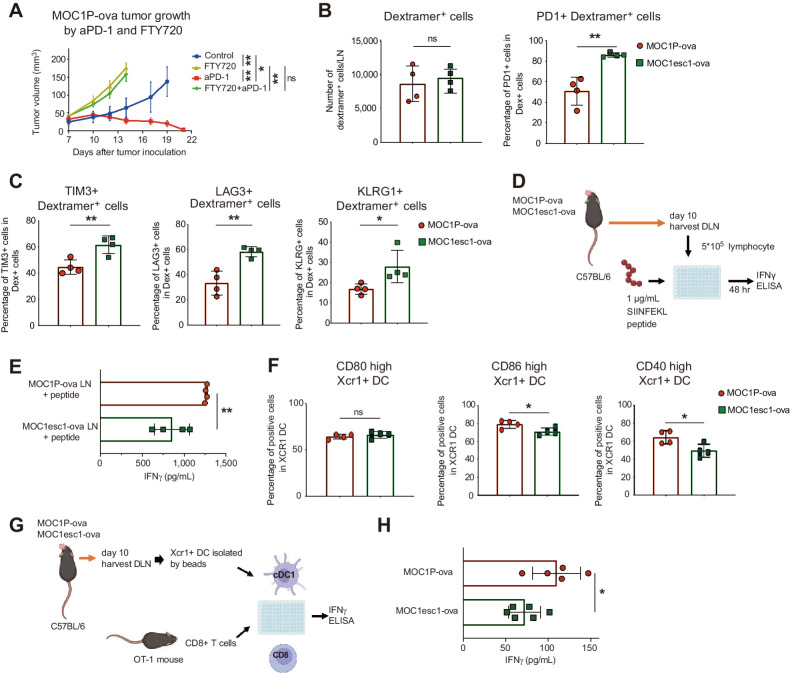
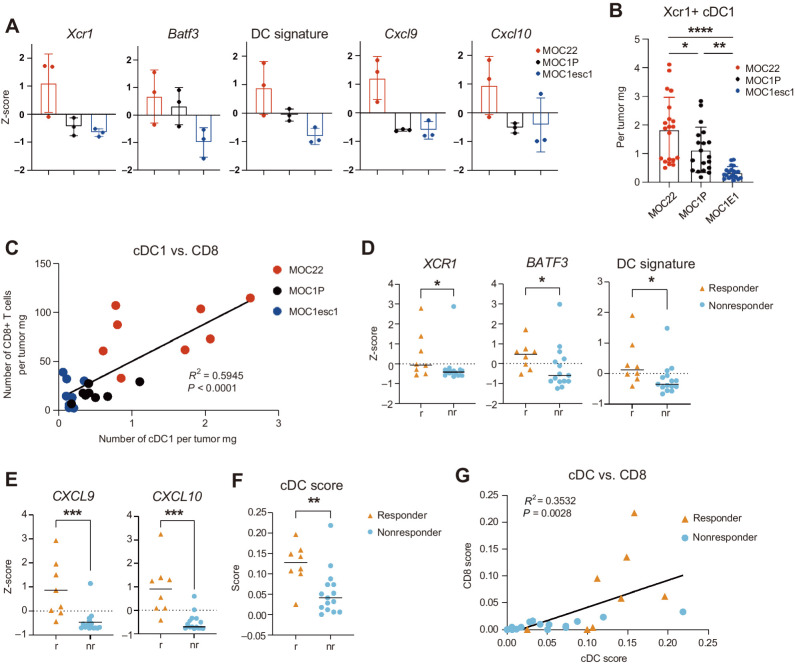
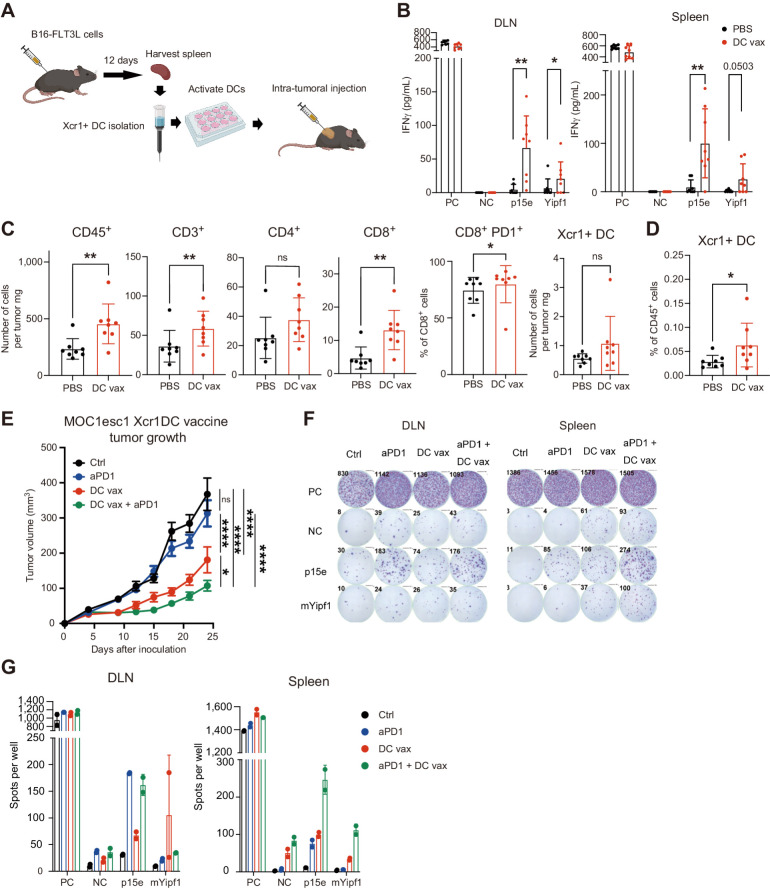
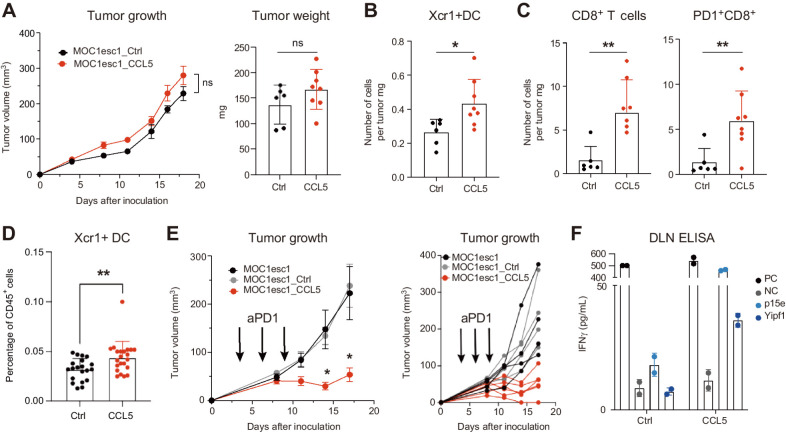
Results: An aPD1-resistant mouse model showed poor priming in the tumor DLN due to type 1 conventional dendritic cell (cDC1) dysfunction, which correlated with exhausted and poorly responsive antigen-specific T cells. Tumor microenvironment analysis also showed decreased cDC1 in aPD1-resistant tumors compared with sensitive tumors. Following neoadjuvant aPD1 therapy, pathologic responses in patients also positively correlated with baseline transcriptomic cDC1 signatures. In an aPD1-resistant model, intratumoral cDC1 vaccine was sufficient to restore aPD1 response by enhancing T-cell infiltration and increasing antigen-specific responses with improved tumor control. Mechanistically, CCL5 expression significantly correlated with neoadjuvant aPD1 response and enforced expression of CCL5 in an aPD1-resistant model, enhanced cDC1 tumor infiltration, restored antigen-specific responses, and recovered sensitivity to aPD1 treatment.

Conclusions: These data highlight the contribution of tumor-infiltrating cDC1 in HNSCC aPD1 response and approaches to enhance cDC1 infiltration and function that may circumvent aPD1 resistance in patients with HNSCC.


Figures

Figure 1. aPD1-resistant model shows reduced priming due to cDC1 dysfunction in tumor-draining lymph nodes (DLN). A, In vivo tumor growth of MOC1P-ova after treatment with aPD1 (250 μg IP on days 3, 6, and 9) or FTY720 (10 μg IP daily from one day before inoculation). (n = 4 tumors for each group). B and C, Flow-cytometric analysis of MOC1P-ova/MOC1esc1-ova DLN on day 10 after inoculation (n = 4 for each group, representative data of two independent experiments). D, Representation of experiment in E. E, Tumor DLN from orthotopically inoculated MOC1P-ova/esc1-ova–bearing mice were harvested on day 10 and stimulated with SIINFEKL peptide for 48 hours to assess IFNγ production by ELISA (n = 4 for each group, representative data of two independent experiments). F, Flow-cytometric analysis of costimulatory markers on Xcr1+ DC in DLN of MOC1P-ova/MOC1esc1-ova harvested 10 days after tumor inoculation (n = 4 for each group, representative data of two independent experiments). G, Representation of experiment in H. H, Xcr1+ DC magnetically isolated from DLN of MOC1P-ova/MOC1esc1-ova were cocultured with CD8+ OT1 T cells to test priming ability evaluated by IFNγ ELISA (n = 5–6, representative data of two independent experiments). Data are plotted as mean ± SEM in A and individual data with mean ± SD in all other panels. Data were analyzed using two-way ANOVA with multiple comparison for A and Mann–Whitney U test to generate two-tailed P values in B, C, E, F, and H. (D and G were generated by using BioRender under granted license.) *, P < 0.05; **, P < 0.01; ns, not significant.
Figure 1.
aPD1-resistant model shows reduced priming due to cDC1 dysfunction in tumor-draining lymph nodes (DLN). A,In vivo tumor growth of MOC1P-ova after treatment with aPD1 (250 μg IP on days 3, 6, and 9) or FTY720 (10 μg IP daily from one day before inoculation). (n = 4 tumors for each group). B and C, Flow-cytometric analysis of MOC1P-ova/MOC1esc1-ova DLN on day 10 after inoculation (n = 4 for each group, representative data of two independent experiments). D, Representation of experiment in E. E, Tumor DLN from orthotopically inoculated MOC1P-ova/esc1-ova–bearing mice were harvested on day 10 and stimulated with SIINFEKL peptide for 48 hours to assess IFNγ production by ELISA (n = 4 for each group, representative data of two independent experiments). F, Flow-cytometric analysis of costimulatory markers on Xcr1+ DC in DLN of MOC1P-ova/MOC1esc1-ova harvested 10 days after tumor inoculation (n = 4 for each group, representative data of two independent experiments). G, Representation of experiment in H. H, Xcr1+ DC magnetically isolated from DLN of MOC1P-ova/MOC1esc1-ova were cocultured with CD8+ OT1 T cells to test priming ability evaluated by IFNγ ELISA (n = 5–6, representative data of two independent experiments). Data are plotted as mean ± SEM in A and individual data with mean ± SD in all other panels. Data were analyzed using two-way ANOVA with multiple comparison for A and Mann–Whitney U test to generate two-tailed P values in B, C, E, F, and H. (D and G were generated by using BioRender under granted license.) *, P < 0.05; **, P < 0.01; ns, not significant.
Figure 2. aPD1 sensitivity is correlated with DC infiltration in mouse and human HNSCC. A, Bulk RNA-sequencing data from MOC22 tumors harvested on day 17, and MOC1P and MOC1-esc1 tumors harvested on day 14 after implantation are shown for indicated genes as z-score (n = 3 for each model). “DC signature” represents the average z-score of Batf3, Xcr1, Clnk, and Clec9a (10). B, Flow-cytometric data of Xcr1+ cDC1 from MOC22, MOC1P and MOC1esc1 tumors harvested on day 12 after inoculation (numbers are shown as cells per tumor mg, n = 19–20, pooled data from three independent experiments, gating strategies shown in Supplementary Fig. S2G). C, Correlation of cDC1 and CD8+ T cells from flow-cytometric data in MOC22, MOC1P, and MOC1esc1 tumors harvested on day 12 after inoculation (numbers are shown as cells per tumor mg, n = 8, representative data from three independent experiments, gating strategies shown in Supplementary Fig. S2F and S2G). D and E, Bulk RNA-seq data of indicated genes in pretreatment tumor samples from patients who received subsequent aPD1 therapy shown as z-score (n = 8 responders and n = 15 nonresponders). “DC signature” represents the average z-score of BATF3, XCR1, CLNK, and CLEC9a (10). F and G, cDC and CD8 score calculated from a general cell type enrichment analysis webtool (23) using the same dataset as in D. Individual data with mean ± SD are plotted in A and B, and individual data with mean are plotted in D–F. Data were analyzed using the Mann–Whitney U test to generate two-tailed P values in D–F and Pearson correlation coefficient in C and G and one-way ANOVA followed by Tukey's multiple comparison for B. *, P < 0.05; **, P < 0.01; ***, P < 0.001; ****, P < 0.0001.
Figure 2.
aPD1 sensitivity is correlated with DC infiltration in mouse and human HNSCC. A, Bulk RNA-sequencing data from MOC22 tumors harvested on day 17, and MOC1P and MOC1-esc1 tumors harvested on day 14 after implantation are shown for indicated genes as z-score (n = 3 for each model). “DC signature” represents the average z-score of Batf3, Xcr1, Clnk, and Clec9a (10). B, Flow-cytometric data of Xcr1+ cDC1 from MOC22, MOC1P and MOC1esc1 tumors harvested on day 12 after inoculation (numbers are shown as cells per tumor mg, n = 19–20, pooled data from three independent experiments, gating strategies shown in Supplementary Fig. S2G). C, Correlation of cDC1 and CD8+ T cells from flow-cytometric data in MOC22, MOC1P, and MOC1esc1 tumors harvested on day 12 after inoculation (numbers are shown as cells per tumor mg, n = 8, representative data from three independent experiments, gating strategies shown in Supplementary Fig. S2F and S2G). D and E, Bulk RNA-seq data of indicated genes in pretreatment tumor samples from patients who received subsequent aPD1 therapy shown as z-score (n = 8 responders and n = 15 nonresponders). “DC signature” represents the average z-score of BATF3, XCR1, CLNK, and CLEC9a (10). F and G, cDC and CD8 score calculated from a general cell type enrichment analysis webtool (23) using the same dataset as in D. Individual data with mean ± SD are plotted in A and B, and individual data with mean are plotted in D–F. Data were analyzed using the Mann–Whitney U test to generate two-tailed P values in D–F and Pearson correlation coefficient in C and G and one-way ANOVA followed by Tukey's multiple comparison for B. *, P < 0.05; **, P < 0.01; ***, P < 0.001; ****, P < 0.0001.
Figure 3. Xcr1+ DC vaccine is sufficient to induce antigen-reactive T cells, alter the tumor microenvironment and attenuate tumor growth in aPD1-resistant mouse model. A, DC generation, Xcr1+ DC isolation, and Xcr1+ DC intratumoral vaccine. Vaccination was performed with 1 million Xcr1+ DC. B, CD8+ T cells were isolated from intratumoral DC-vaccinated MOC1esc1 mouse DLN or spleen on day 14 after inoculation, stimulated with peptides and evaluated for reactivity by IFNγ ELISA. PC; positive control (PMA + ionomycin), NC; negative control (no peptides), or p15e or mYipf1 peptide (0.1 μmol/L) stimulation. (n = 8, representative data of two independent experiments). C and D, Flow-cytometric analysis of MOC1esc1 tumors (C) and DLN (D) treated with intratumoral PBS or DC vaccine on days 1/4/7 after inoculation and harvested on day 14 after tumor inoculation. (n = 8, representative data of two independent experiments, gating strategies shown in Supplementary Fig. S2F and S2G). E, Tumor growth of aPD1-resistant MOC1esc1 model treated with intratumoral PBS (on days 1/4/7), intraperitoneal aPD1 (250 μg on days 3/6/9), intratumoral DC vaccine (1 million Xcr1+ DC on days 1/4/7), or the combination. n = 8 per group. F, DLN and spleens of MOC1esc1-bearing mice treated as in E (separate experiment) were harvested on day 13 after inoculation and cocultured with indicated peptides to test reactivity evaluated by IFNγ ELISPOT. PC; positive control (PMA + ionomycin), NC; negative control (no peptides), or p15e + mYipf1 peptide (0.1 μmol/L) stimulation. (n = 8 per group). G, Quantification of spots analyzed in experiment F. (n = 2). Individual data with mean ± SD are plotted in B–D. Data are plotted as mean ± SEM in E. Data were analyzed using the Mann–Whitney U test to generate two-tailed P values in B–D. Two-way ANOVA with multiple comparison was used for growth curve analysis in E. (A was generated by using BioRender under granted license.) *, P < 0.05; **, P < 0.01; ****, P < 0.0001.
Figure 3.
Xcr1+ DC vaccine is sufficient to induce antigen-reactive T cells, alter the tumor microenvironment and attenuate tumor growth in aPD1-resistant mouse model. A, DC generation, Xcr1+ DC isolation, and Xcr1+ DC intratumoral vaccine. Vaccination was performed with 1 million Xcr1+ DC. B, CD8+ T cells were isolated from intratumoral DC-vaccinated MOC1esc1 mouse DLN or spleen on day 14 after inoculation, stimulated with peptides and evaluated for reactivity by IFNγ ELISA. PC; positive control (PMA + ionomycin), NC; negative control (no peptides), or p15e or mYipf1 peptide (0.1 μmol/L) stimulation. (n = 8, representative data of two independent experiments). C and D, Flow-cytometric analysis of MOC1esc1 tumors (C) and DLN (D) treated with intratumoral PBS or DC vaccine on days 1/4/7 after inoculation and harvested on day 14 after tumor inoculation. (n = 8, representative data of two independent experiments, gating strategies shown in Supplementary Fig. S2F and S2G). E, Tumor growth of aPD1-resistant MOC1esc1 model treated with intratumoral PBS (on days 1/4/7), intraperitoneal aPD1 (250 μg on days 3/6/9), intratumoral DC vaccine (1 million Xcr1+ DC on days 1/4/7), or the combination. n = 8 per group. F, DLN and spleens of MOC1esc1-bearing mice treated as in E (separate experiment) were harvested on day 13 after inoculation and cocultured with indicated peptides to test reactivity evaluated by IFNγ ELISPOT. PC; positive control (PMA + ionomycin), NC; negative control (no peptides), or p15e + mYipf1 peptide (0.1 μmol/L) stimulation. (n = 8 per group). G, Quantification of spots analyzed in experiment F. (n = 2). Individual data with mean ± SD are plotted in B–D. Data are plotted as mean ± SEM in E. Data were analyzed using the Mann–Whitney U test to generate two-tailed P values in B–D. Two-way ANOVA with multiple comparison was used for growth curve analysis in E. (A was generated by using BioRender under granted license.) *, P < 0.05; **, P < 0.01; ****, P < 0.0001.
Figure 4. CCL5 is highly expressed in aPD1-sensitive tumors. A, Heat map of CC chemokine ligands (CCL) based on pretreatment bulk RNA-seq data between responders (r) and nonresponders (nr). B, CCL5 mRNA expression comparison from bulk RNA-seq data of responders and nonresponders shown as z-score [n = 8 responders (r), n = 15 nonresponders (nr)]. C, CCL5 mRNA expression from bulk RNA-seq data of MOC22 tumors harvested on day 17, and MOC1P and MOC1-esc1 tumors harvested on day 14 after implantation shown as TPM (n = 3 each). D, Correlation of CCL5 mRNA expression (TPM) and cDC score (calculated from Xcell) in pretreatment bulk RNAseq data of HNSCC patient samples (n = 8 responders, n = 15 nonresponders). E, UMAP from scRNA-seq of pretreatment neoadjuvant pembrolizumab clinical trial patient tumors. (n = 2 each responder and nonresponder). F, Feature plots showing single-cell expression levels of CCL5 in responders and nonresponders. G, Distribution plots showing expression level of CCL5 in CD8+ T-cell subsets. Top, responders and bottom, nonresponders. H, Violin plots showing relative expression levels of CCL5 in responders versus nonresponders in baseline tumors. Individual data and mean are plotted in B, and individual data with mean ± SD are plotted in C. Data were analyzed using the Mann–Whitney U test to generate two-tailed P values in B, Pearson correlation coefficient in D. ***, P < 0.001.
Figure 4.
CCL5 is highly expressed in aPD1-sensitive tumors. A, Heat map of CC chemokine ligands (CCL) based on pretreatment bulk RNA-seq data between responders (r) and nonresponders (nr). B, CCL5 mRNA expression comparison from bulk RNA-seq data of responders and nonresponders shown as z-score [n = 8 responders (r), n = 15 nonresponders (nr)]. C, CCL5 mRNA expression from bulk RNA-seq data of MOC22 tumors harvested on day 17, and MOC1P and MOC1-esc1 tumors harvested on day 14 after implantation shown as TPM (n = 3 each). D, Correlation of CCL5 mRNA expression (TPM) and cDC score (calculated from Xcell) in pretreatment bulk RNAseq data of HNSCC patient samples (n = 8 responders, n = 15 nonresponders). E, UMAP from scRNA-seq of pretreatment neoadjuvant pembrolizumab clinical trial patient tumors. (n = 2 each responder and nonresponder). F, Feature plots showing single-cell expression levels of CCL5 in responders and nonresponders. G, Distribution plots showing expression level of CCL5 in CD8+ T-cell subsets. Top, responders and bottom, nonresponders. H, Violin plots showing relative expression levels of CCL5 in responders versus nonresponders in baseline tumors. Individual data and mean are plotted in B, and individual data with mean ± SD are plotted in C. Data were analyzed using the Mann–Whitney U test to generate two-tailed P values in B, Pearson correlation coefficient in D. ***, P < 0.001.
Figure 5. CCL5 recruits cDC1 and restores aPD1 responsiveness. A, Comparative tumor growth of MOC1esc1_Ctrl and MOC1esc1_CCL5 cells in C57BL/6 WT mice. Tumor weight measured on day 16 after tumor inoculation (n = 6 for E1_Ctrl, n = 8 for E1_CCL5, representative data of two independent experiments). B and C, Flow-cytometric analysis of MOC1esc1_Ctrl and MOC1esc1_CCL5 tumors harvested on day 16 after tumor inoculation (n = 6 for E1_Ctrl, n = 8 for E1_CCL5, representative data of two independent experiments, gating strategies shown in Supplementary Fig. S2F and S2G). D, Flow-cytometric analysis of MOC1esc1_Ctrl and MOC1esc1_CCL5 DLN harvested on day 16 after tumor inoculation (n = 20 for Ctrl, n = 22 for CCL5, pooled data from three independent experiments, gating strategies shown in Supplementary Fig. S2G). E, Tumor growth experiment of MOC1esc1, MOC1esc1_Ctrl, and MOC1esc1_CCL5 cells (1×10⁶ cells/mouse) treated with aPD1 (250 μg/mouse) on days 3, 6, and 9 (black arrows). Left shows mean ± SEM, and right shows individual tumor sizes (n = 4 for E1 and E1_Ctrl, n = 6 for E1_CCL5, representative data of two independent experiments). F, CD8+ T cells isolated from aPD1-treated MOC1esc1_Ctrl or MOC1esc1_CCL5 DLN were stimulated with indicated peptides for 48 hours and evaluated by IFNγ ELISA. PC; positive control (PMA + ionomycin), NC; negative control (no peptides, n = 2) or p15e, mYipf1 peptide stimulation (0.1 μmol/L). Data are plotted as mean ± SEM in A and E and individual data with mean ± SD are plotted in A–D and F. Two-way ANOVA with multiple comparison was used for growth curve analysis in A and E. Data were analyzed using the Mann–Whitney U test to generate two-tailed P values in A–D. *, P < 0.05; **, P < 0.01; ns, not significant.
Figure 5.
CCL5 recruits cDC1 and restores aPD1 responsiveness. A, Comparative tumor growth of MOC1esc1_Ctrl and MOC1esc1_CCL5 cells in C57BL/6 WT mice. Tumor weight measured on day 16 after tumor inoculation (n = 6 for E1_Ctrl, n = 8 for E1_CCL5, representative data of two independent experiments). B and C, Flow-cytometric analysis of MOC1esc1_Ctrl and MOC1esc1_CCL5 tumors harvested on day 16 after tumor inoculation (n = 6 for E1_Ctrl, n = 8 for E1_CCL5, representative data of two independent experiments, gating strategies shown in Supplementary Fig. S2F and S2G). D, Flow-cytometric analysis of MOC1esc1_Ctrl and MOC1esc1_CCL5 DLN harvested on day 16 after tumor inoculation (n = 20 for Ctrl, n = 22 for CCL5, pooled data from three independent experiments, gating strategies shown in Supplementary Fig. S2G). E, Tumor growth experiment of MOC1esc1, MOC1esc1_Ctrl, and MOC1esc1_CCL5 cells (1×10⁶ cells/mouse) treated with aPD1 (250 μg/mouse) on days 3, 6, and 9 (black arrows). Left shows mean ± SEM, and right shows individual tumor sizes (n = 4 for E1 and E1_Ctrl, n = 6 for E1_CCL5, representative data of two independent experiments). F, CD8+ T cells isolated from aPD1-treated MOC1esc1_Ctrl or MOC1esc1_CCL5 DLN were stimulated with indicated peptides for 48 hours and evaluated by IFNγ ELISA. PC; positive control (PMA + ionomycin), NC; negative control (no peptides, n = 2) or p15e, mYipf1 peptide stimulation (0.1 μmol/L). Data are plotted as mean ± SEM in A and E and individual data with mean ± SD are plotted in A–D and F. Two-way ANOVA with multiple comparison was used for growth curve analysis in A and E. Data were analyzed using the Mann–Whitney U test to generate two-tailed P values in A–D. *, P < 0.05; **, P < 0.01; ns, not significant.

Similar articles

Cited by

References

    1. Sung H, Ferlay J, Siegel RL, Laversanne M, Soerjomataram I, Jemal A, et al. . Global cancer statistics 2020: GLOBOCAN estimates of incidence and mortality worldwide for 36 cancers in 185 countries. CA Cancer J Clin 2021;71:209–49. - PubMed
    1. Chaturvedi AK, Engels EA, Pfeiffer RM, Hernandez BY, Xiao W, Kim E, et al. . Human papillomavirus and rising oropharyngeal cancer incidence in the United States. J Clin Oncol 2023;41:3081–8. - PMC - PubMed
    1. Ferris RL, Blumenschein G Jr, Fayette J, Guigay J, Colevas AD, Licitra L, et al. . Nivolumab for recurrent squamous cell carcinoma of the head and neck. N Engl J Med 2016;375:1856–67. - PMC - PubMed
    1. Cohen EEW, Soulières D, Le Tourneau C, Dinis J, Licitra L, Ahn MJ, et al. . Pembrolizumab versus methotrexate, docetaxel, or cetuximab for recurrent or metastatic head-and-neck squamous cell carcinoma (KEYNOTE-040): a randomised, open-label, phase 3 study. Lancet 2019;393:156–67. - PubMed
    1. Harrington KJ, Burtness B, Greil R, Soulières D, Tahara M, de Castro G Jr, et al. . Pembrolizumab with or without chemotherapy in recurrent or metastatic head and neck squamous cell carcinoma: updated results of the phase III KEYNOTE-048 study. J Clin Oncol 2023;41:790–802. - PMC - PubMed

Publication types

MeSH terms