. 2024 Aug;46(8):5273-5287.
doi: 10.1109/TPAMI.2024.3363642. Epub 2024 Jul 2.

Deciphering the Feature Representation of Deep Neural Networks for High-Performance AI

Deciphering the Feature Representation of Deep Neural Networks for High-Performance AI

Md Tauhidul Islam et al. IEEE Trans Pattern Anal Mach Intell. 2024 Aug.

Abstract

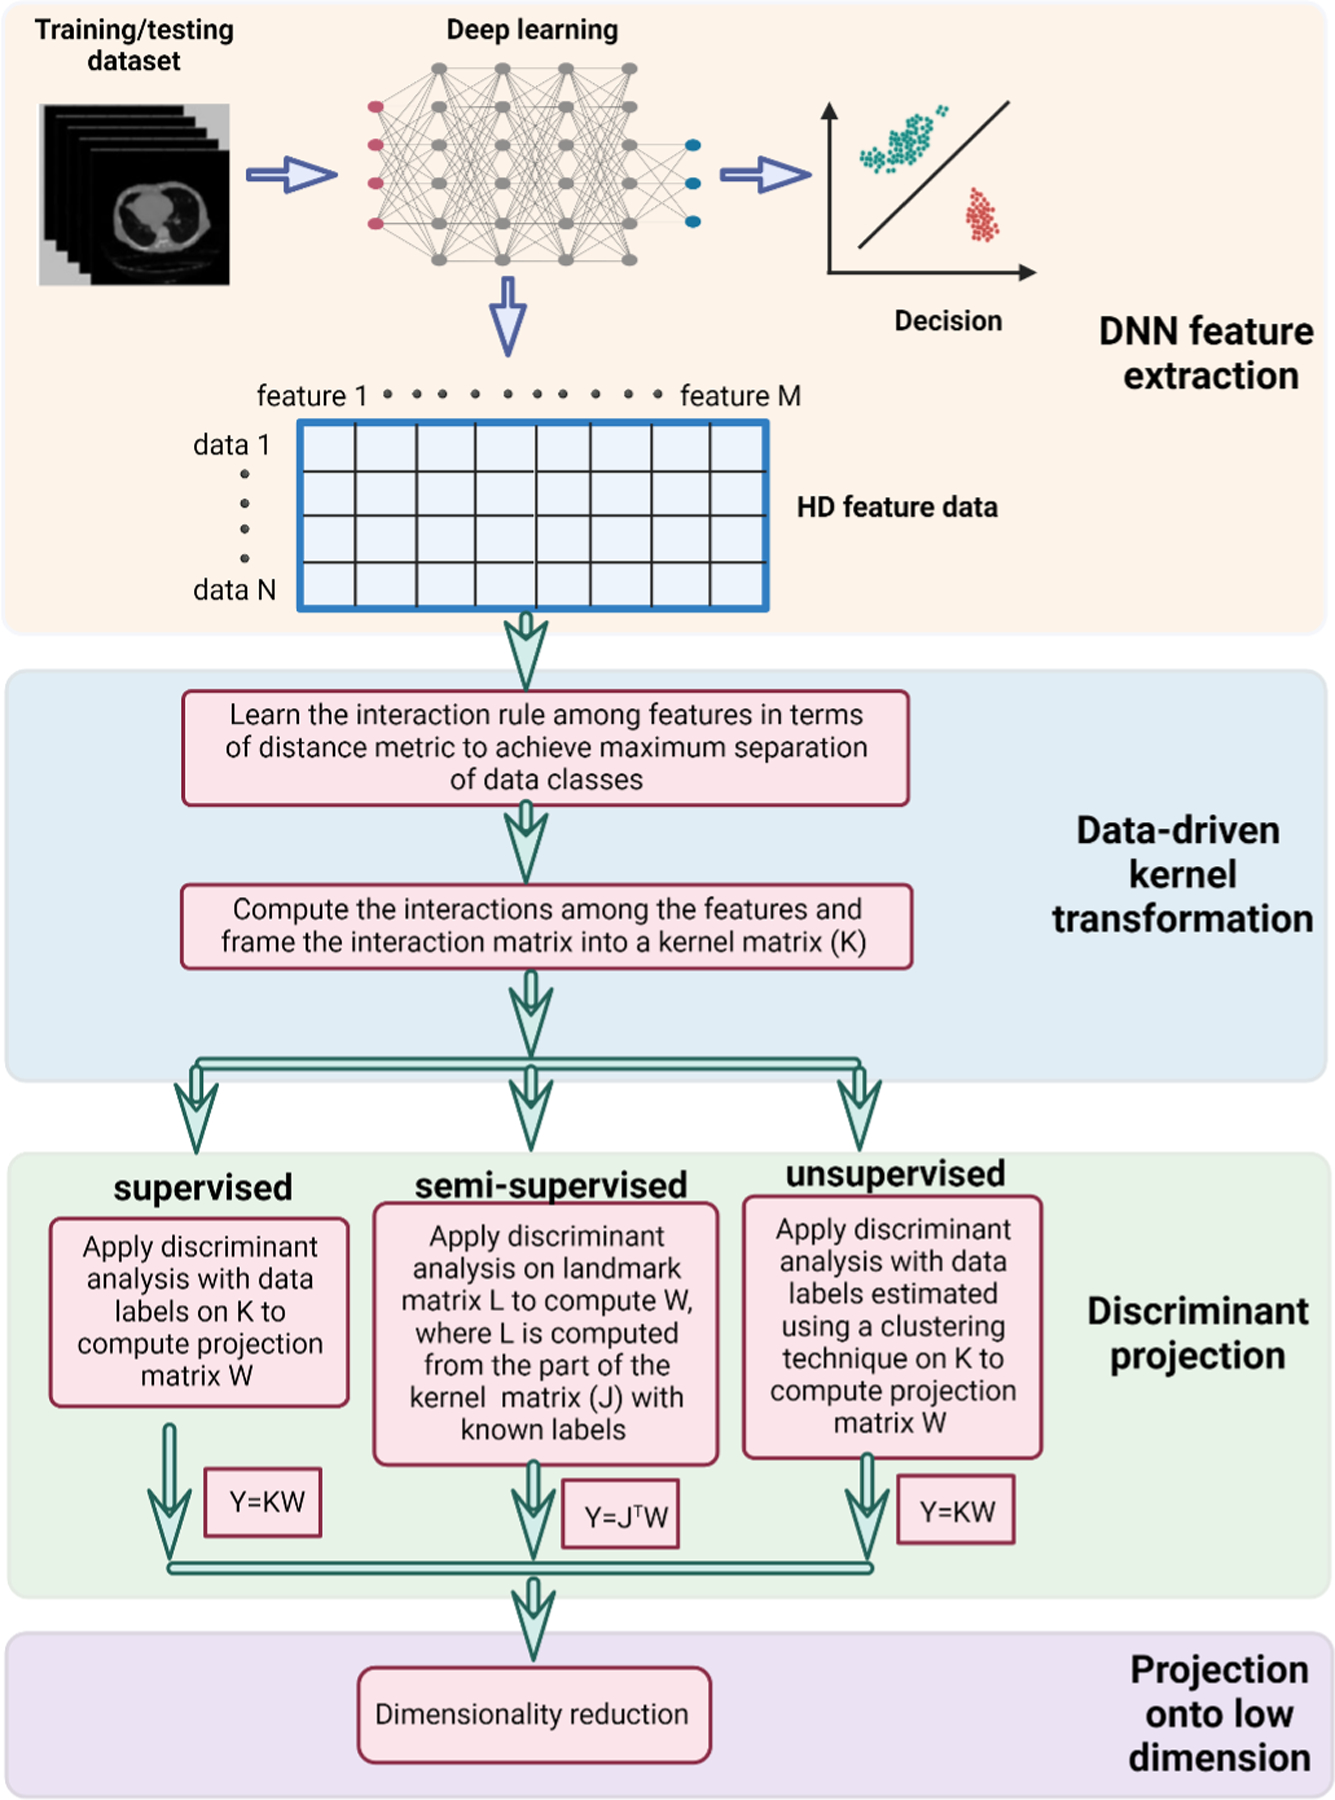
AI driven by deep learning is transforming many aspects of science and technology. The enormous success of deep learning stems from its unique capability of extracting essential features from Big Data for decision-making. However, the feature extraction and hidden representations in deep neural networks (DNNs) remain inexplicable, primarily because of lack of technical tools to comprehend and interrogate the feature space data. The main hurdle here is that the feature data are often noisy in nature, complex in structure, and huge in size and dimensionality, making it intractable for existing techniques to analyze the data reliably. In this work, we develop a computational framework named contrastive feature analysis (CFA) to facilitate the exploration of the DNN feature space and improve the performance of AI. By utilizing the interaction relations among the features and incorporating a novel data-driven kernel formation strategy into the feature analysis pipeline, CFA mitigates the limitations of traditional approaches and provides an urgently needed solution for the analysis of feature space data. The technique allows feature data exploration in unsupervised, semi-supervised and supervised formats to address different needs of downstream applications. The potential of CFA and its applications for pruning of neural network architectures are demonstrated using several state-of-the-art networks and well-annotated datasets across different disciplines.


Figures

Fig. 1:
Fig. 1:
Pipeline of CFA calculation: i) The interactions among the features are computed with the interaction rule learned from the data and then a kernel matrix is formed. ii) LDA is applied on the 1st intermediate representation to construct the 2nd intermediate space with maximized data class separation. iii) UMAP is applied to the second intermediate representation to generate the low dimensional representation. When CFA is used in a supervised format, the data labels are used in LDA. For unsupervised CFA, the labels are created by hierarchical clustering from the interaction matrix. For the semi-supervised format of CFA, a landmark matrix is computed from the part of the kernel matrix with known labels and the projection matrix of LDA is computed from the landmark matrix.
Fig. 2:
Fig. 2:
Analysis of DarkNet features for DR training dataset. t-SNE, UMAP, and Siamese network visualization of features of the DR training data at layer 63, 94, and 174 of DarkNet. The color codes for different classes are as follows: 1) no DR (red), 2) mild (yellow), 3) moderate (green), 4) severe (blue) and 5) proliferative DR (violet).
Fig. 3:
Fig. 3:
Analysis of DarkNet features for DR training dataset. (a-1st row) CFA visualization of features of the DR training data at layer 63, 94, and 174 of DarkNet. (a-2nd row) Visualization of features of layer 174 by semi-supervised CFA for 20% and 80% known training labels, respectively. (a-2nd row, last column) Visualization of features of layer 174 by unsupervised CFA. (b) Accuracy, NMI, AR, and SNR at different layers of the DarkNet. The color codes for different classes are as follows: 1) no DR (red), 2) mild (yellow), 3) moderate (green), 4) severe (blue) and 5) proliferative DR (violet).
Fig. 4:
Fig. 4:
Analysis of feature space data from DR testing dataset. t-SNE, UMAP, Siamese network, and CFA visualization of features of the DR testing data at layer 63, 94, and 174 of DarkNet are shown in rows 1–4, respectively.
Fig. 5:
Fig. 5:
Improvement of DarkNet performance by CFA analysis for DR dataset. (a) CFA visualization of validation data features at layer 94 and 174 after application of feature engineering with 1D and 2D filters. (b) Testing accuracy with and without feature engineering.
Fig. 6:
Fig. 6:
Analysis of GoogLeNet features for chest x-ray dataset. (Row 1-row 4) t-SNE, UMAP, Siamese network, and CFA visualization of features of chest x-ray training data at layer 32, 63, 116 and 142 of GoogLeNet. (Row 5) Testing accuracy with and without feature engineering at different layers. The color codes for the legend are 1) red-normal, 2) yellowish red-hernia, 3) yellow-thickening, 4) greenish yellow-fibrosis, 5) light green-emphysema, 6) deep green-edema, 7) bright green-consolidation, 8) cyanish green-pneumothorax, 9) cyan-pneumonia, 10) light blue-Nodule, 11) deep blue-Mass 12) blueish magenta-Infiltration, 13) light magenta-effusion, 14) deep magenta-cardiomegaly, and 15) redish magenta-atelectasis.
Fig. 7:
Fig. 7:
The architectures of DarkNet and mDarkNet.
Fig. 8:
Fig. 8:
Analysis of the feature space before and after modification of the DarkNet architecture. (a) Visualizations of the training features of the DarkNet and mDarkNet after FCL for the DR dataset by t-SNE, UMAP, Siamese network, and CFA (semisupervised-20% known data labels). (b) The class activation maps for two input images: true positive (1st row) and false negative (2nd row).
Fig. 9:
Fig. 9:
Effect of noise on visualizations from different methods. PCA, t-SNE, UMAP and CFA visualizations of testing data features from GoogLeNet layer 35 are shown in rows 1–4, respectively for testing data. Zoomed CFA results at the center are shown in row 5. Both training and testing data are contaminated at SNR levels of 0, 10, and 30 dB (columns 1–3).
Fig. 10:
Fig. 10:
Visualization of DNN features from ultrasound dataset. PCA (row 1), t-SNE (row 2), UMAP (row 3) and CFA (row 4) visualization of features of validation data at different layers of DarkNet. Red points denote the benign tumor, green points denote the malignant tumor and blue points denote the normal classes.
Fig. 11:
Fig. 11:
Clustering accuracies of features from different layers of SqueezeNet, GoogLeNet, and NASNet trained on histopathology [75], colonoscopy [76], and mammography [77] datasets are shown in rows 1–3, respectively.
Fig. 12:
Fig. 12:
Flowchart showing how CFA can be applied to improve model performance in classification tasks.

References

    1. Heaven D, “Why deep-learning AIs are so easy to fool,” Nature, vol. 574, no. 7777, pp. 163–166, Oct. 2019. - PubMed
    1. Hutson M, “Has artificial intelligence become alchemy?” Science, vol. 360, no. 6388, pp. 478–478, May 2018. - PubMed
    1. Reyes M, Meier R, Pereira S, Silva CA, Dahlweid F-M, von Tengg-Kobligk H, Summers RM, and Wiest R, “On the Interpretability of Artificial Intelligence in Radiology: Challenges and Opportunities,” Radiology: Artificial Intelligence, vol. 2, no. 3, p. e190043, May 2020. - PMC - PubMed
    1. “Towards trustable machine learning,” Nature Biomedical Engineering, vol. 2, no. 10, pp. 709–710, Oct. 2018. - PubMed
    1. Yu K-H, Beam AL, and Kohane IS, “Artificial intelligence in healthcare,” Nature Biomedical Engineering, vol. 2, no. 10, pp. 719–731, Oct. 2018. - PubMed